| Applications | |
Crustal movement before and after the Great East Japan Earthquake
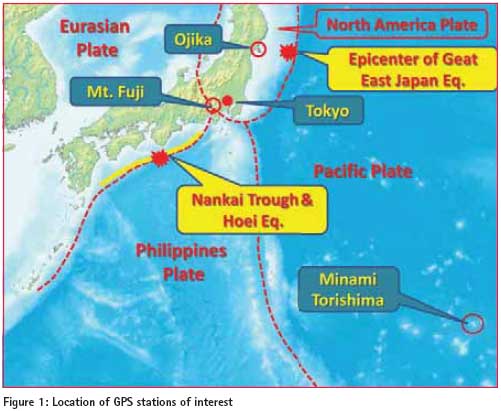
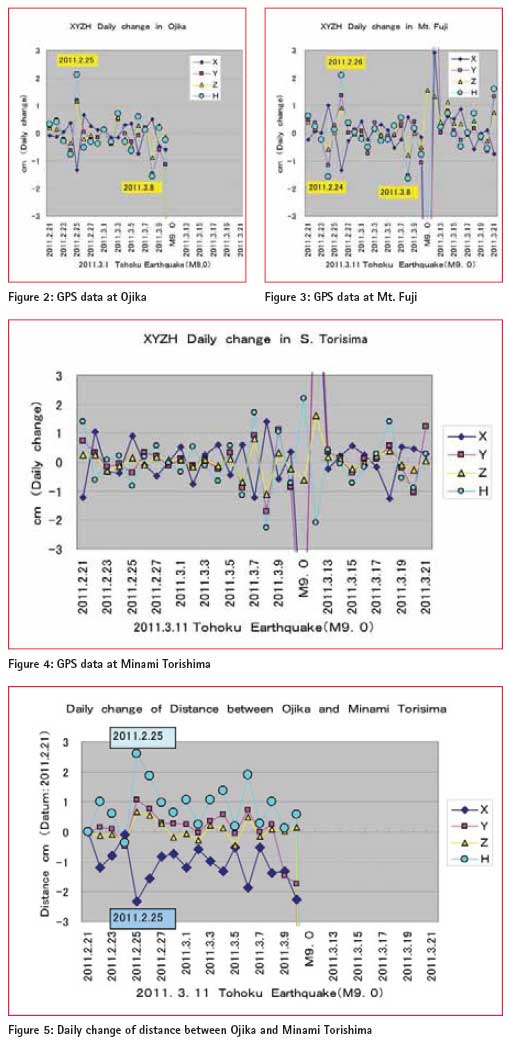
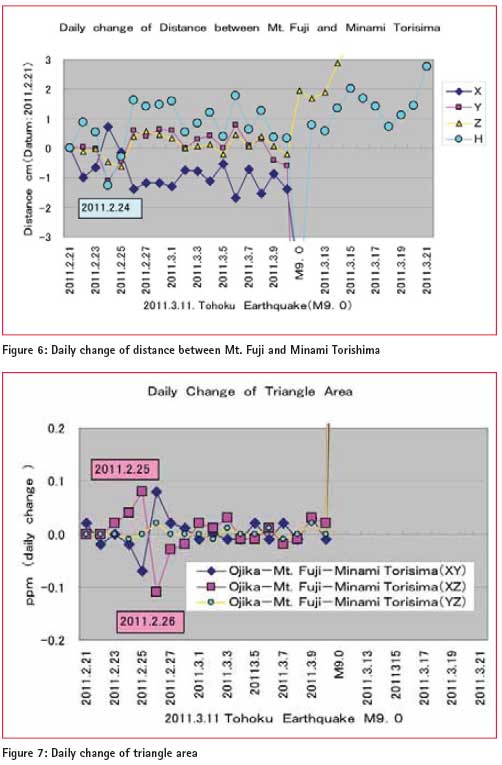
The crustal movement at GPS based control points in Japan has been recorded all over Japan before and after the Great East Japan Earthquake (M9.0) which occurred at 2:46pm on the March 11, 2011. About 20,000 people were killed mainly by the Great Tsunami of 10 to 30 meters in height. Pre-signals before the Great East Japan EarthquakeThe authors presented several papers to this magazine “Coordinates” on the possibility of prediction of earthquakes with GPS data by tracing back to those big earthquakes in the past. A key point to predict earthquakes is to find or analyze pre-signals before earthquakes from GPS daily data. The authors have already analyzed 162 big earthquakes which occurred from January 1, 2000 to December 31, 2007 (eight years) with larger than Magnitude 6 in Japan and the vicinity. As the result we found that the above 162 earthquakes showed abnormal pre-signals with larger than 3 to 5 sigma of the standard deviation. As the epicenter of the Great East Japan Earthquake was located 130 km offshore from Ojika, Miyagi Prefecture, GPS station at Ojika showed the largest movement with 5.3 meters to east south east direction and with 1.3 meters sunk. The epicenter was just at the border between North America Plate and Pacific Plate. The Japanese geodetic origin of latitude and longitude located in Tokyo, about 300 km apart from the epicenter moved about 30 cm. Mt. Fuji, the highest mountain in Japan is located at the junction of three plates; namely North America Plate, Eurasian Plate and Philippines Plate showed an interesting movement because the great earthquake occurred at the border between Pacific Plate and North America Plate. Mt. Fuji erupted in 1707 in the nearest past just 49 days after a huge earthquake named “Hoei” Earthquake with M 8.4 (orM 9.0?) occurred in the Nankai Trough. Therefore many Japanese concern the possibility of eruption of Mt. Fuji after such huge earthquake this time. As there is only one GPS station in Pacific Plate, the crustal movement of GPS station of Minami Torishima would be interesting. Figure 1 shows the location of the three GPS stations of interest and also the four Plates. Figure 2 shows the pre-signals of GPS data at Ojika GPS Station while Figure 3 shows the pre-signals of Mt. Fuji GPS Station. X, Y, Z and H (ellipsoid height) of GPS station are shown. If carefully watched, the movement of H shows abnormal pre-signals of more than 2 cm at Ojika on the 25th February 2011 and 8th March 2011 before the great earthquake. Similarly Mt. Fuji shows abnormal presignals on the 24th and 26th February 2011 and the 8th March 2011. It would be obvious that such pre-signals will provide very useful information about the prediction of huge earthquakes in future. GPS data at Minami Torishima (means by south bird island or Marcus Island in English) located 1,800 km from the mainland of Japan which is on the Pacific Plate shows similar movement with Ojika and Mt. Fuji as shown in Figure 4. On the 7th and 8th March 2011 just 4 and 3 days before the earthquake showed some sort of abnormal movement in H. Figure 5 and Figure 6 shows the daily change of the distance between Minami Torishima and Ojika and between Minami Torishima and Mt. Fuji. Figure 7 shows the daily change of the triangle area connecting Ojika, Mt. Fuji and Minami Torishima. Crustal movement after the Great East Japan Earthquake
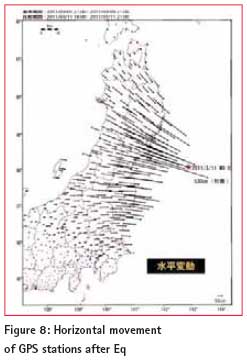
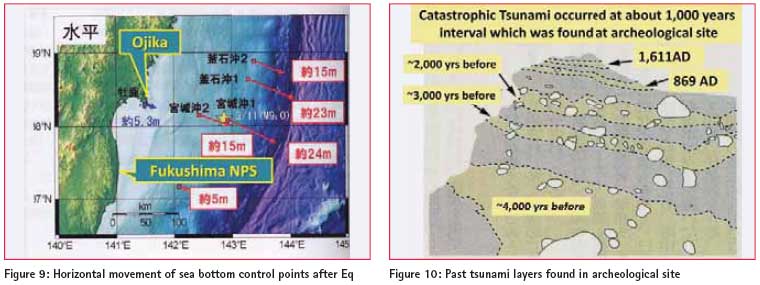
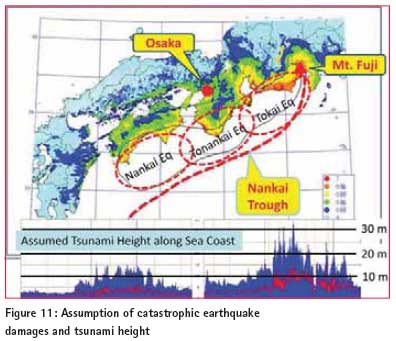
Figure 8 shows the horizontal movement after the great earthquake which was analyzed by GSI. 5.3 meters in maximum moved horizontally and 1.3 meters in maximum sunk at Ojika. Figure 9 shows the horizontal crustal movement of sea bottom control points near the epicenter, which are constructed by Japan Coast Guard. About 24 meters moved horizontally to east south east direction and rose 3 meters vertically which generated the great Tsunami. Assumption of catastrophic Earthquakes and Tsunami in futureThe Japanese government has initiated to reconsider the assumption of catastrophic earthquakes and Tsunami which may occur in future because the biggest mistake at this time was under-estimation of the occurrence of possible disasters. There were few scientific records about the past catastrophic earthquakes and Tsunami except recent disasters. Historical documents are thought unreliable. However recently archeological excavations in coastal regions showed many evidences of multiple layers of past catastrophic Tsunamis as shown in Figure 10. Such scientific evidences are used for computer simulation to check how large earthquake and Tsunami may occur in future.
|




 (8 votes, average: 1.75 out of 5)



Leave your response!