| Applications | |
Spatially Smart Wine
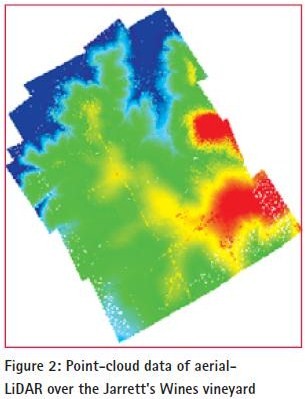
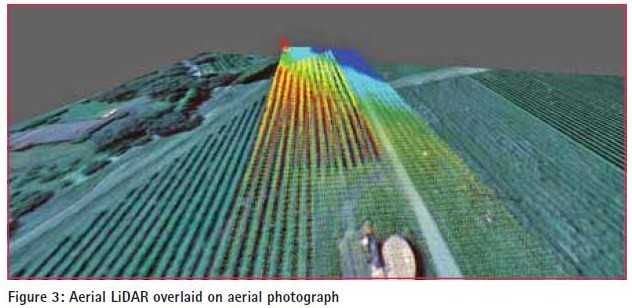
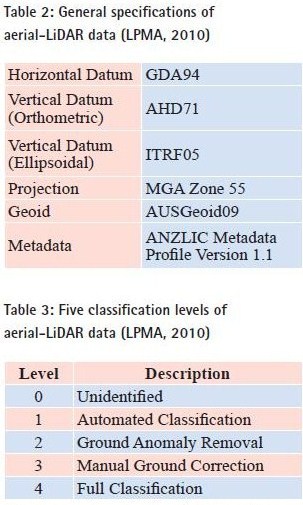
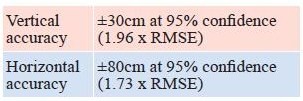
Testing of geospatial technologies – discussionStatus of the vineyardJarrett’s wines, the subject location of this study, had undertaken much of the above however it soon became apparent that data was poorly managed, with a mix of hard- and soft-copy data. The importance of spatial data management is rarely reported in the PV literature, and the ad hoc nature of spatial data acquisition and surveyor involvement limits the opportunities for an effi cient spatial data management system to be implemented. User defi ned needs and goals are critical to spatial planning, and on discussion with the vineyard owner the following needs were identifi ed: GNSS equipmentA selection of GNSS-enabled equipment was tested on site to determine its suitability for operational use in a vineyard, including: Getac Toughbook with ESRI ArcPadLarge amounts of data are associated with PV. Given the surveyor cannot remain on hand, vineyard managers need to be able to easily create, store and retrieve spatial data. Handheld computers are cost-effective and convenient for basic mapping and data collection tasks commonly performed for precision agriculture practices (Koostra et al, 2003). The Getac Toughbook is both GISand GPS-enabled. Note that not all Toughbooks are GPS-enabled, but GPS add-ons are easily attainable. In this case study, the vineyard manager had recently purchased a Toughbook, deeming it necessary for day-to-day tasks within the vineyard including the onsite viewing of spatial data, tracking of tasks and identifi cation of follow-up areas. For example, vineyard inspections to identify follow-up locations for pest and weed treatment, or localised incidents of vine disease. For effi cient and integrated use (i.e. across multiple computers and personnel) some form of mapping software is a requirement. ESRI’s ArcPad was used in this fi eld test, but it is by no means the only, or necessarily the best option. Advanced spatial users can easily develop mapping applications, mashups and queries to best inform vineyard decision making, using either ESRI, open source or other applications. This is identifi ed as a signifi cant market area for further development as no immediate, easy-touse and off-the-shelf options are known to the authors. Wireless connectivity between hardware is a further option under consideration on the farm. Leica Zeno handheld DGPS, ESRI ArcPad enabledThe Leica Zeno is marketed as the ‘most rugged and versatile GNSS/GIS handheld in the market’(Leica Geosystems, 2009). The Zeno provides a differential correction to the GPS coordinates which would allow operators to easily determine the specifi c row and vine for follow up inspections. Leica Viva RTKRTK solutions were found to primarily support the implementation of machine guidance operations. For the effi cient operation of auto-steered machinery, as discussed in the following section, key aspects (especially obstacles) of the vineyard would need to be mapped to a high level of accuracy. Auto-steer technologies would then use RTK position solutions, with operator alerts if the machinery began to run off-centre due to degradation of the RTK signal or other problem such as close proximity to buildings and trees due to multipath. ESRI’s ArcPadArcPad is ESRI’s solution for database access, mapping, GIS, and GPS integration on handheld and mobile devices (ESRI 2002). The most salient feature of ArcPad for our purposes is the ability to customise by: LiDAR TechnologyLiDAR (Light Detection And Ranging) is an optical remote sensing technology which is used to measure properties of scattered light to find range, elevation and other information of a distant target. It records not only the multirefl ection laser pulses that return from the object but the intensity information for each returned laser pulse. The LiDAR system is widely used in geoinformatics, archaeology, geography, geology, geomorphology, seismology, remote sensing and atmospheric physics (Cracknell et al, 2007). Data Specification/DescriptionNote: The classifi ed point cloud is also retained in its primary ellipsoid height format so as to allow for future improvements in the vertical datum and to enable accurate nesting of adjacent elevation data LiDAR AnalysisThe LiDAR was fl own, analysed and processed by the Land, Property and Management Authority (LPMA) in Bathurst (see Table 2 for specifi cations). Data was predominantly processed using TerraMatch and TerraScan MicroStation plug-ins. In addition to that, the plug-in LP360 by QCoherent was also used to check data quality and to verify the processed (fi nal) LAS fi les. TerraMatch was used to apply corrections and changes to the LAS fi les based on (1) heading, (2) roll, (3) pitch, (4) mirror scale and (5) z-shift (elevation) of the points captured based on the movement of the plane relative to the point-capture exercise. The LiDAR datasets were classifi ed according to the “spatial accuracy” of the data. Once a LiDAR survey is determined to be “spatially accurate”, any remaining signifi cant errors in the data are likely to be the result of incorrect classifi cation. For example in wetland areas, due to the lack of actual ground strikes, dense vegetation is often classifi ed as ground by the automated algorithms. A signifi cant amount of manual effort is then required to correct the classifi cation attributes (LPMA, 2010). Table 3 briefl y outlines the fi ve classifi cation levels as defi ned by the LPMA. The levels are allocated by the various automated and manual processes. Successive level refl ects increasing classifi cation completeness and effort. For the purpose of this project, the aerial LiDAR data has been processed to Level 2 standards, where the anomalies found in the ground data were removed to create a ground surface suitable for ortho-rectifi cation of imagery with minimum effort (LPMA, 2010). LiDAR AccuracyThe following discussion on LiDAR accuracy is based on the LPMA standards for processing aerial-LiDAR data (This section is an excerpt from the LPMA Standard LiDAR Product Specifications, Version 2.0, July 2010). Vertical accuracy is assessed by comparing LiDAR point returns against survey check points on bare open ground. It is calculated at the 95% confi dence level as a function of vertical RMSW (as per ICSM Guidelines for Digital Elevation Data 2008 (Retrieved online from the ‘Intergovernmental Committee on Surveying & Mapping’ (ICSM) website – http://www.icsm. gov.au/icsm/elevation/ICSM-Guide linesDigitalElevationDataV1.pdf)). This is undertaken after the standard relative and absolute adjustment of the point cloud data has taken place (i.e. fl ight line matching and shift/ transformation to local AHD). Horizontal accuracy is checked by comparing the LiDAR intensity data viewed as a “TIN” surface against surveyed ground features such as existing photo point targets. To date our analysis of ground comparisons shows that although the vertical accuracy achieved on bare open ground is well within the requirements for Category 1 Digital Elevation Model (DEM) products as specifi ed in the ICSM Guidelines for Digital Elevation Data, local geoid and height control anomalies may degrade the accuracy on large coastal projects. Advantages and Disadvantages of LiDAR TechnologyAdvantages of LiDAR include the high data accuracy, large area coverage and quick data turnaround. The cost is small compared with the acquisition of similar accuracy level data using a team of surveyors and total stations (Note the authors did not pay for the LiDAR data collection in this analysis. An estimated cost was provided by the LPMA, a government department, of around AU$3000 for the 300ha vineyard. As a general comparison, Bramley (2009) reports the cost of multispectral imagery at AUD$30/ha, however prices are decreasing at a rapid rate.).
|




 (56 votes, average: 1.05 out of 5)