| Geodesy | |
Absolute sea level rise estimation using tide records and GPS observations
The issue of re-defining the Egyptian vertical geodetic datum and the existing problem of sea level rising has attained a great attention in the geodetic community |
 |
|
 |
|
 |
|
 |
|
Recent geodetic and oceanographic MSL studies have shown that neither the sea levels nor the land are permanent with respect to time variations. The data analysis of tide gauges produces ‘relative’ sea level changes. However, using tide gauge data alone, it is impossible to distinguish between any true sea level variation and any changes in ground level at a tide gauge site. GPS monitoring can be used to decouple vertical land movements from change in relative MSL, so that tide gauge can provide estimates of changes in absolute MSL. In order to monitor “absolute” changes in sea level, the rates of any vertical land movements at a tide gauge must be determined and subtracted from the resulting rate of tide records [e.g. IPCC, 2001 and Bingley et al, 2000]. Consequently, a sea level monitoring system has been installed at Alexandria tide gauge site containing a GPS receiver as a geodetic monitoring technique to perform this task.
Methodology
Teferle [2000] and Bingley et al [2001] provide a processing approach for GPS data processing and analysis for similar situations. The computational procedures consist of the following steps:
• Obtaining GPS raw data of some stations of the International Geodynamic Service (IGS) global high-precision GPS network.
• Processing the dual-frequency GPS data of the TG GPS station with the IGS stations on a 24-hour basis to produce ionospherically-free double difference observables with integer ambiguities not fixed.
• The tropospheric delays are mitigated by using Saastamoinen model.
• Constraining the IGS stations to their precise coordinates relative to the most recent International Terrestrial Reference Frame (ITRF) definition.
• The obtained height time series of the TG GPS station is firstly fitted to a linear regression model in a least squares sense.
• From this regression model, an estimate of the linear velocity is obtained.
• The daily height estimates are differenced from the linear velocity estimates to obtain a residual time series.
• A de-trended height time series is then obtained by computing the weighted root mean square (WRMS) of the height residuals weighted by the standard errors of the daily height estimates.
• Then, any height residual found to be greater than three times the WRMS is defined as an outlier and removed from the height time series.
• Another linear regression model is fitted to the clean height time series in order to obtain a revised linear velocity estimate of the TG GPS station height.
This processing approach has been utilized in the current research study to estimate a preliminary land movement measure of the Alexandria Tide Gauge station.
The data used and their processing and implementation
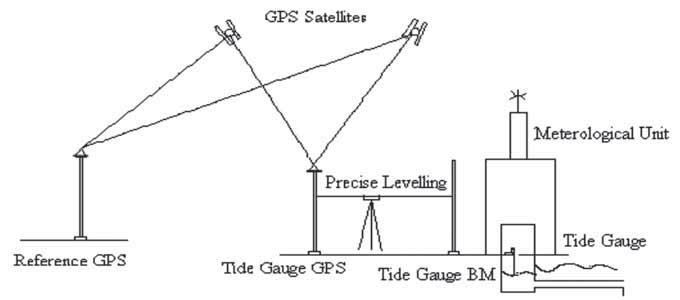
A new Sea Level Observing System (SLOS) installed at the Tide Gauge station in Alexandria consists of three devices integrated together in a unified scheme: a tide gauge, a meteorological unit, and a satellitebased GPS geodetic receiver, Figure 1.
Figure 1: Modern Sea-Level Observing System
Utilized tide gauge instrument
The instrument used is called Wave and Tide Gauge WTG904 Series 3,it measures instantaneously the water column pressure, and converts it to height of water with respect to a specific user-defined location. The pressure sensor output is digitized at a 2 Hz sampling rate via a 14-bit A/D converter controlled by a 32-bit CMOS microprocessor. The tide is calculated continuously and recorded automatically every 10 minutes. The measuring depth range of the gauge is from 0 to 35 meters, with a precision of ± 0.15 % of the measuring range, and a resolution of 0.006 % of the measuring range. Knowing that the depth of the water in the steeling well in Alexandria is approximately 1.5 meter, it can be expected that the accuracy of the measurements is 0.2 cm. The apparatus has a built-in battery-backed 64KB RAM memory that can record measurements up to 90 days [InterOcean, 1999]. . A communication interface (RS485 or RS232C) is used to download the recorded data to an attached computer. There are two ASCII output files, for both tide and wave recorded data, which could be used for further analysis and plotting procedures.
The WTG904 Series 3 instrument measures instantaneously the water column pressure, and converts it to height of water with respect to a specific userdefined location. The instrument has been installed and calibrated so that its zero coincides with the zero of the staff rod fixed inside the tide well. Hence, its recorded readings represent the water level above the Egyptian vertical datum of 1906.
Utilized meteorological device
The utilized device, WMS-14 from Omega Inc., is a state-of-the-art microprocessorbased weather station. The Model WMS- 14 features a combination wind vane and three-cup anemometer with 40 feet of interconnecting cable. The instrument has five accurate and reliable sensors for collecting different types of meteorological data. A wind speed sensor combines a three-cup anemometer and a wind vane on a single axis. This sensor measures, computes, and stores wind speed and wind direction. Barometric pressure is sensed using a piezoresistive sensing element, which responds to changes in pressure with a corresponding change in resistance. The resistance is converted to a voltage form, which the microprocessor calculates the pressure at the elevation at which the barometer is located. Temperature is sensed using a thermistor element whose resistance changes in response to temperature fluctuations. Relative humidity is sensed by changes in capacitance of a thin polymer film as it absorbs moisture, or sheds it to, the surrounding air. The rain gauge used with the WMS-14 is a traditional tipping bucket design. The accuracy measures of the sensors are [Omega, 1999]:
For barometric pressure: ± 5 mb
For Wind Speed: ± 3 mph
For Wind Direction: ± 2o
For Rain precipitation: ± 1 %
For Temperature: ± 2o F
For Relative Humidity: ± 3%
GPS data at the tide gauge station
Lieca GPS system 500 comprises GPS receiver, terminal and post-processing software are used. The SR520 dualfrequency GPS receiver has 12 L1 and 12 L2 continuous data tracking channels that track both codes and carrier phases of the transmitted satellite signals. It tracks up to 12 simultaneously satellites. The collected data is stored on a standard PCMCIA cards that has storage capacity up to 85MB (i.e., up to three months of measurements.
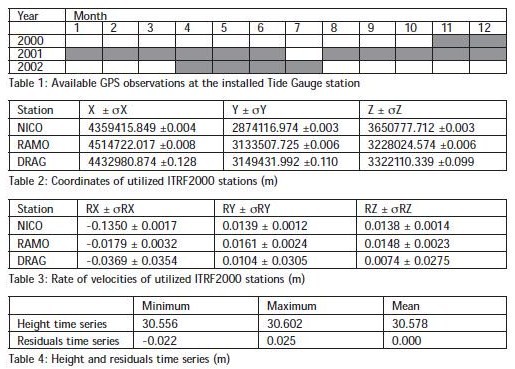
The available 24-hour data sets of the GPS receiver located at Alexandria, depicted in Table 1, consist of almost-continuous 477 days of raw data from November 2000 to July 2002. The existed few gaps in the time series are due to some minor operating problems in the installed GPS receiver.
IGS GPS data
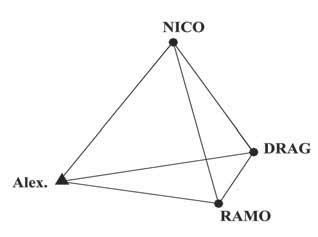
24-hour raw data of three IGS stations have been downloaded in the Rinex format. Those stations, as depicted in Figure 2, named DRAG, RAMO, and NICO, have been selected to be the most nearest IGS stations to Alexandria in order to minimize the baseline lengths as possible. It is a matter of fact that most error sources in GPS networks, especially the tropospheric and ionospheric delays, are baseline dependant errors [e.g. Sorour, 2004].
Figure 2: Utilized IGS global GPS stations
ITRF and its role
The ITRF is realized through the global Cartesian coordinates and linear velocities of a global set of sites equipped with various space geodetic observing systems, and it is maintained by participating agencies. Unlike some of the older terrestrial reference frames, the ITRF allows for the relative motions of sites on the Earth’s surface, due to plate tectonics as well as other local effects. In March of 2001, ITRF2000 was released and it is the most extensive and accurate terrestrial reference frame ever developed and includes positions and velocities for about 800 stations located at about 500 sites. Based on the internal consistency of the independent solutions included in ITRF2000, the global frame scale and origin stability over 10 years is estimated to be accurate in scale to better than 0.5 parts per billion [Altamimi, 2003, and Boucher et al, 2004].
Therefore, the ITRF2000 coordinates (X, Y, Z) and velocities (RX, RY, RZ) at epoch 1997.0 of the three utilized IGS stations have been obtained [http://large. ensg.ign.fr/ITRF/ITRF2000]. Those figures are shown in Table 2 and Table 3.
GPS data processing
It is known that processing GPS long baselines is affected by three main sources of errors, namely the orbital, tropospheric , and ionospheric errors. Hence, a processing strategy has been developed to account for each type of errors in order to come up with the most reliable coordinates of the GPS tide gauge station. This methodology consists of the following criteria:
• The daily final IGS precise orbit (SP3 format) is obtained, e.g. from ftp:// igscb.jpl.nasa.gov/pub/product/, which is available at 12 days latency. This orbit is computed based on the analysis of all available IGS network stations, hence it estimates and gets ride of orbital errors of GPS satellites.
• The daily ionospheric estimated file is obtained from one of the IGS processing data centers, e.g. the CODE center of Bern University (ftp://aiub.unibe.ch). Such a daily solution estimates the ionospheric effects covering the area from latitude -88.32o to latitude 87.46o through the analysis of data collected from 139 global IGS stations. Thus, incorporating these ionospheric models in the processing stage for each GPS day enables the generating of ionofree double difference solutions for almost all processed GPS baselines.
• For the tropospheric errors, apply the Saastamoinen tropospheric model with a 1-hour interval for the estimation of the zenith delay. This global model, with such computation interval, produces accurate estimate of the long baselines components [Rabah, 2004].
• Since the installed GPS at the tide gauge station at Alexandria is surrounded with many obstructions especially the communication radio towers, it is preferable to increase the cut-of angle to 25 o. Even though this criterion reduces the number of the processed GPS data, it gets ride of near-ground multipath reflected signals. In the case in hand, the data processed for each event contain 24- hour continuous series, which produce a high degree of freedom even with such cut-of angle. Saad and Al-Tokhy [2001] have concluded that up to 30o musk angle is suitable in most geodetic and surveying works.
• Since the ITRF2000 coordinates of the utilized IGS stations are referenced to epoch 1997.0, a fundamental step was to compute the corresponding coordinates for each station at each processed day of the available time series. That step has been performed utilizing the next formulas [Boucher et al, 2004]:
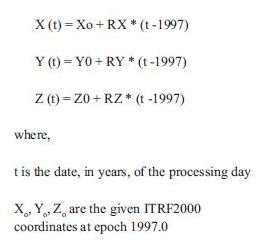
The obtained results
The computed coordinates of the IGS stations are used as fixed values in order to estimate the corresponding coordinates of the GPS station at the tide gauge.
This strategy has been applied for each day of the available 477-day GPS data set. Therefore, a time series of the Alexandria
tide gauge GPS station has been attained.
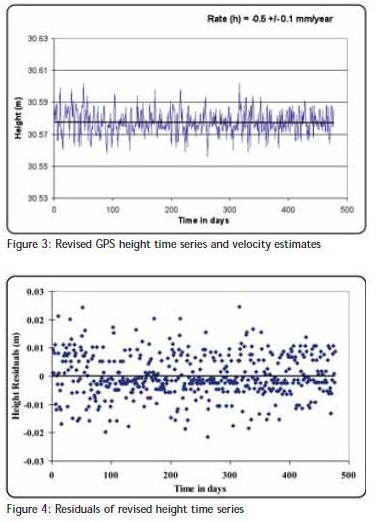
The raw height time series range from 30.562 m to 30.613 m with an average of 30.575 m and a standard deviation equals 0.010 m. The previously mentioned analysis scheme proposed by Teferle [2000] and Bingley et al [2001] has been obeyed. Fitting a linear regression to those values produces an estimate of the height velocity of -0.52 mm/year. The resulted residual values vary between -0.028 m and 0.030 m, with a mean equals zero Then, weighted height residuals have been computed and the residuals that are found to be greater than three times the WRMS are defined as outliers and removed from the height time series. The clean set of heights range from 30.556 m to 30.602 m with an average of 30.578 m and a standard deviation equals 0.008 m. Another linear regression model is fitted to the clean height time series. This model produces a revised linear velocity estimate of the TG GPS station height that is equals -0.47 ± 0.08 mm/year. The results are tabulated in Table 4 and depicted in Figure 3 and Figure 4.
Investigating the horizontal displacement
Even though the geodetic height of the GPS station in hand is the most important item in the context of this research, the horizontal coordinates of the station have been also analyzed.
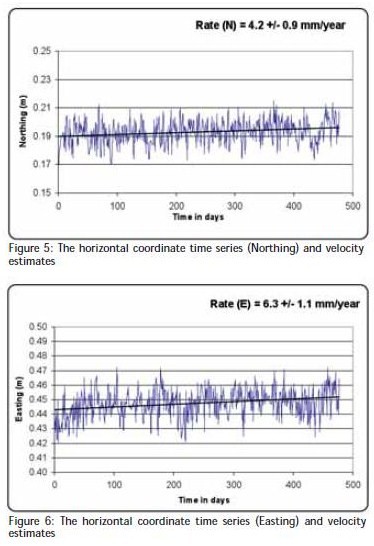
The same analysis strategy has been applied to the horizontal coordinates of the GPS at the tide gauge station. The Cartesian coordinates time series and the horizontal coordinates time series (Northing and Easting) have been obtained ( Figure 5 and Figure 6). The revised trends for the Northing and Easting components have been estimated as 4.2 ± 0.9 mm/ year and 6.3 ± 1.1 mm/year respectively. Similar results have been reported by El-Fiky [2000], where the analysis of GPS observations collected at Helwan revealed that it moves northward, relative to the Eurasian plate, at a rate of 6 mm/year.
Conclusions and recommendations
Having estimating the height trend, the absolute sea level rise rate may be determined. Refereeing to [Faisel, H., 2005], the reliable estimate of the relative sea rise rate has been computed as 1.7 mm/year. Taking out the land deformation rate at the tide gauge station, which is -0.47 mm/year, the absolute sea level rise at Alexandria becomes 2.17 mm/year.
However, because of the relatively short time span of the utilized data sets, it is recommended to continue collecting continuous GPS measurements at the Alexandria tide gauge station and performing further analysis in order to be able to estimate a precise land movement measure and, then, be capable of determining the absolute sea level rise in Egypt. Tide Gauge stations should be established at other well distributed places at the Egyptian shores. Similar investigations should also be done at those proposed stations to assure the obtained results.
References
Altamimi, Z., 2003, ITRF, GPS Permanent stations and the AFREF project, Proceedings of the Second FIG Regional Conference, Morocco, December 2-5.
Bingley, R., Dodson, A., Penna, N., and Booth, S., 2000, Using a combination of continuous and episodic GPS data to separate crustal movements and sea level changes at tide gauges in the UK., Proceedings of the tenth general assembly of the WEGENER project, San Fernando, Spain, Sept. 18-20.
Bingley, R., Dodson, A., Penna, N., Teferle, N., and Baker, T., 2001, Monitoring the vertical land movement component of changes in mean sea level using GPS: Results from tide gauges in the UK, Journal of Geospatial Engineering, V. 3, No. 1, pp. 9-20.
Boucher, C., Altaminim, Z., Sillard, P., and Feissel-Vernier, M., 2004, The ITRF2000, The International Earth Rotation and Reference Systems Service(IERS), Technical Note No. 31, 289 pp.
El-Fiky, G., 2000, Crustal strains in the eastern Mediterranean and middle east as derived from GPS observations, Bull. Eartq. Res. Inst., Univ. Tokyo, Volume 75, pp.105-125.
Faisel, H., 2005, Realization and Redefinition of the Egyptian Vertical Datum Based on Recent Heterogeneous Observations., PhD thesis, Shoubra Faculty of Eng.
InterOcean Systems, Inc., 1999, User manual of model WTG904 Series 3 wave and tide gauge, Revision E., California, USA.
IPCC (Intergovernmental Panel on Climate Change), 2001, Climate change 2001: The scientific basis, UN Technical report.
Leica Inc., 1999, GPS System 500 User Manual, Heerbrugg, Switzerland. Omega, Inc., 1999, WMS-14 Weather station Operator’s Manual, Stamford, CT, USA.
Rabah, M., 2004, Personal communication.
Saad, A., and Al-Tokhy, M., 2001, Precision investigation of the GPS results based on practical observations, CERM, V. 23, No. 2, pp. 719-754.
Sorour, T., 2004, Accuracy study of GPS surveying operations involving long baselines, Ph.D. Dissertation, Ain Shams university, Cairo.
Teferle, N., 2000, Continuous GPS measurements at UK tide gauge sites, 1997-2000, Proceedings of the 13th International Technical Meeting of the Satellite Division of the Institute of Navigation ION-GPS 2000, Utah, USA, September 19-22.
My Coordinates |
EDITORIAL |
|
His Coordinates |
Phil Gabriel, Leocadia I Zak |
|
Conference |
Intergeo 2011 |
|
Mark your calendar |
November 2011 TO October 2012 |
|
News |
INDUSTRY | LBS | GPS | GIS | REMOTE SENSING | GALILEO UPDATE |



 (4 votes, average: 2.25 out of 5)


Good approach but significantly more observations are needed to realistically get out of the white noise for such a study. We have done the same thing here for our coastline at Louisiana State University, but our time series was based on over 5 years of observations. Shinkle and Dokka have published a report under the auspices of the U.S. National Geodetic Survey as NGS Technical Report Number 60 (available from http://www.NOAA.NGS.gov in pdf format along with the complete data set). Using the tide gauge at Grand Isle, LA as a control point, taking into account eustatic sea level rise, subsidence for the northern rim of the Gulf of Mexico was firmly established for the first time in history. Our GPS CORS site at Grand Isle has been in continuous observation for almost 10 years.