|
In this work, the stations description, the first results obtained with four years of tide gauge measurements, the evaluation of the altimetry link campaigns and the comparison of the levels of different measurements are detailed. The statistical analysis of four years of records is provided as well
|
|
 |
Miguel J Sevilla
|
Astronomy and Geodesy.
|
Faculty of Mathematics.
|
University Complutense of Madrid, Spain
|
|
|
 |
Joaquín Zurutuza
|
ARANZADi
|
|
|
 |
Adriana M Martín
|
Astronomy and Geodesy.
|
Faculty of Mathematics.
|
University Complutense of Madrid, Spain
|
|
As of February 2007, a Tide Gauge (TG) was set up in the Pasaia Harbour, in northern Spain (Figure 1). The main reason for such location was the existence of a Permanent GNSS Station and the access to the Internet and electricity in the AZTifacilities 15 m away.
 The aim of the TG is the study of sea level and its variation in time. On the other hand, one of the major goals of the GNSS station is the determination of possible vertical crustal movements in the area of study and the connection of the reference of the tide gauge (TGBM). The TGBM is referred to a local reference system and to the global geocentric reference system (ITRF), so the GNSS data will allow to correct the long sea level records obtained with the TG, to isolate sea level variations of the crustal deformations and to obtain the absolute sea level (Zurutuza and Sevilla 2006). Both the tide gauge and the GNSS antenna are linked to four additional benchmarks (TGBM) that provide information about possible local deformations and are, therefore, used as a support to monitor if any of the TGBMs has disappeared or has been destroyed. (Figure 2). These connections are made through GNSS observations and precision levelling. The link of the GNSS antenna, which is on a building’s roof, with the tide gauge TGBM, is done by reciprocal and simultaneous trigonometric precise levelling to ensure millimeter accuracy. Both the levelling networks between TGBMs as well as the link with the GNSS antenna are observed annually for control. Also, additional weather equipment provides continuous pressure, temperature and humidity data and are gathered in RINEX format. Gravity measurements are also available in the area. All these data allow for instrumental corrections and calibration of instruments and are therefore used to either study possible seasonal variations or to smooth the frequent storms in the Cantabrian Sea effects. The aim of the TG is the study of sea level and its variation in time. On the other hand, one of the major goals of the GNSS station is the determination of possible vertical crustal movements in the area of study and the connection of the reference of the tide gauge (TGBM). The TGBM is referred to a local reference system and to the global geocentric reference system (ITRF), so the GNSS data will allow to correct the long sea level records obtained with the TG, to isolate sea level variations of the crustal deformations and to obtain the absolute sea level (Zurutuza and Sevilla 2006). Both the tide gauge and the GNSS antenna are linked to four additional benchmarks (TGBM) that provide information about possible local deformations and are, therefore, used as a support to monitor if any of the TGBMs has disappeared or has been destroyed. (Figure 2). These connections are made through GNSS observations and precision levelling. The link of the GNSS antenna, which is on a building’s roof, with the tide gauge TGBM, is done by reciprocal and simultaneous trigonometric precise levelling to ensure millimeter accuracy. Both the levelling networks between TGBMs as well as the link with the GNSS antenna are observed annually for control. Also, additional weather equipment provides continuous pressure, temperature and humidity data and are gathered in RINEX format. Gravity measurements are also available in the area. All these data allow for instrumental corrections and calibration of instruments and are therefore used to either study possible seasonal variations or to smooth the frequent storms in the Cantabrian Sea effects.

The tide gauge
A pressure PARONCIENTIFIC tide gauge for measuring water level by immersion with a Digiquartz © 8DP070-GV digital quartz sensor with intelligent electronics model 735 was set up. The data storage is run in a Campbell Datalogger R800. Daily files are produced with a sampling interval of one sample data every minute.
Permanent GNSS station
The GNSS receiver is a dual-frequency Leica GR10 receiver (14 GPS + 12 GLONASS). The antenna is mounted on a stable mast on the roof of the AZTibuilding (Figure 3), at about 15 m from the tide gauge TGBM. It has clear horizon and is free of radio interference. The antenna is a LEIAR25.R4. Absolute Phase Center Variations (PCV) for this antenna are retrieved from the IGS absolute Phase Center Variations ANTEX files IGS05.atx and IGS08.ATX, which contain the latest versions. The approximate coordinates (ETRS89) are:

The daily precise data processing (only GPS data) is performed with the Bernese 5.0 (Dach et al., 2007) software, whereas the rapid daily solutions to check inconsistencies is carried out with our processing software routines: AutoGNSS (Zurutuza et al., 2007), which is based in the PAGE-NT. The main parameters considered are (Zurutuza and Sevilla, 2007, 2009): Sampling interval 30 seconds, elevation mask 10°, Niell tropospheric model estimated every three hours and piece-wise interpolated. Ionosphere almost eliminated with the frequency ‘ionofree’ IGS precise ephemeris. Earth tides and DD correlations are used. The fixed IGS stations are BRUS, EBRE, VILL and YEBE. The GNSS station belongs to the GNSS network of Gipuzkoa.
The control network of the permanent GNSS station has four additional stations nearby. They are used to identify possible local deformations (mainly of the building of AZTi) that could infl uence the determined coordinates of the station (Sevilla et al., 2010, Sevilla and Romero 1991, Garcia and Sevilla 2006). The maximum distance from the GNSS antenna to the control TGBM stations is of about 400 m.
The linking of the GNSS antenna with the sea level and the Spanish Precise Levelling Network (REDNAP) in Pasaia is a rather delicate operation due to the configuration of the route that runs from the terrace where the GNSS antenna is located, to the pier in the port where the tide gauge is located. This link is repeated every year. The major difficulty that arises is to connect with millimetre accuracy two stations separated at a distance of 31.5 m, with a height difference of about 14.6 m and with no direct visibility. For the altimetry control, the TGBM is also linked with a benchmark of the REDNAP.
The instrumentation used is a WILD T2 theodolite, NPT NITRIVAL sighting system (Figure 4) and a PENTAX ATS 101 total station, with a precision over distances of 2 mm + 2 ppm, which includes automatic weather corrections for pressure and temperature. The constants are calibrated on the basis of three pillars of the laboratory of the Faculty of Mathematics of Madrid. For the spirit levelling, a SOKKIA SDL30 digital automatic level is used with millimetre fibreglass staff with bar codes.
 Levelling campaigns have been carried out during the months of July of 2008, 2009, 2010 and 2011. They are scheduled at the same epoch every year in order to have similar weather conditions. As outlined before, the spirit and trigonometric levelling are used to achieve the required accuracies. Simultaneous and reciprocal trigonometric levelling is chosen to link the GNSS station with the tide gauge, while the spirit levelling is used to obtain the altitudes of all the TGBM. Considering the mean of the observed elevations the closing errors rarely exceed 1.5 mm (Valbuena et al., 1966). Levelling campaigns have been carried out during the months of July of 2008, 2009, 2010 and 2011. They are scheduled at the same epoch every year in order to have similar weather conditions. As outlined before, the spirit and trigonometric levelling are used to achieve the required accuracies. Simultaneous and reciprocal trigonometric levelling is chosen to link the GNSS station with the tide gauge, while the spirit levelling is used to obtain the altitudes of all the TGBM. Considering the mean of the observed elevations the closing errors rarely exceed 1.5 mm (Valbuena et al., 1966).
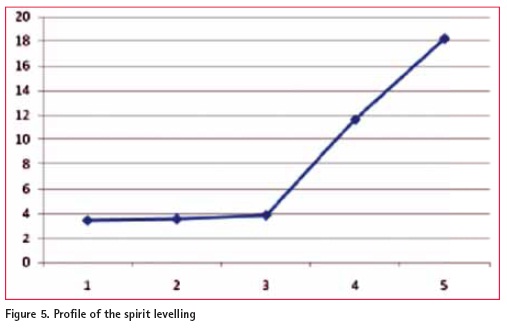
After every campaign, all the observed height differences are computed. To get the differences in trigonometric altitudes the direct independent calculation method is used. The points are clearly marked on the ground with standard marks or solid references are as follows (Figure 5): the tide gauge tube (1), TGBM 1, 2 and 3 (2), TGBM4 (3), IGN 201098 levelling mark (4) and GPS antenna (5).
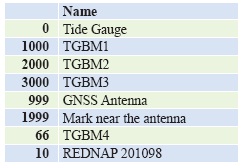
Table 1 shows the differences in altitude and the altitudes obtained from the observed reference points in the four years. The 0 (zero) is the tide gauge tube, the TGBM1 is 6 m away from the tide gauge in the pier, the TGBM2 is in the northwest corner of the pier at about 170 m from the TGBM1, and the TGBM3 is at about 170 m from the TGBM2 to the east and the TGBM4 in the external round to the enclosure of ACTi(Figure 2). The TGBM1 was taken as the reference of the tide gauge and the sea level is referred to this point. In the table, the following naming is used:
In the 2010 campaign, (Sevilla et al., 2011) it became evident that it was completely necessary to set a permanent mark on the terrace of AZTi. Such a new mark had to be linked, by the aforementioned trigonometric precise levelling to TGBM1, to take advantage of its precise spirit levelled height. The computation sequence follows this way:
• TG – TGBM1: spirit levelling,
• TGBM1 – Auxiliar Station: direct measurement (zenital straight angle),
• Auxiliar Station – Auxiliar Station (terrace): precise trigonometric levelling, Auxiliar Station (terrace) – Auxiliar terrace mark: direct measurement (zenital straight angle).
This way, if for some reason, the antenna is replaced it would only be necessary to repeat the link of the antenna with the mark. This new mark was installed at the northeast corner of the terrace in June and was assigned the number 1999. The observation of 2011 was made to this new mark so that the difference in altitude between the 1000 mark and the 999 antenna has two sections, the trigonometric link from 1000 to 1999 and the geometric link from 1999 to 999.

Analysis of the mean sea level
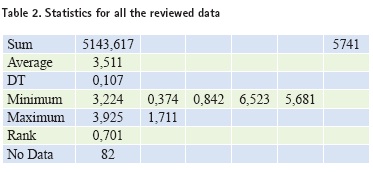
In the following lines, the measurements of 2007, 2008, 2009, 2010 and 2011 are outlined. The TG started to work from March 28, 2007 and produced valid data since May 1, 2007. The tide gauge stopped working on February 7, 2009 due to problems with the data storage system. We call this interval the 1st cycle. The sampling rate was one each minute, but five minutes-interval data was used to compute the solutions. Eventually, a new data storage system was set up (data logger) that became operational on July 10, 2009 and is still working as of April 2012. This is the 2nd cycle. Table 2 shows the statistics of filtered data from the two cycles.
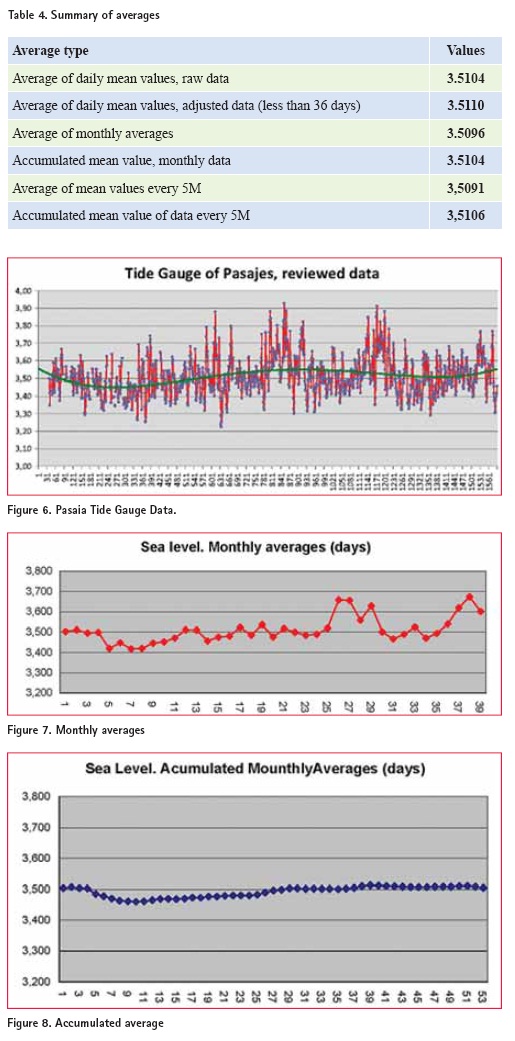
It can be seen that the total average is 3.511 and the standard deviation is 0.107. The daily averages range from a minimum value of 3.224 to a maximum value of 3.925, in a range of 0.701. The observed values ranged from a minimum value of 0.842 and a maximum of 6.523, i.e. between the low tide and the high tide recorded, in the observation period, the difference is 5.681 m. Standard deviations of the observed values range from a low of 0.374 and 1.711. Figure 6 shows a graph of data per day.
Table 3 shows the following results: Average = Monthly average of one value every 5 minutes (288*30 = 8640 elements) Average A = Total accumulated average of one value every 5 minutes (8640*N elements) Total average (average of the monthly averages) = 3.5091 Total average A (accumulated average of all data up to this month) = 3.5106
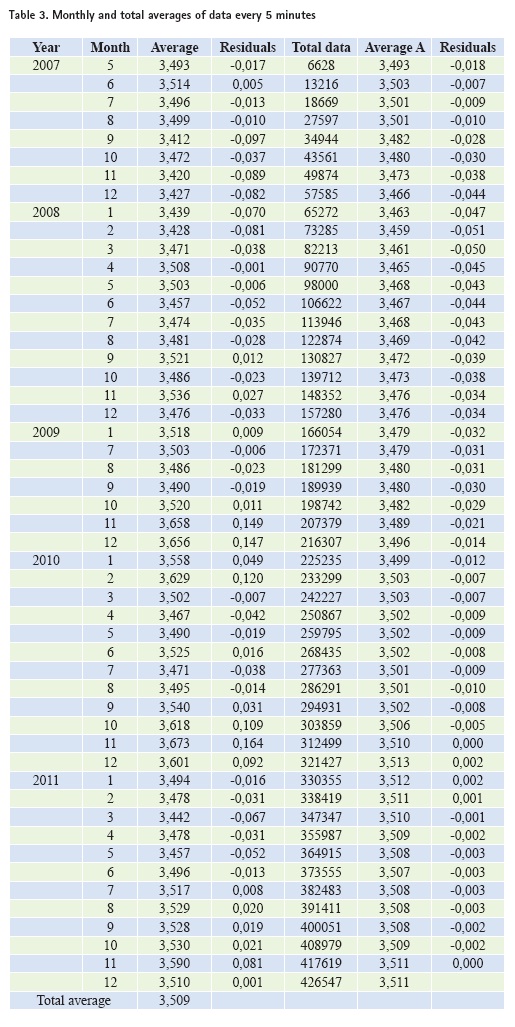
From Table 4, it can be seen that all means are equal to the order of one millimeter, so the mean sea level (without any corrections) from May 2007 to December 2011, with respect to the tide gauge zero, is of 3.510 m. The monthly averages show an anomaly produced in the months from November 2009 to February 2010. In these months, residuals of 149, 147, 49 and 120 mm with respect to the mean value of 3,509 m are obtained. There have been a review of the circumstances of the records, the operation of the tide gauge, the meteorological parameters of that time, variations of the astronomical tide, the water input, etc., but the cause of these anomalies have not been found. What we have seen in the consulted bibliography (Sveet et al., 2009) is that this event is not unique in our tide gauge (Pasaia), similar anomalies have occurred in other places on Earth and on other dates also without a plausible explanation.
This phenomena is repeated in the months of October, November and December 2010 and November 2011, with differences of 109, 164, 92 and 81 mm respectively, compared with the average of 3.509 m. This anomaly is clearly seen in Figure 7. Figure 8 shows the accumulated sea level.
Conclusions
The Pasaia Tide Gauge, together with the Permanent GNSS Station has been described in this paper, as well as the obtained results of more than four years of continuous GNSS and TG sea level data analysis. The links for precision levelling between the TGBMs network, the zero of the tide gauge and the GNSS antenna have been analyzed as well. The statistics of the results and corresponding graphs have also been included. These results show that the GNSS/TG station is fully operational and final results can be obtained when sufficient years of observational data are available.
References
Dach, R. Hugentobler, U.; Fridez, P.; Michael M. (2007): “BERNESE GPS SOFTWARE VERSION 5.0”. Astronomical Institute, University of Bern.
García-Cañada, L. and Sevilla, M. J. (2006): Monitoring crustal movements and sea level in Lanzarote. Geodetic Monitoring: from Geophysical to Geodetic Roles IAG / Springer Series, vol. 131. pp. 160-165. Springer Verlag. 2006.
Niell, A.E. (1996). “Global mapping functions for the atmosphere delay at radio wavelengths.” J. Geophy. Res.101(B2), 227-3246.
Sevilla, M. J., Martín, A and Zurutuza, J (2010): GPS Networks for deformation monitoring in Canarian Archipelago. 15th General Assembly of WEGENER BogaziciUniversity. Istanbul, Turkey
Sevilla M. J. and Romero, P. (1991): Ground deformation control by statistical analysis of a geodetic network in the caldera of Teide. Journal of Volcanology and Geothermal Research, Vol. 47 pp. 65-74. Elsevier Sc. Pub. Amsterdam.
Sevilla, M. J., J. Zurutuza and A. Martín (2011): Three Years of Tide Gauge Measurements in the Pasajes Harbour. FIG Working Week Bridging the Gap between Cultures Marrakech pp 1-12.
Sweet, W., Zervas, C. and Gill, S. (2009): Elevated East Coast Sea Levels Anomaly, NOAA Technical Report NOS CO-OPS 051
Valbuena J. L., Vara, M. D., Soriano, M. D. Díaz, G. R. y Sevilla, M. J. (1996): Instrumentación y metodología empleadas en las técnicas altimétricas clásicas. Topografía y Cartografía, Vol. XIIiNº 74 y 75, pp. 2-19, Madrid 1997.
Zurutuza, J. and Sevilla, M. J. (2006). Deformations monitoring by integrating local and global reference systems. Geodetic Monitoring: from Geophysical to Geodetic Roles IAG / Springer Series, vol. 131. pp. 48-55 Springer Verlag.
Zurutuza, J. and Sevilla, M. J. (2007): Infl uence of the Cut-off Angle and the Bearing in High-Precision GPS Vector Determination. Journal of Surveying Engineering. Vol 133, nº 2, pp. 90-94.
Zurutuza, J., M. J. Sevilla and M. Elorza (2007):. AutoGNSS: A new GPS Vector Processing Software. IUGG 2007 General Assembly. Perugia 2-12 julio 2007
Zurutuza, J. and M. J. Sevilla (2009):. Dependence of the GPS high-precision solutions on the considered tropospheric model. Spain-China Symposium on Geophysical & Geochemical Geosystems. Zaragoza junio 2009.
|
|
|
|
My Coordinates
|
|
|
Mark your calendar
|
|
|
His Coordinates
|
|
|
Conference
|
|
|
News
|
|
|


 (7 votes, average: 2.43 out of 5)