| Applications | |
Urban sprawl prediction using cellular automata
A case study of Ahmedabad city |
 |
|
 |
|
Human population continues to accumulate in urban centers. This inevitably increases the urban footprint with significant consequences for biodiversity, climate, and environmental resources. Urban growth prediction models have been extensively studied with the overarching goal to assist in sustainable management of urban centers. There are various existing models, which have their own advantages and limitation. Here by using cellular automata, the prevailing modeling technique to obtain sustainable result.
The study is based on the data availability from LISS III. This model assesses developer and user perceptions and critically discusses existing urban growth prediction models, acting as a reference for future model development.
The potential of the use of satellite images for Ahmedabad, Gujarat, the assessment of urban growth on which future work should focus as the key factors of economicenvironmental sustainability based on parameters taken into considerations that directly influence the land use.
Introduction
Urban sprawl: Definition
Urban sprawl or suburban sprawl describes the extension of human being populations away from inner builtup patches into previously out-of-theway and rural regions, basically which results in low-density communities. Urban sprawl is a versatile concept of community planning particularly relevant to developed nations concerning topics that series from the external spreading of a city and it’s suburban, to low-density and development on rural territory, assessment of impact of high separation between residential and commercial uses. Urban sprawling has happen to incredibly chief issue of learning to deal with city expansion and financial system
Cellular Automata
Cellular automata (henceforth: CA) are discrete, abstract computational systems that have proved useful both as general models of complexity and as more specific representations of non-linear dynamics in a variety of scientific fields. Firstly, CA is (typically) spatially and temporally discrete: they are composed of a finite or denumerable set of homogeneous, simple units, the atoms or cells. At each time unit, the cells instantiate one of a finite set of states. They evolve in parallel at discrete time steps, following state update functions or dynamical transition rules: the update of a cell state obtains by taking into account the states of cells in its local neighbourhood (there are, therefore, no actions at a distance). Secondly, CA is abstract, as they can be specified in purely mathematical terms and implemented in physical structures. Thirdly, CA are computational systems: they can compute functions and solve algorithmic problems. Despite functioning in a different way from traditional, Turing machine-like devices, CA with suitable rules can emulate a universal Turing machine, and therefore compute, given Turing’s Thesis, anything computable.
The mark of CA consists in their displaying complex emergent behaviour, starting from simple atoms deterministically following simple local rules. Because of this, CA attracts a growing number of researchers willing to study pattern formation and complexity in a pure, abstract setting. This entry provides an introduction to CA focusing on some of their philosophical applications: this range from the philosophy of computation and information processing, to philosophical accounts of reduction and emergence in metaphysics, and debates in fundamental physics.
About the study area: Ahmedabad city
Human population continues to cumulate in urban centers. This inevitably increases the urban footprint with significant consequences for biodiversity, climate, and environmental resources. Urban growth prediction models have been extensively studied with the overarching goal to assist in sustainable management of urban centers. There are various existing models, which have their own advantages and limitation. Here I will be using cellular automata the prevailing modeling technique. The study is based on the data availability from LISS III and LandSat. This model assesses developer and user perceptions and critically discusses existing urban growth prediction models, acting as a reference for future model development.
City of Ahmedabad
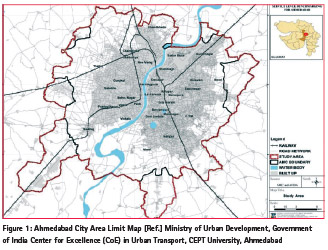
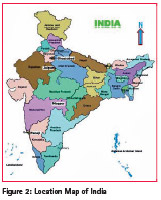
The city of Ahmedabad is ranking on top among the largest metropolis in India. It is the first largest city in the State of Gujarat. According to Census of India 2011, the population of urban agglomeration reached to 7.2 million. The city is situated on 23°00’N Latitude and 72° 00’E Longitude. The city remained as a capital for the State till the year 1970. Currently it is a district headquarters. River Sabarmati is passing through the city divides into two parts, East and West. The western part of the city is comparatively newly developed. Therefore it is planned and sparsely built in comparison to the eastern part.
Infrastructure Services
The city of Ahmedabad provides mandatory services to the citizen. Those are water supply, sewerage, solid waste etc. are the physical infrastructure the city government provides and maintains
Objectives of the study
• Map the extent of urban growth for the largest city and former capital of the Indian state of Gujarat, Ahmedabad.
• Develop and calibrate an urban growth simulation model based on historical urban growth to predict future urban growth.
• The potential of the use of satellite images for the assessment of urban growth on which future work should focus as the key factors of economicenvironmental sustainability based on parameters taken into considerations that directly influence the land use.
Data & software used for study
Satellite Data Used
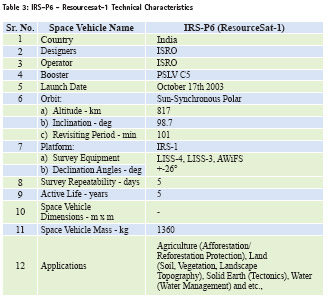
IRS P6/Resourcesat-1
The IRS (Indian Remote sensing) satellites form a large family of Earth observations satellites operated by the Indian space agency.
IRS P6/Resourcesat-1 & Resourcesat-2 provides data of medium and high resolution by the twin satellites IRS- 2C and IRS-1D.These two, launched in 1995 and 1997 respectively. Resourcesat satellites carries a LISS-III sensor as well a wide field AWiFS sensor ,but the high resolution(5.8 m) LISSIV sensor replaces the panchromatic sensor. The high resolution data are useful for applications such as urban planning and mapping, while the average resolution is used for vegetation discrimination, land mapping, and natural resources management.
LISS-III
The LISS-III (Linear Imaging Self Scanning Sensor) sensor is an optical sensor working in 4 spectral bands (Green, red, near infrared and short wave infrared). The Linear Imaging Self Scanning Sensor (LISS-III) is a multi-spectral camera operating in four spectral bands, three in the visible and near infrared and one in the SWIR region, as in the case of IRS-1C/1D. The new feature in LISS-III camera is the SWIR band (1.55 to 1.7 microns), which provides data with a spatial resolution of 23.5 m unlike in IRS-1C/1D (where the spatial resolution is 70.5 m).
The Data products are categorized as Standard and have a system level accuracy.
LISS-III Standard Products comprise Path/Row Based products, Shift Along Track product, Quadrant products and Georeferenced products. Path/Row Based products are generated based on the referencing scheme of each sensor. Shift Along Track applies to those products covering a user’s area of interest which falls in between two successive scenes of the same path, then the data can be supplied by sliding the scene in the along track direction. LISS-III full scene is divided into four nominal and eight derived quadrants. LISS-III photographic quadrant products are generated on 1:125,000 scale. Georeferenced products are true north oriented products. These products are supplied on digital media only.
Standard Path/Row Based products cover an area of 141 x 141 km and are characterised by 3 Bands. Path/Row Based products comprise Raw, Radiometrically corrected and Geo referenced levels of corrections. Quadrant products cover an area of 70 x 70 km and are characterised by 3 or 4 Bands (Geo Referenced). Quadrant products comprise Standard and Geo referenced levels of corrections. Software Used i. ArcMap 10.1 ii. Erdas Imagine 2011 iii. IDRISI Selva 17.02 iv. Microsoft Excel 2007

Methodology for study
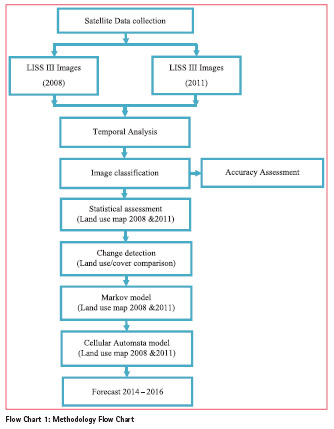
In this module, the main components of the urban growth model applied on Ahmedabad, an overview of the workflow as shown in flow chart. Which is comprised of various stages: a) Classification of satellite images and b) computation of transition probability maps? These maps, in combination with the land use maps, were required for Markov Change detection and cellular automata simulation model to predict future urban growth (for 2014).
Extraction of Land Use Map
Spatiotemporal mapping includes quantitative time series analysis and transformation of land cover classes. Because land use maps are a fundamental prerequisite for modeling future growth, individual land use classes were extracted from the remotely sensed images for each timestamp. After geometric corrections, the land use maps were initially classified based on the maximum likelihood algorithm and further accuracy assessment is observed onto classified images.
Urban Growth Model
Urban Growth Prediction Models (UGPMs) are tasked to capture intrinsic and complex relationships in space and time. The spatial complexity reflects the impact of numerous biophysical and socioeconomic factors and as a result heterogeneous patterns appear across location and scale thus making urban development a dynamic and non-linear process.
The IDRISI Selva version 17.02 has been used for the analysis of images. Markov chain model has been applied to find the future change of LU/LC in the study. The land use information of the year 2014 is predicted according to the land use classification using supervised approach with maximum likelihood.
Markov Chain
Markov chain models have been used to model landscape changes in understanding and predicting the behaviour of complex systems using discrete state spaces. All landscape spatial transition models can be expressed in a simple matrix equation as follows:
Nt+ 1=Nt * P
where Nt + 1 and Nt are vectors composed of the fractions of each landscape type at time t + 1 and time t, respectively; P is a square matrix, whose cell Pij is the transition probability from landscape i to j during times t and t + 1.The transition probabilities P are derived from the landscape transitions occurring during some time interval.
Theoretically, the Markov chain model assumes that the transition probability is spatially independent (Brown et al. 2000). However, the future trend of a pixel to change is not a simple function of its current state, but is often affected by it neighbouring cells. The resulting probabilities were summarized in a transition probability matrix, not directly transferable to spatial representations. Therefore, additional steps are needed to incorporate both spatial and temporal information using CA.
Cellular Automata
Cellular automata (CA) were introduced by Ulan and Neumann in 1940 and since 1980 numerous models have been developed for simulating urban growth CA is defined as discrete dynamics systems, represented by a grid of cells, in which local interconnected relationships exhibit global changes.
Generally, the state of each cell depends on the value of the cell on its previous state as well as the values of its neighbours according to some transition rules and there are two possible values for each cell (0 or 1). As a rule-based model, its topological grid characteristics make CA an appropriate model for incorporating spatial interactions between a cell and its neighbourhood. For example, assuming a 3*3 cell neighbourhood, a cell’s state is influenced by its eight adjacent cells. These models are typically calibrated using training data (i.e., past land use maps), which are then compared with an actual land use map, although the quantity of change is neglected. If statistical evaluation, using the kappa index for example, provides valid results, the calibrated model can be applied to the prediction of future urban spatial patterns.
Analysis and results of study
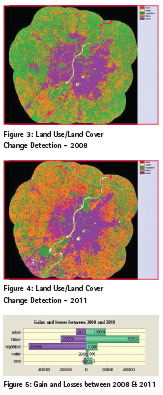
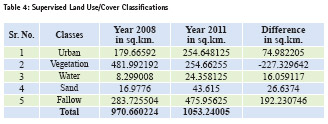
Supervised Land Use/ Cover Classifications
The 2 successive supervised land use/ cover classifications images for the year 2008 & 2011 discriminated in 5 classes using maximum likelihood are:
Change Detection using LCM in IDRISI:
Land Change Modeler (LCM) was used to analyze the land use/cover changes between various classes during the period of 2008 to 2011 in order to predict future urban.
Here it is observed that there is change in ratio of vegetation, urban and other classes as well, which can be seen graphically using change analysis in IDRISI.
Cellular Automata Markov Modelling
Based on land use conditions during the periods 2008 to 2011, transition potentials were computed using a Markovian process. The transition probability matrices of each land use type for both periods are produce. The diagonal elements represent probability values for self-replacement, referring to land use types that remain similar (Guan et al., 2011). In contrast, off-diagonal values indicate the probability of change from one land use category to another.
CA first input the transition probabilities for these years. The CA allocated the cells by means of a 5*5 or 3*3 matrix as per user requirements and iteration per year. Careful model validation was conducted to assure accuracy and to ensure an applicable simulation that predicts effectively.

Acknowledgements
We would like to acknowledge Dr. Anjana Vyas, Professor and Program Coordinator of Geomatics, CEPT University, Ahmedabad, and Mrs Shaily Gandhi, CEPT University, Ahmedabad for their assistance for providing relevant information and guidance for this study.
References
Hossein Shafizadeh Moghadam , Marco Helbich, (2013) .Spatiotemporal urbanization processes in the megacity of Mumbai, India: A Markov chainscellular automata urban growth model. Applied Geography 40 140e149
Chanvoleak Ourng; Daniel S.R; Ligia T. Silva; Rui A.R. Ramos (2011), A proposed methodology for understanding urban growth pattern: a case study in Siem Reap, Cambodia. 16th WSEAS International Conference, Montreux, Switzerland. Kumar, A., Pandey, A. C., Hoda, N., & Jeyaseelan, A. T. (2011). Evaluation of urban sprawl pattern in the tribaldominated cities of Jharkhand state, India. International Journal of Remote Sensing, 32, 7651e7675.
Al-Ahmadi, K., See, L., Heppenstallm A,m & Hoggm J. (2009), Calibration of a fuzzy cellular automata model of urban dynamics in Saudi Arabia. Ecological Complexity, 6 (2), 80-101.
Heng Sun &Wayne Forsythe & Nigel Waters, (2007), Modelling Urban Land Use Change and Urban Sprawl: Calgary, Alberta, Canada, Netw Spat Econ 7:353– 376 DOI 10.1007/s11067-007-9030-y
Czamanski, D., Benenson, I., Malkinson, D., Marinov, M., Roth, R., & Wittenberg, L. (2008). Urban sprawl and ecosystems e can nature survive? International Review of Environmental and Resource Economics, 2,321e366.
Sharaf Alkheder, Jun Wang and Jie Shan, (May 2006), Change detection – cellular automata Method for urban growth modelling,. ISPRS Commission VII Mid-term Symposium “Remote Sensing: From Pixels to Processes”, Enschede, the Netherlands, 8-11
M. Herold, H. Couclelis and K. C. Clarke, (2005), “The Role of Spatial Metrics in the Analysis and Modelling of Urban Land Use Change,” Computer, Environment and Urban Systems, Vol. 29, No. 4, pp. 369-399.
Clarke, K. C., and Dietzel C., (2004), A decade of SLEUT Hing: Lessons learned from applications of from applications of a cellular automaton land use change model. In: The Joint International Workshop on Integrated Assessment of the Land System: The Future of Land Use. Institute for Environmental Studies, Amsterdam.
H.S. Sudhira a, T.V. Ramachandra a, K.S.Jagadish, (2004) b. Urban sprawl: metrics, dynamics and modelling using GIS. International Journal of Applied Earth Observation and Geoinformation 5 29–39
Wu, F. (2002) Calibration of stochastic cellular automata: the application to rural-urban land conversions. International Journal of Geographical Information Science, 16 (8), 795-818.
Torrens, P.M., O’ Sullivan, D., (2001). Cellular automata and urban simulation: where do we go from here? Environ. Plann. B 28,163–168
Batty M., Xie Y., Sun Z. (1999), The dynamics of urban sprawl. Working Paper Series, Paper 15, Centre for Advanced Spatial Analysis, University College, London.
Eric De Noronha vaz, Mario Caetano & Peter NijKamp. Trapped between antiquity and urbanism- a multicriteria assessment model of the greater Cario Metropolitian area. Journal of land use science vol.6, no.4
Antonia Mavroudi., Simulating city growth by using the Cellular Automata Algorithm. Bartlett School of Graduate Studies University College London.
Ministry of Urban Development, Government of India, Center for Excellence (CoE) in Urban Transport, CEPT University, Ahmedabad.
The paper was presented at Asian Conference on Remote Sensing (ACRS), Colombo, Sri Lanka 17-21 October 2016


 (3 votes, average: 3.67 out of 5)


Leave your response!