| GIS | |
Satellite based mapping of air pollution using Google Earth Engine for Himachal Pradesh, India
It has emerged that satellite retrieved mean pollutant concentration recorded relatively lower concentration during the year 2020 in comparision to 2019 and 2021 indicating the impact of lockdown due to Covid 19 pandemic |
 |
|
Abstract
The paper aims to investigate the spatiotemporal pattern of three types of air pollutants by using Sentinel 5p satellite data namely absorbing aerosol index (AAI) broadly indicated as particulate matter, nitrogen oxides (NOx) and carbon monoxides (CO) for roughly three consecutive years from January 2019 to October 2021 (34 months) for northwestern Himalayan State of India namely Himachal Pradesh. These data are further compared with the ground monitored data of State Pollution Control Board for the same period. In addition, total yearly mean emission of NOx is calculated and retrieved by converting mol/m2 to ton/m2 using Sentinel-5p offline NO2 stored in Google Earth Engine (GEE) JavaScript API for 2019, 2020 and 2021. From the analysis, it has emerged that satellite retrieved mean pollutant concentration recorded relatively lower concentration during the year 2020 in comparision to 2019 and 2021 indicating the impact of lockdown due to Covid 19 pandemic.
1. Background
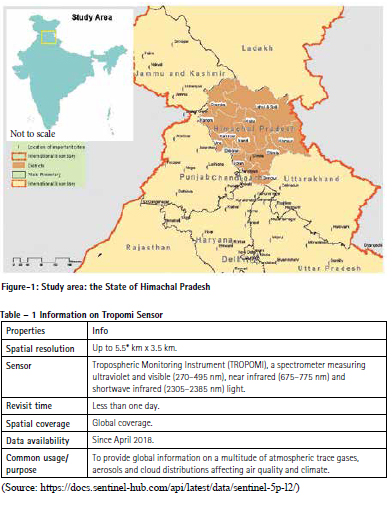
Himachal Pradesh is one of the northwestern Himalayan States of India. The state also shares an international border with the Tibet of China towards east. It is popularly known as ‘Dev Bhoomi’ or ‘Land of God’. Two very famous river basins namely Indus and Ganges drain the territory of Himachal Pradesh. The State constitutes about 1.7 percent of geographical area of the country and elevation ranges from 465m to over 7,000m above sea level. As per the record of the Govt. of Himachal Pradesh, the State is home to 5721 faunal species and 3295 plant species. Forests constituted about 27.72% of the state’s geographical area in 2019, which was higher than the national average. Being home to such a diverse and rich ecosystem and located in the lap of Himalayas, protection of the rich biodiversity of the State and providing pollution free environment is our shared responsibilities and is of paramount importance.
1.1 Air pollution parameters
Air pollution is a global environmental health concern that is responsible for approximately 7 million death each year. Keeping in view of its gravity, Central/State Pollution Control Boards/ Committees of India are mandated with monitoring key pollutants on daily basis. During the year 2009, Govt. of India had notified the revised National Ambient Air Quality Standards for 12 parameters – PM10, PM2.5, NO2, SO2, CO, O3, NH3, Pb, Ni, As, Benzo(a)pyrene, and Benzene (CPCB 2009). Himachal Pradesh State Pollution Control Board being the nodal agency for pollution control & environment protection undertakes ground level monitoring of following air pollutants viz., Sulphur Dioxide (SO2), Oxides of Nitrogen as NO2, Respirable Suspended Particulate Matter (RSPM / PM10) and Fine Particulate Matter (PM2.5) in addition to other parameters on day to day basis at 25 locations covering 11 cities/towns across the State. Out of 11 cities/towns monitored, seven (07) towns had been classified/identified by the Central Pollution Control Board (CPCB) as Non-Attainment1 Towns in Himachal Pradesh with respect to PM10 which were exceeding National Ambient Air Quality Standards (NAAQS) during FY – 2010 – 2015. These towns were Baddi, Nalagarh, Parwanoo, Kala Amb, Paonta Sahib, Sundernagar & Damtal. Of above, Damtal is not a town as per the census but a large village adjoins Pathankot of Punjab in the west.
It is worthwhile to note that point-source based stationery monitoring has both advantages and limitations. Keeping in view the limitation in terms of spatial coverage in point-source monitoring, organizations are also taking the assistance of satellite based non-point source monitoring such as satellite. Of late, there are few satellites which have started monitoring of atmospheric constituents on daily basis. In this series, the Copernicus Sentinel-5P satellite was launched in October 2017 to map a multitude of air pollutants around the globe. The Tropomi instrument on-board Sentinel 5p as a spatial resolution of 3.5 x 7.0 km, compared to coarser resolution of 24 × 13 km achieved through the Ozone Monitoring Instrument on NASA’s Aura mission.
2. The study area and methodology
2.1 Study area
Himachal Pradesh – the north-western Himalayan State of India has been selected as the study area. Multi timeseries sentinel 5p Satellite (S5P) data (from January 2019 to October 2021) were processed using Google Earth Engine (GEE) JavaScript API. In addition, other requisite vector data were obtained from other secondary sources and uploaded into the Asset section of GEE for spatiotemporal analysis.
2.2 Geospatial analysis by Google Earth Engine
Google Earth Engine (GEE) is a rapidly growing geospatial processing service and offers platform for scientific analysis and visualization of geospatial datasets for users ranging from academic, nonprofit, business to government. Earth Engine hosts huge amount of satellite imageries and stores it in a public data archive that includes historical earth images going back more than forty years. The images, ingested on a daily basis, are then made available for global-scale data mining. Earth Engine also provides APIs and other tools to enable the analysis of large datasets.
3. The satellite & sensor – Sentinel-5 Precursor and TROPOMI
The Sentinel-5P (S5p) – is the first Copernicus mission dedicated to monitoring our atmosphere. The satellite carries the Tropomi instrument to map a multitude of trace gases such as nitrogen dioxide, ozone, formaldehyde, sulphur dioxide, methane, carbon monoxide and aerosols. Some basic facts about the satellite sensor are indicated in Table-1.
The mission objectives of S5P are to globally monitor air quality, climate and the ozone layer in the time period during 2017 to 2023. The first 6 months of the mission were used for special observations to commission the satellite and the ground processing systems. The operational phase started in April of 2018. Sentinel 5P monitors not only troposphere, which is the lowest layer of Earth’s atmosphere but also stratosphere – the second layer of the atmosphere as you go upward. The troposphere is very important because we breathe the air in this layer of air. Hence the study focusses on tropospheric pollutants. The units of the products/bands being analysed in the paper are indicated in Table 2.
4. Spatial Correspondence between Population Density & Topography and Pollution Concentration
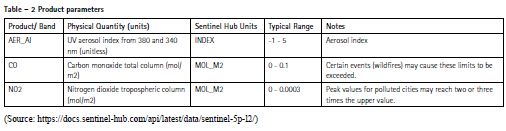
Spatiotemporal pattern of pollution concentration is spatially correlated with anthropogenic activities in the State and consequently flat-lands and valleys where economic activities are more pronounced record relatively higher concentration of pollutants. Anthropogenic activities can, in best way, be reflected through the GEE datasets of population density and nightlight observance demonstrated through the population density/pattern using Worldpop.org, topographic variations using Surface Radar Terrain Model (SRTM) dataset and nightlight observed through a NOAA/DMSP-OLS satellite, which inter-alia correlate with pollution concentration pattern of particulate matter, nitrogen oxides and other trace gases. The intention of putting all following maps are to draw a parallel with anthropogenic/ economic activities and spatial pattern of pollutants, which are highly correlated as indicated in subsequent analysis.
5. Pollution parameters analysed
5.1 Absorbing Aerosol Index (AAI) / Particulate Matters:
The AAI of Sentinel 5p is based on wavelength-dependent changes in Rayleigh scattering in the UV spectral range for a pair of wavelengths. The difference between observed and modelled reflectance results in the AAI. When the AAI is positive, it indicates the presence of UV-absorbing aerosols like dust and smoke. It is useful for tracking the evolution of episodic aerosol plumes from dust outbreaks, volcanic ash, and biomass burning. The wavelengths used have very low ozone absorption, so unlike aerosol optical thickness measurements, AAI can be calculated in the presence of clouds. Daily global coverage is therefore possible. For this L3 AER_AI product, the Absorbing Aerosol Index is calculated with a pair of measurements at the 354 nm and 388 nm wavelengths (https://developers. google.com/earth-engine/datasets/catalog/ COPERNICUS_S5P_NRTI_L3_AER_AI). The Aerosol Index (AI) is a qualitative index indicating the presence of elevated layers of aerosols with significant absorption. An advantage of the AI is that it can be derived for clear as well as (partly) cloudy ground pixels (https://sentinels. copernicus.eu/web/sentinel/technicalguides/ sentinel-5p/level-2/aerosol-index).
Aerosols are generated by human activities such as vehicular and industrial emissions, dust particles generated in mining, transport, and urban smog. However, it is worthwhile to note that satellite datasets do not yield accurate ground-level pollutant concentrations, which have a significant impact on human health (https://www.ncbi. nlm.nih.gov/pmc/articles/PMC8372483/).
5.1.2 Spatiotemporal pattern
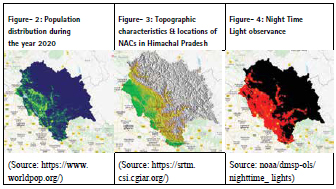
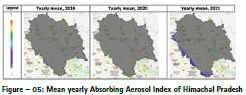
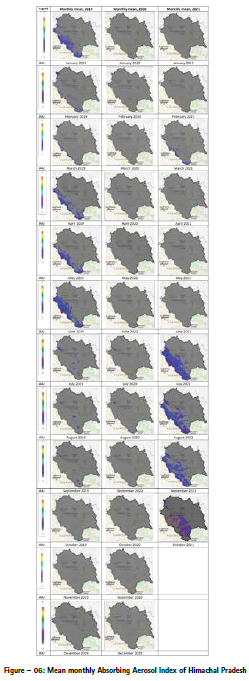
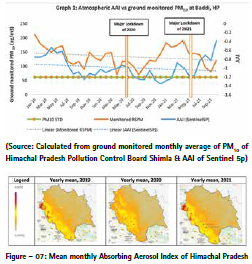
Theoretically, the State records negative value of AAI indicating absence of any aerosol related concentration. Nevertheless, it records some spatial pattern in thin layer of concentration of aerosol in troposphere. Following maps of AAI indicate that a very thin blue patch of aerosol is observed in 2019 followed by complete absence during 2020. However annual mean of AAI of 2021 displays the presence of aerosol towards west in flatlands of the State. However, besides anthropogenic activities playing important roles in the spatial pattern of AAI, natural sources and its trans-boundary movement also seem to play equally important roles in western parts of the State.
Monthly mean concentration of aerosol is depicted in the following month-wise maps prepared through GEE indicating higher concentration of aerosol in early-half of 2019 and later-half of 2021. The lower concentration pattern during 2020 can be attributed to the Covid-19 pandemic lockdown during a longer period of time during 2020 and further increase due to lifting of curbs during laterhalf of 2021. AAI images seem to have error related to surface snow and ice cover over Himalayas, which are masked in the mapping of AAI for better results as indicated by Figures-5-6.
5.1.3 Comparison between satellite vs ground monitored data of PM10
The mean monthly ground monitored data of one of the non- attainment towns namely Baddi – the industrial hub of Himachal Pradesh is compared with the tropospheric air pollutants obtained from the satellite data for the period during 2019 to 2021. The primary axis of the Graph-1 exhibits ground monitored data while secondary axis demonstrates values of AAI values extracted from AER data of Sentinel 5p. Both trend lines of ground and atmospheric observations show declining trends and complement each other. The negative value of AAI ideally indicate the absence of aerosol, however there are some thin patches of concentration observed towards the western parts.
5.2 Nitrogen Oxides (NOx)
5.2.1 Health impact
The major source of NO2 is combustion processes. Burning fossil fuels, heat, and transportation contribute to NO2 based air pollution. As per the CPCB report, NO2 is showing alarmingly high increasing trend in Indian cities due to increase in number of vehicles (https://app.cpcbccr.com/ccr_docs/ FINAL-REPORT_AQI_.pdf). On inhalation, 70–90% of NO2 can be absorbed in the respiratory tract of humans, and physical exercise increases the total percentage absorbed (Miller et al., 1982). NO2 exposure can cause decrement in lung function (i.e. increased airway resistance), increased airway responsiveness to broncho-constrictions in healthy subjects at concentration exceeding 1 ppm (WHO 2000).
5.2.2 Atmospheric concentration (tropospheric_ NO2_column_number_density)
Nitrogen oxides (NO2 and NO) are important trace gases in the Earth’s atmosphere, present in both the troposphere and the stratosphere. They enter the atmosphere as a result of anthropogenic activities (notably fossil fuel combustion and biomass burning) and natural processes (wildfires, lightning, and microbiological processes in soils). Here, NO2 is used to represent concentrations of collective nitrogen oxides because during daytime, i.e. in the presence of sunlight, a photochemical cycle involving ozone (O3) converts NO into NO2 and vice versa on a timescale of minutes. (https://developers.google.com/earthengine/ datasets/catalog/COPERNICUS_S5P_OFFL_L3_NO2).
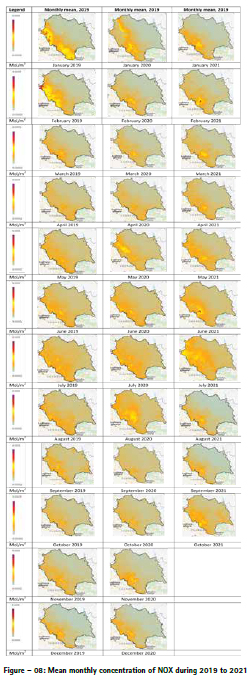
5.2.3 Spatiotemporal pattern Scientists say that the nitrogen dioxide (NO2) has a short lifetime, which means it is detected near its source. NOx pollution is emitted by automobiles, trucks and various non-road vehicles (e.g., construction equipment, boats, etc.) as well as industrial sources such as power plants, industrial boilers, cement kilns, and turbines (Source: https://www3.epa.gov/region1/airquality/ nox.html). Spatial pattern of NO2 in the State is in agreement with the distribution of population density and physiographic pattern. However, there are three major cement plants in the State, where due to kilns, they generate heat, thus demonstrating thon patches of NOx concentration over and around these three plants however these concentration are insignificant compared to the normal concentrations of neighbouring states.
Reductions in tropospheric NO2 concentrations were observed during lockdown due to Covid-19 pandemic compared to pre-lockdown concentrations. Consequently a gradual decline in state-level tropospheric NO2 is evident in most districts from 2019 to 2020. Following satellite-derived average NO2 concentration maps indicate the presence of red and yellow patches in the western parts of Kangra, Una and consistent concentration over and around cement plants of M/s Ambuja Cement, M/s Jaypee Cement Baga and M/s ACC Barmana. Areas over cement plants record relatively high concentration of NO2 owing to heat generation from their kilns. However as per the monitoring conducted by the State Board, concentration of oxides of nitrogen are insignificant and below the permissible limit in comparison to other western neighbouring States (Refer Figures 6&7).
5.2.4 Comparison between satellite data vs ground monitored data of NOx
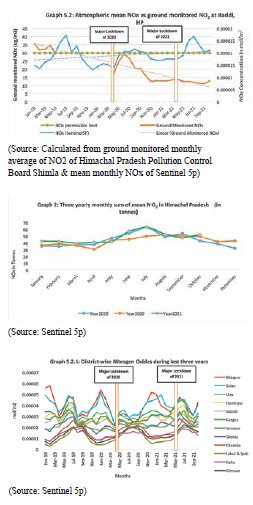
There are some gaps in ground monitoring data of NOx, however demonstrating declining trend at Baddi, while atmospheric data show a partial increase in trend-line. However this is worthwhile to note that lockdown periods recorded lower concentration of NOx during early 2020 and mid-2021.
5.2.5 Total yearly emission of NO2 in tonnes Total yearly emission of NO2 for Himachal Pradesh was calculated using Sentinel- 5p Offline NO2 stored in Google Earth Engine. First of all, yearly sum of mean NO2 (tropospheric_NO2_column_ number_density) was calculated by converting mol/m2 to ton/m2 and by employing GEE reduceRegion function for Himachal Pradesh during three years namely 2019, 2020, 2021. Summary of three yearly data were tabulated in Graph – 2. As indicated below, the year 2000 recorded the lowest of three years except few outliers in the months of May and September 2020. This may be attributed to the frequent lockdowns imposed during the year due to Covid 19 pandemic.
5.2.6 Inter-district variation in NOx observance
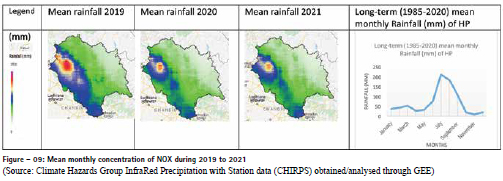
Inter-district mean concentration of nitrogen oxides for 34 months retrieved through Sentinel 5P is analysed below. Districts of Solan and Bilaspur top the list of concentration. Three cement plants namely M/s Ambuja Cement, M/s Jaypee Cement Baga and M/s ACC Barmana are located in eastern parts of these two districts. Districts recording patches of concentrations are industrialized and relatively more populated, which are known major NO2 emission contributors. Nevertheless these patterns depict the tropospheric concentration not the ground level concentration.
The graph as included in Figure-09 also indicates the monsoon phenomena during July to September where districts in plains show declined concentration (troughs) of NOx, while some of mountainous districts such as Kinnaur, Kullu, Chamba and Lahul & Spiti have shown peaks during rainy seasons indicating nomonsoon related rainfall in high hills compared to plains, which reduces pollution concentration. The spatial pattern and temporal trend of rainfall in Himachal Pradesh is also analysed through GEE as indicated in Figure-09.
5.3 Carbon Monoxide
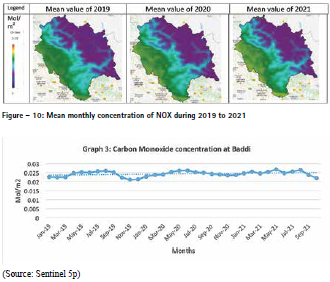
Carbon monoxide (CO) is an important atmospheric trace gas for our understanding of tropospheric chemistry. In certain urban areas, it is a major atmospheric pollutant. Main sources of CO are combustion of fossil fuels, biomass burning, and atmospheric oxidation of methane and other hydrocarbons (http:// www.tropomi.eu/data-products/carbonmonoxide). As indicated below, total atmospheric column density of CO is highly correlated to the anthropogenic activities. The concentration of CO can be related to high vehicular activities in plains and valleys. Though the concentrations are less but displays the similar spatiotemporal trend and pattern in all three years. Partial increase may, however, be observed in 2021 indicating CO concentration is highly correlated with increase in day to day economic activities of the State (Refer Figure-10).
5.3.1 Mean monthly concentration of CO
Mean monthly concentration of Carbon Monoxide (CO) at Baddi is more or less stagnant and display a partial increase as per the CO_column_number_ density of Sentinel 5p. However, impact of Covid-19 lockdown is not quite visible through the Graph-3.
6.0 Concluding remarks
The spatial distribution, direction, and magnitude of PM changes near the surface are substantially different from those of the tropospheric aerosols assessed via satellite data, indicating the significance of monitoring groundlevel changes in air pollution compared to satellite-retrieved spatial patterns and trends. Hence, data monitored by the Pollution Control Boards are more relevant and concerned to human health.
Further permissible limit of tropospheric column concentrations for aerosol, NOx, CO are not available as yet as in the case of ground level monitoring of pollutants enforced by the Pollution Control Boards/Committees. Therefore, only high and low levels of concentration are explained spatially for understanding purposes. The fact remains that the ground monitoring being conducted by relevant agencies observe a very low level of NO2 concentration across the State and they are below detectable limit at several locations as well. Nevertheless, the spatial pattern are clearly visible across the districts, which can either be linked to economic activities or trans-boundary movement of pollutants particularly along bordering areas towards west. Further Covid-19 lockdowns also caused two dips in pollution concentration as evident in the months of April 2020 and May 2021. Urban settlements of mountainous state are of small sizes, hence in order to monitor pollution pattern at micro level, researchers require more high spatial resolution satellite sensors, which are currently not available. Nonetheless Sentinel 5p has opened a new vistas of monitoring atmospheric constituents on daily basis.
Abbreviations:
AAI – absorbing aerosol index, NOx – Nitrogen oxides, NO2 – Nitrogen dioxide, CO – Carbon monoxide, PM10 – particulate matter 10 microns or less in diameter, PM2.5 – particulate matter 2.5 microns or less in diameter, NAAQS – National Ambient Air Quality Standards, FY – Financial Year, GEE – Google Earth Engine, AER – Aerosol, NAC – Nonattainment Cities, SRTM – Surface Radar Terrain Model, NAMP – National Air Monitoring Programme, NOAA/DMSPOLS – Operational Linescan System (OLS) flown on the Defense Meteorological Satellite Program (DMSP) satellite.
Disclaimer
The analysis and conclusion drawn in the study is independent of institutional affiliation of the author.
Endnotes
1 Non-attainment Cities (NAC) are those, which do not meet the National Ambient Air Quality Standards (NAAQS) consistently for PM10 (Particulate matter that is 10 microns or less in diameter) or NO2 (Nitrogen Dioxide) or SO2 (Sulphur Dioxide) over a 5-year period. In Himachal Pradesh, there are seven such non-attainment cities (NACs) namely Baddi, Parwanoo, Kala-Amb, Paonta Sahib, Nalagarh, Sundernagar and Damtal, which violated NAAQS.
References
1. Arnoud Apituley, Mattia Pedergnana, Maarten Sneep, J. Pepijn Veefkind, Diego Loyola, Deborah Stein Zweers, 2018: Sentinel-5 precursor/ TROPOMI Level 2 Product User Manual UV Aerosol Index.
2. Central Pollution Control Board, National Air Quality Index, 2015.
3. Henk Eskes, Jos van Geffen, Folkert Boersma, Kai-Uwe Eichmann, Arnoud Apituley, Mattia Pedergnana, Maarten Sneep, J. Pepijn Veefkind, Diego Loyola, 2018: Sentinel-5 precursor/TROPOMI Level 2 Product User Manual Nitrogendioxide
4. https://app.cpcbccr.com/AQI_India/
5. https://docs.sentinel-hub.com/ api/latest/data/sentinel-5p-l2/
6. https://www.worldpop.org/
7. https://developers.google. com/earth-engine/datasets/ catalog/COPERNICUS_ S5P_NRTI_L3_AER_AI
8. https://sentinels.copernicus.eu/ web/sentinel/technical-guides/ sentinel-5p/level-2/aerosol-index
9. https://developers.google.com/ earth-engine/datasets/catalog/ COPERNICUS_S5P_OFFL_L3_NO2
10. https://www.ncbi.nlm.nih.gov/ pmc/articles/PMC8372483/
11. https://www3.epa.gov/region1/ airquality/nox.html
12. http://www.tropomi.eu/dataproducts/ carbon-monoxide
13. https://srtm.csi.cgiar.org/
14. Hadjimitsis DG (2009) Aerosol optical thickness (AOT) retrieval over land using satellite image-based algorithm, Air Quality. Atmosphere & Health- An International Journal 2: 89-97.
15. IMPACT OF JANTA CURFEW & LOCKDOWN ON AIR QUALITY, Central Pollution Control Board (Ministry of Environment, Forest and Climate Change) Govt. of India, Delhi https://www.cpcb.nic. in/air/NCR/jantacurfew.pdf.
16. Retalis A, Cartalis C, Athanassious E (1999) Assessment of the distribution of aerosols in the area of Athens with the use of Landsat Thematic Mapper data. Int J Remote Sensing 20: 939-945.
17. Ung A, Wald L, Ranchi T, Weber C, Hirsch J, et al. (2003) Air pollution mapping: relationship between satellite made observation and air quality parameters. 12th International Symposium, Transport and Air Pollution, Avignon, France.
18. Ung A, Weber C, Perron G, Hirsch J, Kleinpeter J, et al. (2001) Air Pollution Mapping over a City – Virtual Stations and Morphological Indicators. 10th International Symposium “Transport and Air Pollution”, Colorado, USA.
19. Wald L, Baleynaud JM (1999) Observed air quality over city of Nantes by means of Landsat Thermal Infrared data. International journal of Remote Sensing 20: 947-959.
20. WHO (1999) Air Quality Guidelines. Protection of Human Environment, World Health Organization, Geneva.
21. WijeratneI K, Bijker W (2006) Mapping Dispersion of Urban Pollution with Remote Sensing. International Archives of Photogrammetry, Remote Sensing, and Spatial Information Sciences 34: 125-130.


 (No Ratings Yet)


Leave your response!