| Applications | |
Monitoring the declination of surface water bodies using NDWI technique
This paper presents the usefulness of Normalized Difference Water Index (NDWI) technique in monitoring the declination in surface water bodies in an urban scenario, with the case study of Bengaluru city |
 |
|
 |
|
The Normalized Difference Water Index (NDWI) is derived using similar principles to the Normalized Difference Vegetation Index (NDVI) to enhance the spectral reflectance of surface water bodies. NDVI was introduced by Rouse, et al (1973), where the comparison of differences of two bands, red and near-infra-red (NIR) is made with the following formula. ![]() , the resultant image will have the reflectance of vegetation enhanced. Gao (1996) has introduced the concept of NDWI. The normalized difference water index (NDWI) is derived using similar principles. It uses the following formula to assess the liquid water content of the vegetation canopy.
, the resultant image will have the reflectance of vegetation enhanced. Gao (1996) has introduced the concept of NDWI. The normalized difference water index (NDWI) is derived using similar principles. It uses the following formula to assess the liquid water content of the vegetation canopy. ![]() , where SWIR wavelength is located in the region of vegetation canopy reflectance with water absorption. McFeeters 1996, has further modified NDWI to enhance the reflectance surface water bodies with the following formula
, where SWIR wavelength is located in the region of vegetation canopy reflectance with water absorption. McFeeters 1996, has further modified NDWI to enhance the reflectance surface water bodies with the following formula ![]() . After this, many researchers were able to successfully delineate the surface water bodies from Landsat MSS, TM, and ETM+ imageries, using NDWI technique (McFeeters, 1996; Jain et al., 2005; Sethre et al., 2005; Xu, 2006;). Mapping of water bodies for different years using this technique will help in analyzing the water area changes. In urban areas, lakes assume special importance in providing lung spaces, ambience, cooling, ground water recharge, habitat for various types of aqua flora and fauna (bio diversity), drinking water, bathing and washing, religious activities, cultural importance, tourism, recreation like boating, sailing, angling and fishing, giving rise to a lot of useful activities and livelihood for various people. Most important of all in the context of the present study, it provides flood mitigation during such an event. This kind of unplanned urbanization will result in the encroachment of surface water bodies. The decreased surface water bodies will induce water stagnation and urban flood. This makes it very important to study the surface water body degradation so that the corrective actions may be taken to sort out the issues. This paper presents the usefulness of NDWI technique in extracting surface water bodies using Landsat data. Applying this technique for data taken in different years will help in assessing the trend in areal extent of surface water bodies over the years.
. After this, many researchers were able to successfully delineate the surface water bodies from Landsat MSS, TM, and ETM+ imageries, using NDWI technique (McFeeters, 1996; Jain et al., 2005; Sethre et al., 2005; Xu, 2006;). Mapping of water bodies for different years using this technique will help in analyzing the water area changes. In urban areas, lakes assume special importance in providing lung spaces, ambience, cooling, ground water recharge, habitat for various types of aqua flora and fauna (bio diversity), drinking water, bathing and washing, religious activities, cultural importance, tourism, recreation like boating, sailing, angling and fishing, giving rise to a lot of useful activities and livelihood for various people. Most important of all in the context of the present study, it provides flood mitigation during such an event. This kind of unplanned urbanization will result in the encroachment of surface water bodies. The decreased surface water bodies will induce water stagnation and urban flood. This makes it very important to study the surface water body degradation so that the corrective actions may be taken to sort out the issues. This paper presents the usefulness of NDWI technique in extracting surface water bodies using Landsat data. Applying this technique for data taken in different years will help in assessing the trend in areal extent of surface water bodies over the years.
Study area
Bengaluru is the IT capital of Southeast Asia. Due to the boom in the IT industry in the city, Bengaluru has grown by leaps and bounds in the last few decades. With the increase in the demand for urbanization, many of the agricultural lands and ecological features have been converted into urban entities, which have made few areas of the city vulnerable to urban flooding. The areas close to the lakes that are subjected to urbanization are most vulnerable to water stagnation.
The city is located in the middle of the Mysore Plateau, a region of the larger Precambrian Deccan Plateau at an average height of 920 m (3,018 feet). 12.97° N 77.56° E is it’s position. Bengaluru has a three valley system namely, Koramangala, Vrushabhavathy and Hebbal. The study area is so considered that it completely covers all the three valleys. It has no major rivers flowing in the district. The Arkavati River flows in the district for a small distance in the city’s north taluk and the Dakshina Pinakini touches the borders of the district to the Northeast of the Anekal Taluk. Though there are no major rivers running through the city, it is blessed with many lakes.
There has been a growth of 632% in urban areas of Greater Bengaluru across 37 years (1973–2009). Encroachment of wetlands, flood-plains, etc., is causing a obstruction and loss of natural flood storage in the city. The number of water bodies reduced from 159 to 93. The lakes of the city have been largely encroached upon for urban infrastructure. As a result, in the heart of the city only 17 good lakes exist as against 51 healthy lakes in 1985.
The climate, affable local populace, availability of skilled man power in Bengaluru was conducive for urban development and today, the city sports a new label as Silicon Valley of India, having the unique distinction of producing the largest software professionals in the world. The growth of industries has seen a drastic increase in the population and the consequent pressure on the city’s resources, including lakes.
City lakes
Bengaluru is also known as Lake City. Its surface water bodies have a phenomenal significance. The entire ecological balance is maintained by nature on the basis of this factor. Hence, any abnormality will prove disastrous for the entire ecosystem. The lakes help in keeping monsoon waters for the drier periods of the year, canalize these important flows preventing water logging, inundation and erosion, and to ensure the refilling of groundwater. So the encroachment of lakes both legally and illegally is a major reason for water inundation in the city.
There have been many studies to assess the decline of lakes in Bengaluru city. Each study gives a different picture. According to Deepa, et al (1996), in 1973, there were 379 tanks in two taluks of Bengaluru urban district. Divided between them, 138 were located in the north taluk and 241 were located in south taluk. By 1996, they have come down to 96 in the former and 150 in the latter. This is a decline of 35.09% decline. A recent study shows that the areal extent of the tanks, which was 2,342 ha in 1973, has reduced to 918 ha in 2007, which is a remarkable decline of 60.80%.
According to Karnataka State Pollution Control Board in 1960s, there were 262 lakes. Today it has declined to 81 out of which 34 has been recognized as live lakes. Satellite data collected by BMRDA in 2001 reveals that there are 2,789 tanks/ lakes in the BMRDA that are in different stages of decay, size varying from 2 hectares to 50 hectares and have a water spread area of 18,260.48 hectares.
There were 159 water bodies spread in an area of 2,003 ha in 1973, and this number has declined to 147 (1582 ha) in 1992, which further declined to 107 (1083 ha) in 2002, and finally, there are only 93 water bodies (both small and medium size) with an area of 918 ha in the Greater Bengaluru region in 2007 ( Ramachandra T.V. and Uttam Kumar, 2008).
Apart from these, other studies and reports have also been reporting along similar lines. Though there are differences in the numbers and extents of the tanks/ lakes, all the studies accept one fact – there is a sharp decline in the number of lakes and extent of lakes in the city. All researches in this regard attribute this decline to rapid urbanization.
Disappearance of water bodies and a sharp decline in the number of water bodies in Bengaluru is mainly due to intense urbanization and urban sprawl. Many lakes were encroached for illegal buildings (54%). Field surveys (during July-August 2007) show that nearly 66% of lakes are sewage fed, 14% surrounded by slums and 72% showed loss of catchment area. Also, lake catchments were used as dumping yards for either municipal solid waste or building debris. (Ramachandra T.V. and Uttam Kumar, 2008).
Materials and methodology
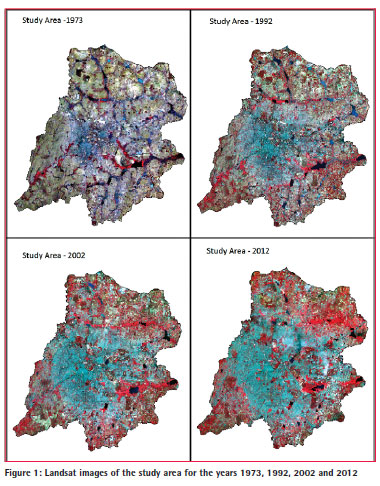
Landsat MSS, TM, ETM+(SLC off) images were collected from the Landsat archive for the years 1972, 1992, 2002 and 2012 to carry out the intended work. Layer stacking for each image was done using ERDAS 9.2. De-striping of the Landsat data for 2012 was done with ENVI 4.5, using the technique developed by Scaramuzza, et al (2004). This is done because on May 31, 2003, the Landsat 7 Enhanced Thematic Mapper (ETM) sensor had a failure of the Scan Line Corrector (SLC). Since that time, all Landsat ETM images have had wedge-shaped gaps on both sides of each scene, resulting in approximately 22% of data loss. Figure 1 contains all the four images of the study area considered for the present study.
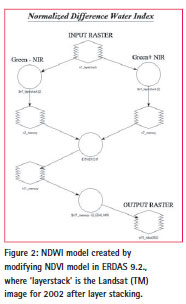
There is a ready NDVI model available in ERDAS 9.2. The same model was altered in model maker tool in ERDAS 9.2 to fit the NDWI formula . The model is given in figure 2.
The model was run for each image. For every image while executing the model, there is a requirement to change the bands, number of bands and the wavelength of those bands represent varies for MSS, TM and ETM+. The Landsat bands and their spectral wavelengths are given in table 1.
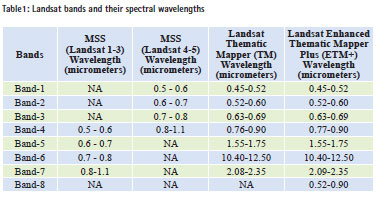
So for NDWI from Landsat MSS 1-3, band 5 and band 7 will be used whereas for Landsat ETM+, band 2 and band 4 will be used.
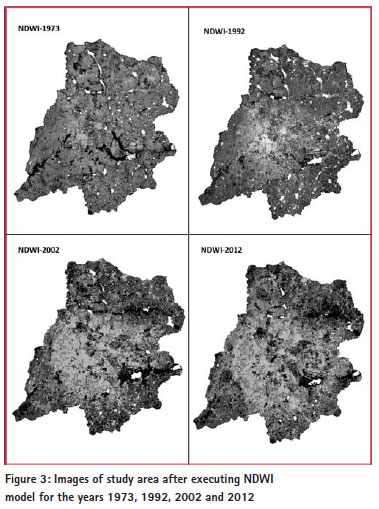
Figure 3 is the set of four images after NDWI model was run for all the images. When these images are compared with the original FCC images, a clear distinction between them can be made out. In NDWI images, a clear spectral enhancement of the water bodies can be seen, which is not so in the original image.
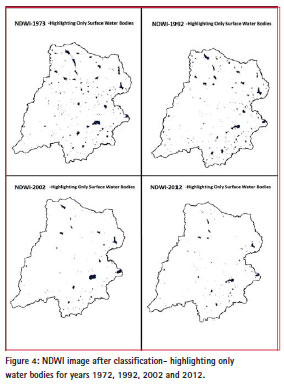
So the brightest portions those can be seen in the images are the water bodies in the study area. This image was then classified in ERDAS Imagine 9.2 using supervised classification technique. In the signature editor, the brightest features which represent surface water was considered as one class, and other classes were created as any other supervised classification. This classified image was then imported into ArcMap 9.2 and the display properties of this image theme was so changed that the class that represents water is set to blue and all other classes are assigned to no color. This makes the resultant images to have only surface water bodies and nothing else. The resulting image is given in Figure 4.
Results and discussions
The study shows the evident decline in the extent of surface water bodies in Bengaluru. The city now faces water inundation problems even for relatively lower rainfall. Carrying out the same study, using high resolution images, can give much more detailed results. The results may vary depending on the season, as the NDWI operates on the reflectance values and not the elevation values. So it is suggested to use the images from the same season of different years to arrive at the result.
This study demonstrates the usefulness of NDWI technique for monitoring the Declination of Surface Water Bodies. Especially in an urban area, where the surface water bodies act as storm water receivers, the decrease in the area of surface water bodies is alarming. RS and GIS techniques may effectively be used to monitor any such changes and take appropriate actions to restore the ecological balance or prevent such further occurrences.
This application of Remote Sensing and GIS in Hydrology is useful in many hydrological related studies. Apart from the current study, (i.e., flood risk assessment), this tool can be used in many other applications as well. As the model deals with spectral band combinations and not the elevation profile of the area, it will map any area containing water. Any hydrological feature like, lake, river, drainage, etc., can be mapped using this tool. Urban planning, Groundwater Prospects, Natural Resource Management, etc., are the few applications of this tool. This makes the tool widely used even after so many years since it was first used. The disadvantage of the model is that it cannot be used to delineate the water bodies as the result of NDWI study is greatly influenced by different seasons.
References
Deepa R.S, Ramachandra T.V., and Kiran R., 1996. Anthropogenic stress on wetlands of Bangalore. Bangalore: Centre for Ecological Science, Indian Institute of Science.
Gao B., 1996. NDWI – A normalized difference water index for remote sensing of vegetation liquid water from space, Remote Sensing of Environment, 58(3):257–266.
Jain, S.K, R.D. Singh, M.K. Jain, and A.K. Lohani, 2005. Delineation of flood-prone areas using remote sensing technique, Water Resources Management, 19(4):337–347.
Ramachandra, T. V. and Uttam Kumar (2008), Wetlands of greater Bangalore, India: automatic delineation through pattern classifiers. Electron. Green J., 2008, 1(26); http://escholarship.org/uc/item/
Rousse, J.W., Haas, R.H., Schell, J.A., and Deering, D.W., Monitoring Vegetation Systems in great Plain with ERTS. In: Proceedings of the Third ERTM Symposium. US Government Printing Office, NASA Washington , DC, pp. 309-317
Scaramuzza P, Micijevic E, Chander G (2004) SLC gap-filled prod-ucts: phase one methodology. Available online at: http://landsat.usgs.gov/ documents/SLC_Gap_Fill_Methodology. pdf , accessed on15 July 2012
Sethre, P.R., B.C. Rundquist, and P.E. Todhunter, 2005. Remote detection of prairie pothole ponds in the Devils Lake Basin, North Dakota, GIScience and Remote Sensing, 42(4):277–296.
Xu, H., 2006. Modification of normalised difference water index(NDWI) to enhance open water features in remotely sensed imagery, International Journal of Remote Sensing,27(14):3025–3033


 (5 votes, average: 3.60 out of 5)


Leave your response!