| Disaster Management | |
MEGA earthquake prediction method using a yearly unit periodicity
The method is based on newly developed multiple year interval analyses between combinations of past MEGA earthquakes in each region derived from historical records |
 |
|
 |
|
Abstract
The objective of this research is to develop a long-term MEGA earthquake prediction method using a yearly unit periodicity for past MEGA earthquakes for supporting clearly targeting preparedness against earthquake disaster. Hereinafter MEGA earthquake means large earthquakes with human casualties. The method is based on newly developed multiple year interval analyses between combinations of past MEGA earthquakes in each region derived from historical records. Three case studies shown in the paper include East Japan, Tokyo Metropolitan Area and Nankai Pacific Area where seriously damaging MEGA earthquakes and/ or Tsunamis have occurred in the past. The results demonstrate, based on longterm prediction of yearly units, that the year of 2026 for both East Japan and Tokyo Metropolitan Area, and the year of 2053 for Nankai Pacific Area, are the most likely repeatable MEGA earthquakes with magnitudes similar to those that occurred in the past.
Introduction
The earthquake investigation committee of the Japanese Government has presented the 2020 version of seismic hazard map for the public which includes color coded probability percentages indicating the risk of M7 class earthquake occurrence in the next 30 years1). However, it is difficult to understand how to promote preparedness against upcoming MEGA earthquakes in the next 30 years from this hazard map. It would be unclear how to understand for example, 70% probability risk over the next 30 years in the Tokyo Metropolitan Area. The Japanese nation expects to receive long-term predictions with clear targets when the most serious earthquakes ate likely to occur, regardless of the correctness. Moreover, another problem is that the committee has not shown how to compute the probability percentage based on scientific rigor. No one can verify the hazard map with the corresponding probabilities for individual residential areas.
One of the largest worries for the Japanese nation will be future occurrence of MEGA earthquake in the Nankai Pacific Area (see Fig. 1) which, in the past is estimated to have caused about 300,000 casualties, if a similar MEGA earthquake and Tsunami occur as in the past, in 100 to 150 year cycles. Many people living in the 700 km along the Nankai Trough in the west to Sagami Trough in the east, would be anxious about their future, but not able to prepare specific emergencies measures when the probability for the next 30 years is only 80%.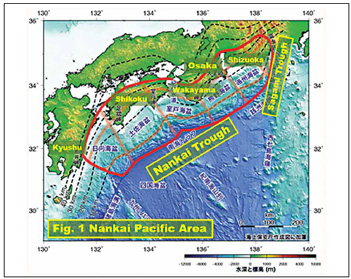
The paper in “Nature’ by the American scientist Bakun and his colleagues (Bakum et al 1985) predicted that a M6 class earthquake may occur ±5 years from 1988 with 90% probability derived from the average cycle between the past earthquakes along San Andreas Faults in California, USA in 1857, 1881, 1901, 1922, 1934 and 19662). However, the prediction was not correct as the M6.0 earthquake occurred in 2004.
The authors of this paper have reconsidered the existing earthquake probability analysis methods using the mean and standard deviation based normal distribution of earthquake occurrences. As a result of this re-consideration, a prediction method based on yearly unit periodicity analysis with multiple combinations between past MEGA earthquakes has been developed as described in this paper.
Long-term prediction method using a yearly periodicity analysis
Step 1: Select past records of MEGA earthquakes from the website such as for example, USGS site (https://earthquake. usgs.gov) based on a yearly unit. Let n be the number of the earthquakes selected.
Step 2: Prepare a matrix table with i line and j column (i=1, n; j=1, n). Let the years of MEGA earthquakes be Y(i) and Y(j).
Step 3: Calculate the multiple intervals T (i, j) between the year of MEGA earthquakes as follows.
T(i, j)=Y(i)-Y(i – j) (i>j: i=1,n+1; j=1,n)
Step 4: The year to be predicted for the next predicted MEGA earthquake is Y (n + 1).
Step 5: Apply a similar procedure as Step 3 and search the most likely risky year with maximum number of multiple yearly intervals.
Step 6: Check the same or multiple year intervals of more than 10 years at the Y(n+1) line and change the number to red color. Change the common periodical year number to blue color for years other than Y(n+1).
The results of cases studies in Japan
Case study 1: East Japan
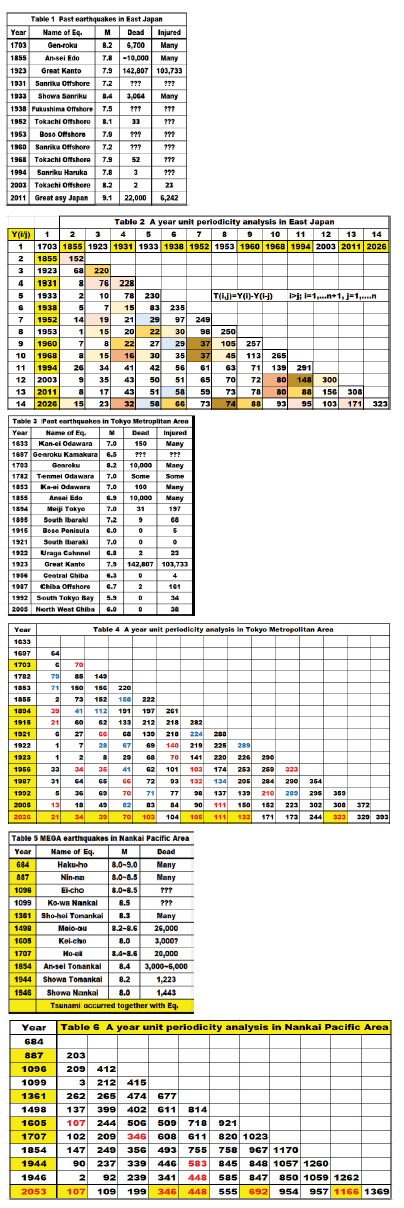
Table 1 shows the past records of MEGA earthquakes in East Japan including Kanto Area of Tokyo, Tohoku Area and Hokkaido.
Table 2 shows the result of a yearly unit periodicity analysis in East Japan.
The 14th line of 2026 in Table 2 lists eight periodical cycle years including multiple cycle years of 15, 32, 58, 66, 74, 88, 95 and 171, which corresponds to the years 2011, 1994, 1968, 1960, 1952, 1938, 1931 and 1855.
We use different colors to show the numbers which have multiple relations.
• light yellow color for 15, 30, 45, 105 and 300
• medium yellow color for 22, 66, 88 and 220
• dark yellow color for 37, 74 and 148
• pink color for 19, 76, 95, 152, 171 and 228
• dark pink for 16, 32 and 80
• blue color for 29 and 58
We can also see that 43, 51 and 80 appear in both 2003 and 2011, and 58, 73 and 88 appear in both 2011 and 2026.
It is concluded that the year of 2026 should be the most likely risky year for the next MEGA earthquake in East Japan, as the number of common periodical cycle years is a maximum. It should be noted that there are seven periodical cyclic years including multiple cyclic years, part of which are shown in blue. The numbers 43, 51, 78, 80, 88 and158 in red color, correspond to 1968, 1960, 1933, 1931, 1923 and 1853. If the long-term prediction method had been applied before 2011, we could have predicted that 2011 would be the most likely risky year, and we would have been able to reduce the impact of the 2011 Great East Japan Earthquake disaster which caused 22,000 casualties.
Case study 2: Tokyo Metropolitan Area
Table 3 shows the past record of MEGA earthquakes in Tokyo Metropolitan Area including Yokohama, Chiba and Saitama, while Table 4 shows the result for a yearly unit periodicity analysis in Tokyo Metropolitan Area. The 16th line of 2026 in Table 4 shows nine periodical yearly cycles including multiple year cycles which are listed in red color. They are 21, 34, 39, 70, 105, 111, 132 and 328, which correspond to the years 2005, 1992, 1987, 1966, 1923, 1921, 1894 and 1703. It is concluded that the year of 2026 should be the most likely risky year for the next MEGA earthquake in Tokyo Metropolitan Area, as the number of common periodical cycle years is a maximum.
Case study 3: Nankai Pacific Area
Table 5 shows the list of the past record of MEGA earthquakes in Nankai Pacific Area including Kyushu. Shikoku, Wakayama and Shizuoka. Table 6 shows the result of a yearly unit periodicity analysis in Nankai Pacific Area.
In the 12th line of 2053 in Table 6, five periodical yearly cycles including multiple yearly cycles are listed in red color. They are 107, 346, 39, 448, 692 and 1166, which correspond to the years 1994, 1707, 1605, 1361 and 887. It is concluded that the year of 2053 should be the most likely risky year for the next MEGA earthquake in Nankai Area, as the number of common periodical cycle years is the maximum.
Considerations for the result
Although the long-term prediction method introduced in this paper is not verified on a scientific basis, this approach could persuade the Japanese people to be prepared for MEGA earthquake disasters because the method can show the risky years. It is much better and clearer than the Japanese Government’s longterm prediction in the form of xx% in 30 years in the future. Another benefit is that the proposed method will be available for anybody to calculate simply if the past MEGA earthquake record in the relevant area can be searched.
At least it can be said that the results obtained from three case studies in this paper seems reasonable for individuals to execute preparedness for their own risk of MEGA earthquakes. Otherwise, people have no other options than to believe the Government’s probability prediction without scientific evidence.
It may be surprising to know that there is a yearly periodicity for MEGA earthquakes as shown in this paper, which seems to be a strange coincidence. However, the cyclic anomalies occurring on Earth including earthquakes, volcanic eruptions or global change such as global warning may have been strongly influenced by the solar cycle such as sunspot 11 years cycle, as well as planetary orbital cycles of 12 years for Jupiter and 29 years for Saturn. In Table 2, the cycle of 58 corresponds to multiple cycles of the Saturn planetary cycle, 66 and 88 corresponds to multiple solar cycle4).
Conclusions
1. A new MEGA earthquake prediction method using a yearly unit periodicity has been developed by the authors.
2. The validation results of three case studies reveal that the most likely risky years for the next MEGA earthquakes are clearly based on a yearly unit, which will be helpful for preparedness against earthquake disasters in Japan.
3. The advantage of the long-term prediction method developed by the authors is very clear and simple for individuals to calculate the most likely risky years from past earthquake records. It would give individuals a free hand to believe or not their own risk.
4. The new method will be verified in future when case studies are accumulated in various areas.
Acknowledgement
We would like to extend appreciation to Prof. Emeritus Dr. John Trinder for his kind reviewing the contents as well as editing English. We also appreciate Mr. Toshihiro Kitta, President of JESEA for his kind supporting our research.
References
1. https://www.jishin.go.jp/ evaluation/seismic_hazard_map/ shin_report/shin_report_2020/
2. Bakun, W.H., Aagaard, B., Dost, B. et al. (2005) Implications for Prediction and Hazard Assessment from the 2004 Parkfield Earthquake. Nature, 437, 969-974. https:// doi.org/10.1038/nature04067
3. https://jishin.go.jp/regional_ seismicity_rs_kaiko/k_nankai
4. Gribbin, J. Relation of sunspot and earthquake activity. Science, 173, 558 (1971).


 (2 votes, average: 4.00 out of 5)


Leave your response!