| Geodesy | |
Malaysia precise geoid (MyGEOID)
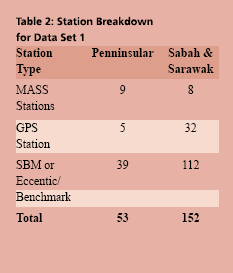
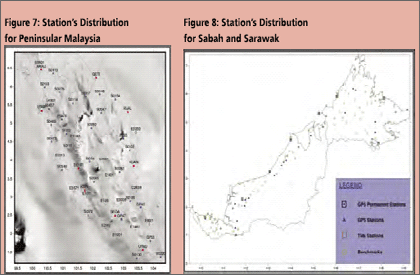
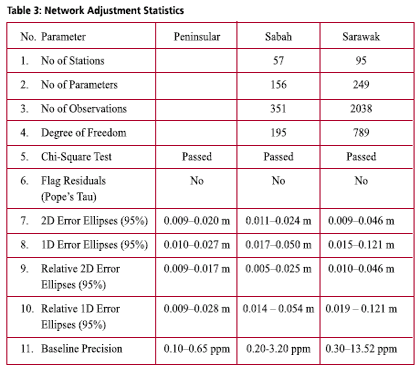
Fitted GEOID modellingThe existence of datum bias (differences between geoid and local mean sea level) will not gives satisfactory results if based on direct reduction formula (1). In order to overcome this problem, fitting the gravimetric geoid onto the local mean sea level (NGVD) will minimize the effect of datum biases. GEOID modelling by surface fittingThe most common method in geoid modeling techniques is by fitting a surface on a reference points. In this fitted geoid modelling, the strategy is to fi t the gravimetric geoid for Peninsular Malaysia (WMG03A) to the geometric model or sometimes referred to as a “GPS-geoid” (Forsberg 1998). NGPS = hGPS – Hlevelling (5) However, in a local area, determined geoid model with surface fi tting just works in the coverage area of the reference points properly. The model doesn’t give reliable results for the extrapolation points. Researches shows that this method gives better results where the geoid have a regular trend and with well distributed and intensive reference points, and it is essential that both levelling and GPS height are as error-free as possible. The fitting of the gravimetric geoid to GPS-geoid surface is in the grid form and involve modeling the differences:) By adding the correction Where, NGPS(i) and NGrav(i) are the geoidal height at point (i) obtained from gravimetric and GPS-geoid models respectively. a1 to a4 are the four unknown parameters, The geoid undulations of interpolation points were determined according to Least Squares Collocation (LSC) method. Collocation is the most general form of the adjustment process which includes least squares adjustment, filtering and prediction (interpolation, extrapolation) steps with in a combined algorithm. In the process the covariance function must be determined for the residuals geoid errors In the Gravsoft software package the covariance model of a second order Markov model is used (Forsberg 1998). GPS data acquisition, processing and adjustmentData acquisitionGPS observation on Benchmark project was carried out by DSMM in 2003 and 2004. GPS Observation period for the data sets are between 4 – 9 hours, with the observations divided into three separate network for Peninsular, Sabah and Sarawak. A total of 53 stations have been observed in Peninsular and 133 stations in Sabah and Sarawak. The station breakdowns are tabulated in Table 2, and stations distribution for Peninsular and Sabah and Sarawak as in Figure 7 and 8 respectively. GPS data procesing and adjustmentBernese GPS Post Processing Software Version 4.2 has been used to process the whole GPS campaign data for Peninsular and Sabah, and Trimble’s Geomatic Offi ce (TGO) Version 1.61 was used for GPS data from Sarawak. The standard processing strategy as employed by DSMM were used with the following parameters for Bernese 4.2: The output from the data processing is the stations coordinates with it respective covariances and the resolved baseline ambiguity is at the level between 60 – 90 %. The GPS network adjustment was carry out using Geolab adjustment software from Microsearch Corparation for the three independent GPS networks of Peninsular, Sabah and Sarawak. The adjustment of the networks is based on the new Geocentric Datum for Malaysia 2000 (GDM2000) and the standard error modeling and scaling have been adopted. The statistics of the adjustment results are as in Table 3. Levelling networkThe vertical control in Peninsular Malaysia, Sabah and Sarawak was constructed separately. The new height datum for Peninsular Malaysia was determined in 1994 based on the mean sea level (MSL) value from the tide gauge in Port Klang after more than 10 years of observation (1984-1993). The height was transferred from Port Klang using precise levelling to a Height Monument in Kuala Lumpur by 3 different precise levelling routes. In Sarawak, there are six vertical datums known as Pulau Lakei Datum, Original Datum, Bintulu Datum, Merapok Datum, Limbang Datum and Sabah Datum. Pulau Lakei Datum and Original Datum are based on MSL 1955 and MSL 1935 respectively. Meanwhile, Bintulu Datum and Merapok Datum are based on triangulation station network heights which are connected to Pulau Lakei Datum and Original Datum. Limbang Datum is referred to a year of tidal observation at Limbang Jetty and Sabah Datum refers to one month tidal observation at Sipitang in 1949. As for Sabah, beginning 1997, all levelling network that has been run by DSMM refers to MSL in Kota Kinabalu based on 10 years of tidal observation (1987-1997). The leveling network in Sabah and Sarawak has recently unified by adopting the MSL value from Kota Kinabalu Tide Stations. |


 (No Ratings Yet)


