| GIS | |
Integrated infrastructural design and management using BIM and GIS
A protocol should be developed that a GIS specialist is to be associated with any infrastructure apart from engineers |
 |
|
 |
|
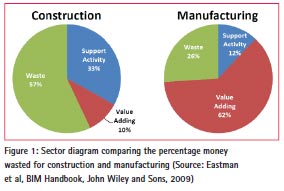
Saudi Arabia is a land of rush infrastructure development. Billions are spent in construction of huge projects like smart cities, universities, etc. The activities and facilities include intricate tasks in all levels of their life cycle. The money is spent in improving quality of these activities and facilities, and their safe execution. But in reality, the resources are exploited. These resources are valuable and must be allocated efficiently and not wasted. In construction industry, the money spent for the waste created is more than 50%, and when compared to the manufacturing industry, it is only 26% [1]. Figure 1 illustrates this fact. Another fact is that there has been no productivity gain in the construction industry over the last 40 years (Figure 2) [2].
The foremost element to be offended is the current method of drawings created as just 2D, since the current construction practice relies upon drawings. Softwares like AutoCAD, Microstation are used for creating 2D images of the construction features. Using this rough design, the process of bidding becomes a major problem. The models created will not give detailed information of the features in a short time since they do not have the database – the repository of data. These concerns will lead to cost overruns, stays, aversion and errors. Also all the work is tedious too. The alternative to this method is GIS and BIM.
Present Scenario
The deployment of GIS in Saudi Arabia is expected to rise rapidly in the coming years. Construction boom is occurring daily, and the prime encounter is managing the information about improving infrastructure. We suggest that the application must be proliferated for infrastructure development. The current demand of the construction industry requires a highly efficient project management team with accurate planning, scheduling and management of resources of a project which can lead to the successful completion of specific project goals and objectives. The primary challenge of project management is to achieve all the project goals and objectives while adhering to classic project constraints, usually scope, quality, time and budget. The secondary and more ambitious challenge is to optimize the allocation and integration of inputs necessary to meet pre-defined objectives. A project is a carefully defined set of activities that use resources (money, people, materials, energy, space, provisions, communication, motivation, etc.) to achieve project goals and objectives [3].
The traditional approach for scheduling and progress monitoring techniques like Bar Charts, Critical Path Method (CPM), Programme Evaluation Review Techniques (PERT), etc., are still being used by the project managers for planning. This primarily affects the decisionmaking purpose as they fail to provide the necessary spatial aspects and data [4]. The project manager will be overburdened by the immediate requirements of the client to shorten the delivery period. and minimize the cost without compromising on the quality and efficiency of the product. All these problems can be solved by integrating GIS with the current methods of project management. Researchers have suggested that project managers can use 4D methods and simulation for effective resource allocation [4]. Even 5D methods are being developed now. Bansal and Pal have described the linking of the activities in a critical path schedule with the 3 dimensional model, which makes the project sequence easier to understand. Some commercial tools allow the planner to build a 4D model and create the graphical simulation, though it still lacks features like generation and manipulation of a 4D model within a single environment [4]. CAD drawings do not provide a consistent document like a database listing of different aspects like bid and contract documents, Bills of Materials (BOMs), timelines, specifications, price lists, installation and maintenance guides, cable lists and labels. Also if documents are available, it will be dozens or hundreds as separate ones. This won’t help for proper communication between all stakeholders. And again, the facilities or activities can’t be maintained properly.Traditional CAD drawings may reduce certain bidding costs where variation orders may not be communicated between all contractors, but the change orders or errors can’t be excluded.

BIM with the help of GIS
The innovative approach for construction tracking is by leveraging tools like BIM and GIS. BIM in its present state is commonly used for complex projects like high rise buildings, smart cities, etc. The term is commonly applied for planning, design, construction, and management of buildings; however its capabilities can be extended to challenging and complex civil engineering projects [5].
Competitive Advantages of BIM in a Down Economy
[6] McGraw-Hill Construction research shows that in the face of an economic recession, BIM users expect to significantly ramp up their investment in BIM in 2009. Experienced users are realizing greater productivity, improved communications and a competitive edge when bidding for work. As development opportunities tighten, these users continue to differentiate themselves from those who have yet to adopt the technology, bringing value to clients while improving their bottom line.
Key Findings
• 62% of BIM users will use it on more than 30% of their projects in 2009
• 82% of BIM experts believe that BIM has a positive impact on their company’s productivity
• 72% of BIM users say that BIM has had an impact on their internal project processes
Building Information Modeling (BIM) and Geographical Information Systems (GIS) can be used to model an artifact in 3D with time related data stored in fourth dimension, and cost related data stored in fifth dimension.
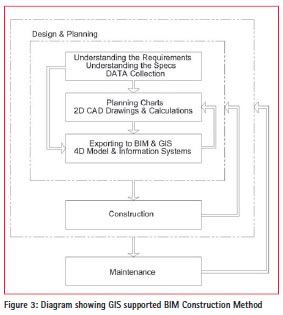
This is accomplished with the help of specific softwares. We have already discussed the present scenario. In the new method, we will prepare a real 3D model supported by a geo-coded information system. Figure 3 below explains how this method is executed in construction projects from its initial design to its maintenance. This geo-coded information system provides a unique identification number to each and every artifact of the project.
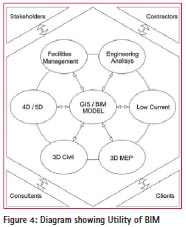
To every artifact we can add spatial and non-spatial data including the five dimensions and attributes like specifications, details, etc. BIM provides explicit information with the aid of a powerful database regarding facilities management, engineering analysis, 3D MEP, 3D Civil, 4D/5D and low current to all stakeholders, contractors, clients and consultants (Figure 4).
Top Benefits of BIM
• Easier coordination of different software and project personnel
• Improved productivity
• Improved communication
• Improved quality control [6]
First of all, we will discuss the interoperability issue arising while shifting from 2D to 3D data. The practical implementation of the above method is explained with the help of a case study. In this, ArcGIS software developed by ESRI is used. The advantages of this approach are explained later along with the challenges in its implementation.
Interoperability
It is imperative that CAD and GIS is to be integrated; but bridging a link between them is more challenging. This is because both deliver evidence of the same real world assets in every level of their lifecycle. The need for an integrated approach is illustrated by applications as plan development and visualization, data collection, Location Based Services (LBS), and Virtual and Augmented Reality (VR & AR) [7]. The inadequacy of interoperability stands as a stumbling block for the integration. This is due to the following facts – existing CAD and GIS platforms have been developed independently with different purposes resulting in significant differences in terms of data formats they support, terminology they used, semantics of concepts they represent, reasoning techniques on which they are based, different scale representations, and transformation of the local (CAD) coordinates into reference system for both horizontal and vertical coordinates, geometry modelling in both systems. CAD software provides all kinds of primitives to create geometric (and their visual attributes). It represents objects with different representations such as CSG and Sweeping. However these primitives are not supported in GIS (e.g. parametric primitives), while geospatial models mainly use BRep as the main geometrical representation method. Furthermore, CAD models usually do not store topologic information which is in fact an important characteristic of geospatial models (i.e., geospatial models use topology to store geometric information in a more efficient manner) [8]. A true solution for an integrated CAD/ GIS framework concerns formal and shared semantics and integrated data management. The development of formalized semantics is crucial in achieving the true CAD/GIS integration. First, the semantics of geometry and other information within a domain need to be formalized, that means domain ontology has to be developed. Next, these domain ontologies have to be matched for exchanging meaningful information. This can be realized through an integrated and defined ontology covering the CAD and GIS concepts in one framework [7]. The next step is to create compatible datasets that can serve multiple CAD and GIS purposes. So, a prototype created in one software can be exported to other softwares.
Modern softwares are now compatible with GIS, such that data can be exchanged in both directions in a real time basis. A representative figure (Figure 5) developed by ESRI is shown below which explains how attributes of data is exchanged between CAD and GIS.
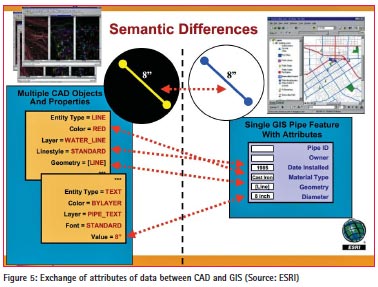
Typical tools for the exchange of attributes proposed by ESRI [9] include:
• Cyclical/Bi-Directional Translation
• Direct Read CAD data in GIS
• Direct Read GIS data in CAD
• Legacy CAD to GIS Data Migration
In this way, many softwares for engineering analysis are now compatible with GIS. So, data exchange between analysis software and drafting software can be done in one platform using a single model. This is one of the astonishing benefits of GIS so that real time analysis can be done. For example, power fl ow analysis software developed by ETAP is capable of importing data from GIS model, and after analyzing, exporting it to the proposed GIS model [10]. As a shared knowledge resource, BIM can reduce the need for re-gathering or reformatting information. This can result in an increase in the speed and accuracy of transmitted information, reduction of costs associated with a lack of interoperability, automation of checking and analysis, and unprecedented support of operation and maintenance activities [11].
Case Study
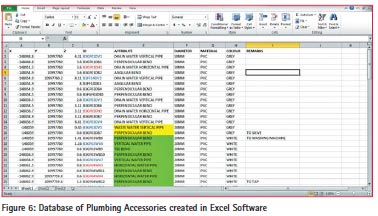
In this study, a 3D model and a geocoded database is created. The model is created of a residential two-storeyed building. The database is created for plumbing accessories. Normally, 3D model is created from 2D drawings created in softwares like AutoCAD. The challenges of interoperability have to be overcome. In this case, since it is a simple structure, using GIS itself the 2D plan is created. ArcGIS of ESRI is used. Over this 2D drawing, the 3D model is generated after creating different layers. ArcMap of ArcGIS is used to create the 2D plan. The 3D views are obtained in ArcScene of ArcGIS. modeling is just one aspect of BIM that has hogged the limelight, but its real strength and power lies in the knowledge database that can be used in conjunction with other software to deliver quick and reliable information in areas of sustainability, estimating, structural analysis, demolition and reconstruction [12]. GIS can be well integrated in those platforms where there is distributed nature of construction work [13]. Plumbing layouts involve many pipes, bends, joints, etc. Since the plumbing system carries fl uid, thorough inspection and care to be maintained throughout its lifecycle. A small leak can lead to heavy damage of the many construction facilities, thereby affecting their lifecycle too. In the study, the position of bends and sanitary items were noted down as points, and the position of pipes in a stretch (vertically and horizontally) were noted down as a set of points. The other fact to be noted down while inspecting is the coordination among individuals who may be unfamiliar with the project or are managing many projects. Information management of activities at the construction site are typically done with construction drawings, daily journals, photographs, and a variety of paperwork associated with testing (i.e., pressure testing). Retrieval of this information is not generally an easy task and can take a considerable amount of time to assemble and manipulate into a presentable format [13]. This study assigned an identification number to the plumbing accessories that identify its position and function. Every component has its own number. This number is created in the database (Figure 6) which is created in Excel software. Since the building can be viewed in 3D and the plumbing accessories as points, this allows us to understand the plumbing layout. Every point will have just one three dimensional value which is obtained according to the origin set for preparing the plan of building. When a component fails, it can be found in the database along with all pertinent information. Since the plumbing accessories can actually be ‘seen’ in 3D environment, we can easily determine the component’s location and information via the number and database. This is helpful in effectively maintaining and managing a plumbing system. At the same time, if we need to know the location of a plumbing accessory, we can use the database to determine it. This reduces search and test time at the site during maintenance [14].
General building plumbing is divided into water supply, drainage stack and sewage stack. Each division becomes a field, listing the attribute of a pipe with the plumbing code making it easy to recognize. Besides shaft plumbing has vertical pipes while most plumbing has a horizontal configuration. This study assigned the code, ‘V’ with vertical pipes, ‘H’ with horizontal pipes and ‘B’ with bends. This GIS database not only can control and understand the subordinate relationships between the pipes, but also their arrangement location [14]. Plumbing attribute is described by ‘D’ for drainage pipe, ‘S’ for sewer pipe and ‘W’ for water pipe.
For example, with regards to component code ‘WH22’, ‘W’ represents water pipe, ‘H’ represents horizontal pipe and the number 22 represents that it is the 22nd horizontal pipe. For this component code framework, one can ascertain location of the pipe. Water distribution and drainage configuration is complicated in buildings since the area is large. It is not enough to describe the component location by just the forward code. This study assigns building codes and spatial codes before the component code. The building is the third one in a lane, so this study assigned it the code name ‘B3’. After the building name code, a four digit code is used to describe the spatial number. For example, the component code for the 22nd horizontal water pipe passing room no 12 in the first floor of the building is ‘B3FFWH22’ (Figure 7).
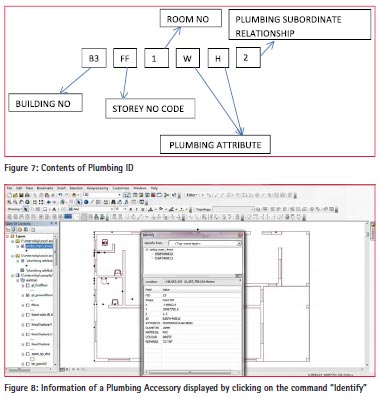
Thus for this study, component codes need ten numbers. The front two numbers are the building code. The next two is the storey number. The fifth and sixth numbers indicate room number. The seventh and eighth are attributes of plumbing accessories, and the last two numbers indicate the subordinate relationship of network components. If every component uses this framework it will be easy to recognize.
After creating an ID for different components, the database is set up. In this study, the database has the point coordinates, IDs, attributes, diameters, materials, color and remarks. All the information is saved in an xlsx file format in excel file. This excel file is directly exported to ArcGIS. Thus, a shapefile is created from a series of x, y, z locations in the excel file. Users can easily point to any component (point) using the command ‘Identify’ and connect and display all of its information ( Figure 8 ) in the ArcMap.
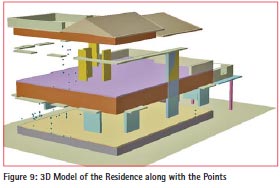
In the 3D environment, the points are viewed as shown in the following figure (Figure 9) in ArcScene, where the model can be rotated, moved and zoomed.
When the structure is built, the follow up service and maintenance can be done by just taking photographs of the plumbing accessories and loading it in the same database.
Traditional shop diagrams are limited by the size of the paper on which it is drawn. However, GIS can connect files and information so that it is not as limited as paper. The plumbing illustrated by GIS can also benefit the community by providing complete configuration information for local plumbing systems [14].
Advantages
Here we are trying to emphasize that GIS benefits can be well enjoyed by clients, contractors, consultants and stakeholders dealing with a project from its initial planning to its implementation and to its scrap value. By implementing GIS in the construction field, all disciplines are profited in the areas of planning, designing, implementation, facilities management and maintenance. Obviously, 3D data is more beneficial for everyone compared to 2D data. 4D and 5D models can be created in GIS by incorporating time and cost constraints. This aids complete optimization. Utilizing GIS increases the coordination among various disciplines involved in construction and also communication. This avoids the inter-disciplinary/contractor or related time delay and disputes [15]. This is a transition from tedious 2D works to a highly co-ordinated 3D model supported by a geo-coded database. As GIS provides the updated model, an expert team can observe it even from a remote area. The other aspect is that the spatial and non-spatial data can be used to make representations which are easily understood by any sector of people (not specifically engineers).The complexity of construction is increasing day by day such that enormous data is to be dealt with. This can be done effortlessly with the geocoded database. As multi-dimensional updated data is available, as per requirement activities they can be scheduled. Thus, GIS aids facilitation management and supply chain management [16]. For large scale buildings, the required supply of material may be ignorant at a particular point of time. Nobody knows where the material is. Speculations will lead to wastage of time. By just looking at the database and viewing in 3D, everything becomes evident. Time is saved. Rundell (2006) suggested that owners and operators can mitigate their portion of the cost by using the high-quality building information from a Building Information Modelling (BIM) design process during the longer, more expensive maintenance and operation phase of the building’s lifecycle. A good example is that BIM may allow asset managers to enter the decision-making process at a much earlier stage, where they can infl uence the design and construction [17]. In the construction field, most of the work may be under sub-contract. The method of GIS and BIM can increase better understanding, coordination and communication between sub-contractors. This leads to saving more money and time, and quality improvement. As the responsibility is laid down for each subcontractor, the client can authorize the faults exactly of the victim. Suddenly if an organization terminates their operations, the database of GIS will aid the new organization to comprehend the history of operations with complete details. The new firm can do the instant bidding too. For a newcomer to a firm, he himself can grasp the project effortlessly with the aid of a 3D model and database of this model. If it was just 2D and devoid of a database, it would have been time consuming. The concept will be fruitful in countries where the people working in such construction sites alternately changes. If a high level meeting is underway and sudden analysis and further decision is to be taken, GIS database comes to the rescue. The 3D perception gives more information too. As drawing developed by this method is much more informative than 2D, because each and every aspect of the construction is recorded in the database. Normally, the head office of a company may be situated far from their construction site. This method aids in better understandability between head office and site. Changes or variations or client specific instructions are inevitable in any project. But the fact is that client or consultant may not be in a position to accept the fact when it comes to money matters, or they might reject it citing concurrent delays from the contractor. In many case, contractors are also facing difficulties in providing proper back up documents. As a result of this, huge correspondence is going back and forth between contractor and consultant or client without any fruitful result [18]. At the design stage itself variation order management is to be done. Change management can be efficiently tracked by this method which provides the full back-up documents.
Nowadays, as people have become familiar with GPS-enhanced equipments, the project management team can exploit this situation to the fullest. As GIS is capable of interlinking with different parameters like climatic conditions, global warming, water data, etc., the design team can utilize this on real time basis. According to building SMART Australasia, concerted government support for the use of BIM by the notoriously fragmented Buildings Network could increase usage by 2025 by six to sixteen percent according to conservative estimates from industry representatives. This accelerated rate of BIM adoption would produce an economic benefit equivalent to $5 billion added to Australia’s GDP [19].
Challenges of BIM
• Adequate training
• Senior management buy-in
• Cost of software
• Cost of required hardwareupgrades [6]
In order to implement this method adequate training is required. Designing becomes much more complicated and time consuming. Purchasing software and hardware is a must. The manager may not be ready to cope up with the new method of implementation as they have to shift from their current practice. As with any new technology, the cost of software and required hardware upgrades are common hurdles. Clearly, the major concern for implementing the method is money and training. For small projects, this may not be a profitable business.
Conclusions
BIM and GIS are significant uprisings in the construction industries. According to building SMART Australasia [19], BIM and GIS should coexist and harmonize. With increased profitability, reduced professional risk, less waste, less rework,better time management, improved communication and improved efficiency, the construction firms can use BIM and GIS to create new revenue streams and add to profitability. [6] Research shows that users see clear benefits of BIM and they respond by deepening their use of the technology. At a time when the overall development market is tightening, these users are looking for BIM to help them gain a competitive advantage. The government should try to implement BIM supported by GIS in all big projects in an immediate basis to save billions of riyals and bringing the work force to cope with new technology.
Acknowledgement
We are deeply indebted to Mr. Rasnal Ali M. P, Senior Planning Engineer, Faithful and Gould, Saudi Arabia for his valuable information about project management.
References
[1] Chuck Eastman et al, BIM Handbook: A Guide to Building Information Modeling for Owners, Managers, Designers, Engineers, and Contractors, www.academia. edu, John Wiley and Sons, 2009
[2] Paul Teicholz, Labor Productivity Declines in the Construction Industry: Causes and Remedies, AECbytes Viewpoint, April 14, 2004
[3] www.globalknowledge.ie/ courses/business-subjects/ project-management/
[4] Gopal M. Naik, Aditya M. and Suma B. Naik, GIS Based 4D Model Development for Planning and Scheduling of a Construction Project, International Journal of Innovation, Management and Technology, 2 (6), pp.447-451,December 2011
[5] X. Zhang, Y. Arayici, S. Wu, C. Abbott and G. Aouad, Integrating BIM and GIS for large scale asset (building) management: a critical review, Paper for CC 2009: first draft, March 2009
[6] Norbert W. Young Jr., Stephen A. Jones and Harvey M. Bernstein,Building Information Modeling (BIM) – Transforming Design and Construction to Achieve Greater Industry Productivity, Smart Market Report, McGraw Hill Publication
[7] SisiZlatanova and Peter van Oosterom, GIS/CAD Integration, Bentley First Geospatial Research Seminar, BEConference, 2004
[8] El Meouche R., Rezoug M., HijaziIhab, Integrating and managing BIM in GIS, software review, International Archives of the Photogrammetry, Remote Sensing and Spatial Information Sciences,Volume XL-2/W2, ISPRS 8th 3DGeoInfo Conference & WG II/2 Workshop, 27 – 29 November 2013
[9] Don Kuehne, GIS/CAD Interoperability, ESRI, CAD Product Management
[10] etap.com/smart-grid/smartgrid- dispatching-gis.htm.
[11] GSA BIM Guide Series 1, www.gsa.gov/bim, p. 4
[12] VivekSah and Clark Cory, Building Information Modeling: An Academic Perspective, Proceedings of The 2008 IAJC-IJME International Conference ISBN 978-1-60643-379-9
[13] Nicholas Dierkes, EI, Brown and Caldwell, Construction management done spatially: GIS Integration into pipeline construction inspection and management
[14] Naai-Jung Shih and Pin- Hung Wang, Using GIS and Virtual Reality to Manage and Inspect Building Plumbing
[15] David McNell et al, BIM, infoComm international
[16] Mansour N. Jadid and Mobin M. Idrees, A Geographic Interactive Supply Chain Management System for Construction Projects, Proceedings of the World Congress on Engineering and Computer Science 2013 Vol IIWCECS 2013, 23-25 October 2013
[17] S. Azhar, M. Hein and B. Sketo (2008), Building Information Modelling: Benefits, Risks and Challenges, Proceedings of the 44th National conference, Auburn, Alabama, U. S. A
[18] George Berger, Change Orders – The Bane of All Construction Projects, ForConstructionPros. com, July 8, 2008
[19] National Building Information Modelling Initiative Volume 1: Strategy, buildingSMART Australasia, A report for the Department of Industry, Innovation, Science, Research and Tertiary Education, A strategy for the focussed adoption of building information modelling and related digital technologies and processes for the Australian built environment sector.


 (4 votes, average: 2.25 out of 5)


Leave your response!