| Applications | |
Geo-spatial big data analysis of Covid-19 spectrum envelope of first and second wave of the outbreak in the SE Asian region
This spreading of the spectrum caused marked variations in population mortality between different countries depending upon Covid-19 spectrum envelope characteristics with its spectrum peak height and width, existing healthcare infrastructure |
 |
|
 |
|
 |
|
 |
|
 |
|
Abstract
The outbreak of Covid-19 emerged from Wuhan, China during December 2019 and spread geo-spatially in more than 200 countries causing more than 182.969 million people of the global population infected and 3.963 million deaths ( as on 30 June 2021), which is still spreading in geo-spatiotemporal way with multiple peaks of Covid-19 spectrum. This has seriously threatened the human health and life of the people posing the challenges to control the severity due to multiple peaks of Covid-19 spectrum observed during the pandemic period.
The spatial spreading of covid-19 spectrum due to large-scale migration from Hubei province of China caused the outbreak in the Southeast Asian region covering the latitude between 38°N to 6°S. The Southeast Asian countries observed first and second wave of covid-19 spectrum with different spectrum envelope, which caused severe population mortality depending upon the spectrum pattern of the outbreak. This spreading of the spectrum caused marked variations in population mortality between different countries depending upon Covid-19 spectrum envelope characteristics with its spectrum peak height and width, existing healthcare infrastructure and its supply chain management of healthcare delivery systems of the country, which stressed the need for Covid-19 spectrum analysis of the first and second wave, and population mortality to develop predictive spectrum models of the third wave to determine the severity and population mortality.
In this paper, big-data predictive spectrum models of mortality have been developed based on the analysis of Covid-19 spectrum of the Southeast Asian region using spectrum envelope characteristics and population mortality data from 15 April 2020 to 30 June 2021, for predicting severity of third wave of Covid-19 outbreak, for countries that lie at the latitude beyond 38°N, which can be used by decision makers to design the lockdown measures and geo-spatial supply chain management of healthcare delivery system.
Introduction
The outbreak of the 2019 novel Corona virus disease (Covid-19) spread geospatially in more than 200 countries of the globe causing more than 182.969 million people of the global population infected and 3.963 million deaths ( as on 30 June 2021) from 26.016 million people infected and 0.931 million deaths (as on 30 August 2020).
The exponential increase in spreading of corona virus spectrum in spatiotemporal way to the new geographical locations has seriously threatened the human health and life of the people as well as posed the challenges for countries to control the severity of the outbreak (Corona virus, 2020). The spatial spreading of corona virus spectrum due to large-scale migration from Hubei province of China caused the outbreak in the Southeast Asian region covering the latitude between 38°N to 6°S. The first case of corona virus was reported in Thailand on 13 January 2020, which was followed by South Korea on 20 January 2020, and Vietnam and Taiwan on 22 January 2020 prior to reach Hong Kong and Singapore on 23 January 2020. Malaysia reported the first corona virus case on 25 January 2020, which further geo-spatially spread to Philippines on 30 January 2020 prior to reach Indian Sub-continent on 31 January 2020. National lockdowns were imposed by the respective governments of the Southeast Asian countries as measures to control the severity of the spectrum of the outbreak (BBC, 2020).
The Hong Kong, Vietnamese and South Korean governments imposed national lockdowns as measures to control the exponential rise of the spectrum of corona virus from 8, 13 and 20 February 2020 respectively, after 16, 22 and 31 days of the first reported corona virus case. The governments of Singapore, Malaysia, Philippines, Thailand, Taiwan and India imposed these measures from 6, 13, 15, 20, 24 and 25 March 2020 respectively, whereas, the Indonesian government imposed a national lockdown from 15 March 2020. The Myanmar government executed a national lockdown on 13 March 2020, prior to the arrival of first corona virus case on 27 March 2020 (BBC, 2020).
There are marked variations in the spectrum of daily new cases of corona virus between different countries situated at different latitudes below 64°N of the hemisphere (Corona virus, 2020). Spatial big data predictive analysis of daily new corona virus cases carried out for 28 countries that lie below the latitudes of 60°N including the Southeast Asian region, resulted into the development of predictive spectrum models for six different stages of the spectrum of the outbreak such as complete recoverable stage, recoverable stage, safe stage, stabilizing stage, critical stage and beyond the critical stage as knowledge classifier (Verma et al., 2020).
Higher population mortality from corona virus observed in northern latitude exhibiting the population mortality with decreasing north south gradient based on mortality data of 02 April 2020 (Panarese and Shahini, 2020). In Rhodes et al. (2020), population mortality from corona virus between different countries situated at latitudes below 64°N showed marked variations with relatively low population mortality at latitudes below 35°N based on mortality data of 15 April 2020. Spatial big data analysis on population mortality carried out for 28 countries based on mortality data from 15 April to 08 June 2020 supports lower population mortality for countries situated at latitudes between 35°N and 35°S (Verma et al.,2020).
The Southeast Asian countries observed first and second wave of Covid-19 spectrum with different spectrum envelope, which caused severe population mortality depending upon the spectrum pattern of the outbreak. This spreading of the spectrum caused marked variations in population mortality between different countries depending upon Covid-19 spectrum envelope characteristics with its spectrum peak height and width, existing healthcare infrastructure and its supply chain management of healthcare delivery systems of the country, which stressed the need for Covid-19 spectrum analysis of the first and second wave, and population mortality to develop predictive spectrum models of the third wave to determine the severity and population mortality. In this paper, bigdata predictive spectrum models of mortality have been developed based on the analysis of Covid-19 spectrum of the Southeast Asian region using spectrum envelope characteristics and population mortality data from 15 April 2020 to 30 June 2021, for predicting severity of third wave of Covid-19 outbreak, for countries that lie at the latitude beyond 38°N, which can be used by decision makers to design the lockdown measures and geo-spatial supply chain management of healthcare delivery system.
Spectrum models of different stages of the outbreak
The empirical spectrum models for predicting the trends of different stages of the outbreak have been for developed based on coefficients of predictive spectrum models of different countries based on 5 days moving average of daily new corona virus spectrum as knowledge classifier, such as Beyond the Critical Stage (Phase 5), Critical Stage (Phase 4), Stabilizing Stage (Phase 3), Safe Stage (Phase 2), Recoverable Stage (Phase 1), and Complete Recovery Stage (Phase 0). The polynomial spectrum models developed for predicting the trend of the spectrum for different stages of the outbreak is expressed as ( Verma A K et al, 2020):

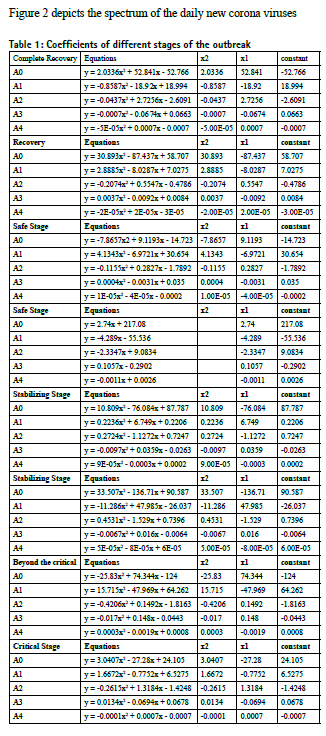
Figure 1(a) to 1(e) depicts the variation of the coefficients of spectrum models for different stages of the outbreak. It shows the different variations of the coefficients for different stages of the outbreak and helps in predicting the trends of the spectrum.

Spectrum of daily new corona virus for South East Asian countries
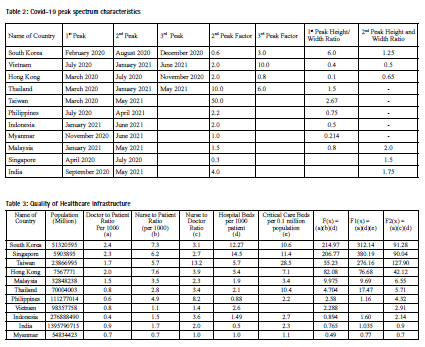
Figure 2 depicts the spectrum of the daily new corona viruses from 19 February 2020 to 19 June 2021 based on 5-days moving average. Figure 2 (a) shows three peaks of the spectrum for Hong Kong and Vietnam, and two peaks for Taiwan. In the case of Vietnam, the second peak factor was two times higher than the first peak and third peak was ten times higher than the second peak of the corona virus spectrum. Whereas Hong Kong shows second peak two times higher than the first peak of the spectrum and third peak was 0.8 times of the second peak. Further, the corona virus spectrum of Taiwan shows that second peak 50 times higher than the first peak. Figure 2 (b) shows the spectrum of corona virus for Myanmar and Malaysia with two peaks whereas Thailand shows three peaks of the spectrum during the same period. Further the spectrum of Thailand for the second peak was 10 times higher than the first peak and third peak was 6 times higher than the second peak of the spectrum. Whereas, the second peak of Malaysia and Myanmar shows 1.5 times and 1.0 times of the first peak respectively during the same period. Figure 2 (c) depicts the spectrum of South Korea with four peaks whereas Singapore with only two peaks of the spectrum. Further the third peak of the spectrum of South Korea shows three times of the second peak of the spectrum whereas fourth peak and second peak of the spectrum shows of lower peaks compared to the first and third peak respectively. Similarly, the spectrum of second peak of Singapore shows 0.3 times of the level of first peak which shows that the outbreak of the corona virus is controlled. Figure 2 (d) explains the spectrum of corona virus with two peaks for Indian sub continent where the second peak was four times higher than the first peak of the spectrum and number of daily new corona cases peak exponentially increased from 0.1 million to more than 0.4 million cases with sharp second peak spectrum. Figure 2 (e) explains the two peaks of corona virus spectrum for Philippines and Indonesia with second peak two times higher than the first peak. Table 2 depicts the events of different peaks and peak factors for Southeast Asian region.

Varability of healthcare infrastructure in Southeast Asian region
Critical illnesses due to Covid-19 knows no boundaries and affect all human beings as per the exponential and random pattern of the spectrum with multiples peaks, challenging the existing healthcare infrastructure of the countries to control the outbreak. Careful analysis of this diversity of the first and second wave of the corona virus spectrum allows a better understanding of the effect of different healthcare system on patient outcomes and the possible steps in evolving quality healthcare delivery system, which depends on the heterogeneous distribution wealth across Asia’s mix of low-, middle-, and high- income countries for the larger variability of healthcare system, which includes doctor to patient ratio, nurse to patient ratio, hospital beds and critical care beds based on population in south east Asian countries than that in continents like Europe. Out of 11 countries of Southeast Asian region, India, Indonesia, Myanmar and Philippines fall under low- and lower- middle income countries based on GDP per capita, current health expenditure per capita, current health expenditure as percentage of GDP, universal healthcare coverage service coverage index and human development index, compared to high income countries like Hong Kong, Singapore, South Korea and Taiwan, and upper-middle income countries like Malaysia and Thailand (Phua J. etal,2020). Table 3 explains the details of existing healthcare infrastructure of these countries. The quality of healthcare infrastructure is directly related to availability healthcare resource manpower such as doctors and nurses, as well as healthcare physical infrastructures such hospitals beds, critical care beds, medical equipments and supply chain management. These infrastructures plays a catalytic role to control the outbreak during the event of the pandemic like Covid-19, where, the spectrum of daily new Covid-19 cases and mortality depends on the quality of healthcare delivery system to provide lower mortality during the peak of the spectrum. Table-2 depicts the spectrum peak height and spectrum width ratio during first and second wave of Covid-19 and mortality spectrum during the same period further provides different ratio factor of peak height and width in determining the severity of the outbreak. Countries like India, Indonesia, Myanmar and Philippines, ratio factor of spectrum becomes critical around 0.1, whereas, countries like Hong Kong, Singapore, South Korea and Taiwan, this ratio factor of spectrum becomes critical after 2.0, but countries like Malaysia, Thailand reaches the same critical stage beyond the ratio factor 0.5 of spectrum. India is ill equipped medical infrastructure as most of the states of India struggled to make enough hospital beds and ICU’s available for patients. India has one of the worst records globally, when it comes to the number of beds, in comparison with population. According to Human Development Report 2020, India ranked 155th in the Index, and there are only 12 countries in the world that have even worse record, which includes Uganda, Senegal, Afghanistan, Burkina Faso, Nepal and Guatemala. Human Development Index is a measure of National health, education and standard of living. Further, 69 % of hospital beds in India are concentrated in urban area. India has abysmally low 0.5 beds per thousand population and mere 1.4 beds including public and private hospitals per 1000 population. The quality of the healthcare delivery depends upon the existing healthcare infrastructure of the country and Supply Chain Management of different components required to deliver the service. It has the direct linkage of the number of doctors, number of nurses, hospital bed infrastructure as well as critical care infrastructure existing in the country covering the rural and urban area of the country. Based on the analysis of the above factors, the quality of healthcare delivery system is a function of multiplicative function of number of doctors, number of nurses and hospital infrastructure per 1000 populating of the country. Table 3 depicts the existing healthcare infrastructure for South East Asian countries. Further this table describes the function f1, f2, f3 which shows that the best healthcare infrastructure is existing in South Korea, Singapore, Hong Kong and Taiwan whereas adequate infrastructure is available in Malaysia, Thailand, Philippines and Vietnam but India, Myanmar and Indonesia lacks in the adequate healthcare infrastructure as per the WHO recommendations.
Table 2 explains the spectrum peak height and spectrum width ratio based on the data of daily new corona virus spectrum as depicted in Figure 2. This shows that the quality of healthcare infrastructure plays an important role in controlling the outbreak which is evident from the spectrum peak highest and peak width ratio described in the table for South East Asian countries. It shows that if the spectrum peak height and peak width ratio is more than 0.5 then the impact of mortality will be higher. However the countries having nonadequate healthcare infrastructure, this peak height and peak width ratio is effective from 0.1. Table 3 further shows that the mortality the country having quality healthcare infrastructure is able to control the outbreak and mortality during the sharp rise of the spectrum of 1st and 2nd peak with more than 2.0 spectrum peak height to width ratio.
Variation of mortality spectrum for Southeast Asian region
Figure 3 depicts the spectrum of mortality between two consecutive dates based on the population mortality data from 15 April 2020 to 30 June 2021. Figure 3 explains the spectrum of mortalities for Hong Kong, Vietnam and Taiwan which shows that mortality increases exponentially with the increase of daily new corona virus cases. But decreases slowly with the decrease of daily new corona virus spectrum and takes time to control the mortality. Further Taiwan shows very sharp rise of mortality with a sharp peak of the corona virus spectrum. Whereas Vietnam show the control mortality by the measures taken to control the outbreak. Figure 3 depicts the variation of mortality which increases sharply with the increase of daily new corona virus spectrum but decreases slowly even after the control of new corona virus cases. Figure 3 explains the similar rise of the mortality spectrum for Philippines and Indonesia, which increases sharply with the peak of the new corona virus spectrum. Figure 3 shows the mortality spectrum of South Korea and Singapore whereas the mortality during the third peak of the spectrum of South Korea shows sharp increase in the mortality but Singapore spectrum confirms to control the outbreak after the first peak of new corona virus spectrum. Figure 3 shows the mortality spectrum for Indian sub-continent shows a sharp rise in the mortality during first and second peak of the daily new corona virus spectrum whereas the mortality decreases very slowly with the decrease of the new corona virus spectrum of the first and second peak. This confirms that the slow decrease of the mortality spectrum is due to inadequate health care infrastructure as shown in Table 2. Further Indonesia, Philippines the decrease of the mortality slope shows slow decrease with the decrease of the first peak of the spectrum of new corona virus cases.

Impact of latitude on population mortality
Higher population mortality from Covid-19 observed in Northern Latitude with highest in Italy and exhibiting the population mortality with decreasing north south gradient based on mortality data of 02 April 2020 for 108 countries (Jonathan M.R. et al, 2020). Northern latitudes are associated with vitamin D deficiency for higher population mortality due to low ultraviolet exposure in the northern countries. When population mortality plotted against the Latitude for 130 countries based on mortality data of 15 April 2020 showed marked variation in mortality between different countries that lie below the latitude of 64°N of the hemisphere ( Panarese A. and Shahini E., 2020). People do not receive adequate sunlight to maintain vitamin D levels during winter in countries situated beyond the latitude of 35°N. All countries that lie below the Latitude of 35°N showed relatively low population mortality with the correlation coefficient of 0.53 between mortality and Latitudes (Jonathan M.R. et al, 2020; Panarese A. and Shahini E., 2020). Relatively low population mortality from Covid-19 observed for countries situated at Latitudes between 38°N and 35°S based on population mortality from 15 April to 08 June 2020 for 28 countries and 15 April to 15 August 2020 for 52 countries that lie below the Latitude 60°N (Verma A.K. et al, 2020; Verma A.K. et al, 2020), which confirms to higher correlations due to continuance of multiple peaks for countries at the same Latitudes during these periods with increased population mortality.
Population mortality for the Southeast Asian region
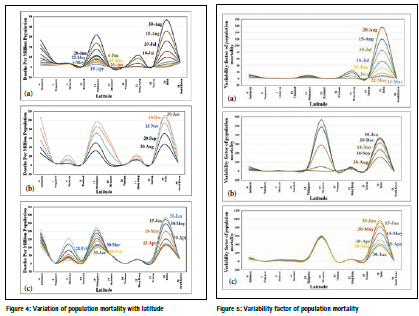
Figure 4 depicts the variation of population mortality from Covid-19 for 11 countries of the Southeast Asian region that lie between latitudes 38°N and 6°S based on population mortality data from 15 April 2020 to 30 June 2021. There are significant variations in population mortality for Malaysia, Myanmar, Hong Kong, whereas other countries showed nonsignificant variations in population mortality. Further, a sudden rise of population mortality observed for Myanmar and Hong Kong during 20 January to 30 June 2021, in addition to the continuance of the rise of population mortality for Indonesia, Philippines, Malaysia and India in the Southeast Asian region. Figure 5 (a) shows the variation of variability factor of population mortality from 13 May to 15 August 2020 with respect to population mortality on 15 April 2020. It shows maximum variations of variability factor of population mortality for India in the Southeast Asian region, whereas other countries show non-significant variations. Figure 5(b) shows sudden rise of variability factor of population mortality for Malaysia, Myanmar, Hong Kong and Taiwan during 30 September 2020 to 20 January 2021. 5(c) shows sudden rise of variability factor of population mortality for Myanmar and India during 20 January to 30 June 2021, whereas, other countries stabilizes to control the outbreak.
Conclusion
This present study describes the effect of spectrum peak and width ratio on the mortalities, which depends on the quality of healthcare infrastructure of Southeast Asian countries. This present study of spatial big data analysis of population mortality, mortality between two consecutive dates and variation of population mortality provides the clear picture of the severity of the outbreak for countries that lie between the latitudes 38°N and 6°S. The impact of spectrum pulse height and width ratio is very important for assessing the vulnerability of the outbreak. The ratio factor of 0.1 decides the severity for the countries like India, Myanmar, Indonesia, whereas, the ratio factor of more than 2.0 can be considered as safe factor for countries like Singapore, Hong Kong, South Korea. In order to predict the severity in terms of mortality for the third wave of corona virus, the same ratio factor of spectrum peak height and width ratio cannot be considered, because it varies from 0.1 to 2.0 depending on the existing health care delivery system of the countries in the Southeast Asian region.
References
1. BBC, 2020. Coronavirus: The world in lockdown in maps & charts/ Source: Oxford Covid-19 Government Response Tracker /BBC Research, Available online at: https:// www. bbc.com/news/world-52103747 (Last access date: 10 July 2020).
2. Coronavirus, 2020. Global Covid-19 Data for All Countries, Available online at: https://www. worldmeters.info/coronavirus (Last access date: 10 July 2020).
3. Chenghu Z., Fenzhen S., Tao P., Zhang A., Yunyan D., Bin L., Zhidong C. , Juanle W., Wan Y., Yunqiang Z., Ci S., Jiechen J.X. , Li F., Ma T., Lili J., Fugqin Y., Jiewei Y., Yunfeng H., and Yilan L., 2020. Covid-19: Challenges to GIS and Big Data”, Geography Sustainability, 1, pp 77-87.
4. Jonathan M.R., Sreedar S., Eamon L. and Rose A.K., 2020. Low population mortality from COVID-19 in countries south of latitude 35 degree north supports vitamin D as a factor determining severity, Aliment. Pharm. Therap., 51, pp 1438-1439.
5. Panarese A. and Shahini E., 2020. Covid-19 and Vitamin D, Aliment. Pharm. Therap., 51, 2020, pp 993-995.
6. Phua J., Kulkarni A.P., Redjeki I.S., Mendsaikhan N., Sann K.K., Shrestha B.R., Palo J.E.M., Hashemian S.M.R., Nor, Patjanasoontorn B., Ling L., Bahrani M.J.L., Lim C., 2020. Critical Care Bed Capacity in Asian Countries and Regions, Critical Care Medicine Journal, Vol xx, January 2020, pp 1 – 9.
7. Verma A. K., Verma Aditi & Verma Anjul, 2020. Coronavirus Spatial Big Data Predictive Analysis for the Southeast Asian Region, Defence Science & Technology Technical Bulletin, Ministry of Defence, Malaysia, 12 , 2, pp 344- 366.
8. Verma A. K., Verma Anjul and Verma Aditi, 2020. Covid-19 Geo-Spatial Big Data Analysis of Population Mortality for Countries Situated at Latitudes between 64°N and 35°S. 41st Asian Conference on Remote Sensing (ACRS 2020), Organised by Asian Association of Remote Sensing (AARS), 09-11 November 2020, Deqing, China.
The paper was presented at 42nd Asian Conference on Remote Sensing (ACRS2021), 22-24 November 2021, Can Tho University, Can Tho, Viet Nam organized by Asian Association of Remote Sensing (AARS), Japan


 (1 votes, average: 4.00 out of 5)


Leave your response!