| Disaster Management | |
Evaluation of landslide hazard of Kohima, India
The present study is an attempt to generate a landslide hazard zonation map of Kohima through quantitative method in GIS environment. Kohima, the capital of Nagaland is located the Inner Fold Belt which is geologically unstable |
 |
|
 |
|
Landslide comprises almost all the varieties of mass movements on slopes, rock falls, topples and debris flow that involve little or no sliding (Varnes and IAEG, 1984). Landslides are considered as a major natural geologic hazard occurring throughout the World. Landslide triggers instability to the land which disrupts the water pipe lines, road linkages, buildings as well as loss of human lives. Landslides are inevitable and quite common in tectonically active mountain chain where they annually recur during monsoonal events (Aier et al., 2012). Landslides are also increasing due to development activities because of increasing population, urbanisation, and infrastructural development. Identification and zonation of areas prone to landslide has therefore, become crucial to prevent and safeguard physical properties and human lives. Zonation of the land applies to division of the land surface into areas and the ranking of these areas according to degree of actual or potential hazard from landslides or other mass movements on slopes (Varnes and IAEG, 1984).
Identification of area susceptible to landslide is crucial since urbanisation is increasing with time. The spatial information related to the causative factor for landslide can be derived from remote sensing and geographical information system (GIS) techniques. GIS a powerful tool for integrating different data type has made some significant development especially in spatial data analysis (Rawat et al., 2015). High resolution satellite images (Quick Bird 2 and World View 2) have been used to delineate the areas affected by landslide and has been processed in GIS environment to bring out the hazard map. Landslide hazard map divides the landslide prone hilly terrain into different zones according to the relative degree of susceptibility to landslide (Marrapu and Jakka, 2014). LHZ provides information on the susceptibility of the terrain to slope failures and can be used for the estimation of the loss of soil due to slope failures, new construction sites and road alignment, for prevention, evacuation and mitigation processes (Talib and Napiah, 2000). LHZ techniques are classed into direct and indirect methods. Direct method involves the geomorphologist experience and terrain condition knowledge which directly determines the landslide susceptibility. In indirect method, statistical models or deterministic models are used to predict landslide prone areas based on information obtained from interrelationship between landslide conditioning factors and landslide distribution (Van Westen et al., 2003). Kohima, the capital of Nagaland located in the North-eastern part of India is situated in a tectonically active zone. The region comprises the intermediate hills of the Inner fold belt lying north of the Kohima Synclinorium and east of the belt of Schuppen and Patkai Synclinorium (Aier et al., 2012). Geologically unstable along with torrential rainfall in monsoon season has a huge impact on the distribution of landslides in Nagaland particularly, Kohima.
Study Area
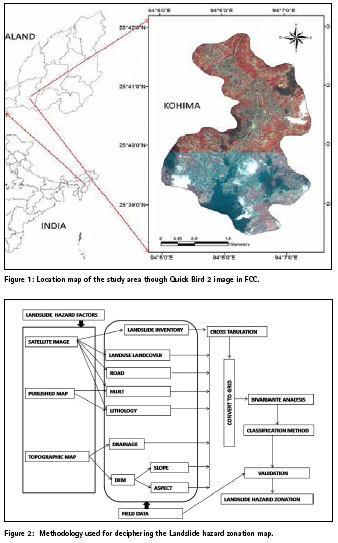
The study area- Kohima, capital of Nagaland is situated on the Inner Fold Belt characterised by Disang and Barail group of rocks, north of the Kohima Synclinorium (Srivastava and Pandey, 2011). The geographical extent of the study area lies between 94˚05’04’’ E and 94˚07’23’’E latitudes and 25˚38’28’’N and 25˚39’24’’N longitudes respectively covering an area of 14.03 km2 (Figure1). The study area consists of 19 town wards and the peripheral areas of the ward.
Kohima is located at an elevation between 800 to 1500 m above mean sea level. Annual temperature is moderate ranging from 5˚C in winter to 30˚C in the summer. In 2015, Kohima experiences annual rainfall about 1521.3 mm with 149 numbers of rainy days, precipitation is maximum in the month of June to August where maximum rainfall was observed in august with monthly rainfall of 374.1 mm.in 2015. Tectonically, it is unstable as it forms part of the Eastern Himalayas and also it lies in the seismic zone V which is liable to seismic intensity IX (Khatsu and Van Westen, 2004).
The process of urbanisation is progressing rapidly where population has increased from 77,030 in 2001 to 99,039 in 2011 according to Census report 2011. The population density of the study area is 7059 persons per km2 displaying a high density populated area (Figure 5(a)). The geographical growth of Kohima is increasing vertically as well as horizontally. The limitation of available land for constructing buildings has compelled the citizens to expand vertically despite the fact that it is geologically unstable.
Database and methodology
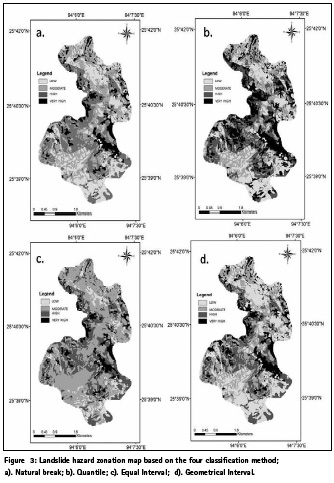
The main objective was to generate a landslide hazard zonation map. Thematic layers was generated from high resolution images for landuse landcover, road, landslide and also for fault and lithology, topographical maps was used for generating drainage layer and DEM to create aspect and slope maps, published maps were consulted for fault mapping and lithology mapping. The method chosen for delineating the landslide hazard zonation was based on statistical analysis viz- Information value method (IVM). The steps followed in the methodology are shown (Figure 2). The various thematic layers was generated in GIS based platform and crossed with landslide layer to generate cross tabulated weighted layers. The crossed layers were combined and classified by various classification methods. The classified methods used were natural break, quantile, equal interval and geometrical interval. The classified maps were crossed examined and validated using relative landslide density (R). The best classified method was considered for generating the landslide hazard map.
Bivariate statistical analysis
Data driven approach (statistical approach) has gain much popularity in the recent years because of its better subjectivity and more reproducible results. Statistical analysis is divided into two groupsbivariante and multi-variante statistical analysis respectively (Pardeshi et al., 2013). The main concept of bivariante is to determine the relationship between spatial landslide distribution and landslide controlling factors (Guzetti et al., 1999). Information value method is an important bivariante statistical method used in LHZ mapping. Potentiality of landslide hazard is based on the various causative factors and the relationship between them which triggers the slope instability (Sarkar et al., 2013). One of the simple and effective data driven statistical analysis for landslide study is IVM.
Information value method
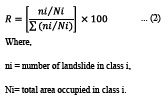
IVM developed by Yin and Yan (1998) is used to calculate the weight for each class of factor layer by ratioing-landslide density of each class to the landslide density of the total area. Equation of IVM is as follows; …
Relative landslide density (R)
R index is an indication for goodness of fit and is derived from the ratio of percentage of total landslide area in
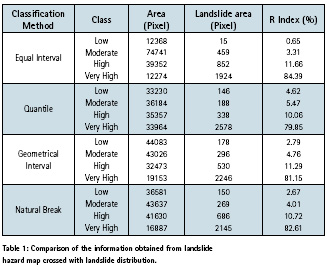
R index calculated from the study area is shown in Table 1. The index shows an increase in the number of landslides with each landslide classes as it progresses in all the classification methods. Equal interval has the highest index with 84.39% in very high class and the lowest index with 0.65% in low class. Quantile has the highest index in very high class with 79.85% and low class with 4.62%. Geometrical interval has very high class with an index of 81.15% and in low class with an index of 2.79%. Natural break has an index of 82.61% in very high class and in low class an index of 2.67% was obtained.
Result and discussions
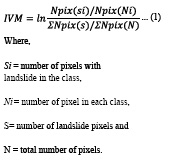
The hazard map generated from IVM was divided into various class based on mathematical method for data classification method based on GIS platform. The landslide map derived from IVM crossed with landslide distribution using different classification methods to generate their respective R index is shown in Table 1. The results of the four classification methods (natural break, equal interval, quantile and geometrical interval methods) used for deciphering landslide information is shown in Figure 3.
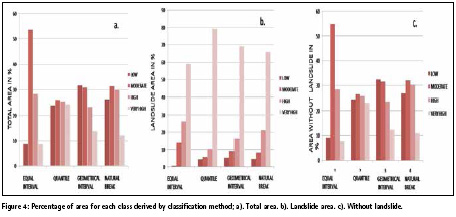
Figure 4 shows the percentage statistics of area in each class derived from the classification method. Equal interval has high value (59.2%) for very high susceptibility class but very low value for low susceptible class (0.46%) in landslide area which is not proportional, hence, it cannot be considered for LHZ. Quantile has high value (79.32%) in very high landslide class but the values are similar in proportion in total area, hence, it cannot be considered. Geometrical interval has high slide value (69.11%) in very high susceptible class and low value (5.48) in low susceptible class. The slide area in high and very high landslide classes in the geometrical interval is 85.42%. The value of R index in Geometrical interval increases as the landslide susceptibility class increases. Natural break has high value 66%) in very high landslide susceptible class and low value (4.62%) in low susceptible class.
The slide area in high and very high classes in Natural break is 87.11%. The value of R index also increases as the landslide susceptibility class increase. Highest R index is shown by equal interval (84.39%). However, for considering classification methods, since the classification is based on landslide distribution, landslide information is more important. Both geometrical interval and natural interval are in proportion with the landslide susceptibility distribution. Natural break, however, has more R Index value (82.61%) in very high landslide susceptible class and higher value in high and very high classes in slide percentage area as compared to geometrical interval. It is therefore, considered for generating the landslide hazard zonation (Figure 6).
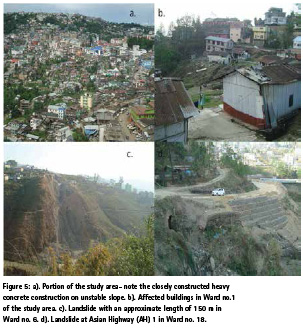
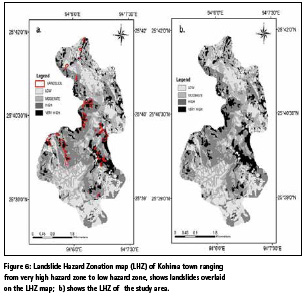
After cross validation of the classification methods with R index, the final landslide hazard map was prepared and categorized into low, moderate, high and very high hazard zones (Figure 6). The zone categorized into very high zone is highly unstable because of steep topography, where landslide is frequent during the monsoon season. The zone also occurs near tectonically weak zone and fault areas which cause landslide annually (Figure 5 (c) and 5 (d)). The zone is prevalent in the central western and central eastern part of the study area. It constitutes about an area of 1.68 km2 forming 12% of the study area. High hazard zone is observed around the periphery of very high hazard zone. This zones are characterised by steep slopes which when disturbed can be susceptible to landslide. This zone occupies 30% constituting 4.21 km2 of the study area. Precaution if not taken to check house construction, construction of retention walls can trigger landslide after heavy rainfall in high hazard zone. Moderate hazard zone is observed in the vegetated area and areas away from the drainage. The zone constitutes 32% with an area of 4.49 km2 in the study area. Low hazard zone is observed in areas where the slope is gentle observed in northern part of the study area or in well vegetated area observed towards the southern part of the study area which is located near the Reserve forest in Kohima. The low hazard zone forms 26% which is about 3.65 km2 of the study area.
Slow creeping movement is observed in Ward 1 of the study area (Figure 5(b)). This particular area falls under Disang shales which is geologically a weak formation. The soil gets easily absorbed by rainfall causing more subsidence and creeping movement. The weak geological structural settings, heavy rainfall along with vehicular movement has caused landslide in Ward 18 (Figure 5(d)). This particular stretch of road is constantly paralysed owing to landslide almost every year. The area falls under very high hazard zone where the landslide is caused mainly due to geological structural failure as fault line passes though this area (Aier et al., 2011). The unfavourable geological settings coupled with heavy rainfall caused landslide in the study area. One of such landslide is shown in figure 5(c) which is in an army cantonment near the helipad. The steep slope along with little vegetation cover has exposed the land to slides and erosion.
Conclusion
The geologic formation in the study area is very weak been made up of crumpled and weathered shale’s (composed of Disang shales). Barail sandstone formation passes through a thin stretch of the study area towards the south western part of the study area which falls under low hazard zone. 䡔he occurrence of landslide is further triggered with anthropogenic activities particularly by building constructions which are built without any regulations. The scarcity of land has pressured the citizens to vertically expand their construction, further aggravating the danger of a catastrophic event in case of a seismic activity.
Landslides are diverse and their type varies from region to region with certain specific conditions. Hence, determination of landslide hazard zone is difficult depending on various attribute parameters as well as the type of model used. In this study, the statistical model used was Information value method for demarcating the landslide hazard zone. The application of high resolution image has increased the efficiency of the study. The generation of the thematic data’s using high resolution data has improved in better delineating the features. The use of various classification method and R index technique has improved the output by removing the insignificant variants.
The technique used in the study will however vary since the conditions will differ. The landslide hazard map was into four zone- low, moderate, high and very high landslide hazard zones respectively. The very high hazard zones was located mainly in the weak geologically settings. These zones should be avoided as they are unsuitable due to weak geologically unstable area and slope failure occurs in these places once it is triggered by rainfall. Anthropogenic activities should therefore be discouraged in this zone. Various scheme like afforestation and construction of retaining wall should be undertaken to minimise the slope failures. Since, the area being on very high hazard zone mismanagement will not only disrupt but also affect the other safer zone since the study area falls under high tectonic active area.
The use of R index and field evidence validates the hazard zonation map and makes the map correlate with the actual ground condition. The landslide hazard zonation map will help the planners to utilise and manage the area in the best suitable manner. The areas susceptible to landslide should be avoided and care must be taken to avoid this areas. If at all the land has to be utilised it should be properly supervised and care should be taken to prevent slides. The quality of the landslide hazard map can be further improved by incorporating more causative factors. Any change in the present landscape caused by human activities may change the landslide hazard zonation map. The map should be periodically updated to keep in line with the existing landscape scenario.
References
Aier I., Singh M.P., Thong, G.T. and Ibotombi, S., 2012. Instability analyses of Merhülietsa slide, Kohima, Nagaland. Natural Hazards, 60, pp. 1347-1363.
Guzzetti, F., Carrara, A.Cardinali, M. And Reihenbach, P., 1999. Landslide hazard evaluation: a review of current techniques and their application in a multi-scale study, Central Italy. Geomorphology, 31, pp. 181-216.
Khatsu, P. And Van Westen, C.J., 2005. Urban multi-hazard risk analysis using GIS and remote sensing: A case study from Kohima town, Nagaland, India.In: Proceeding of ACRS, Hanoi, Vietnam, pp. 1-9. Marrapu, B.M. and Jakka, R.S., 2014. Landslide hazard zonation methods: A critical review. International journal of civil Engineering research, 5(2), pp.215-220.
Pardeshi, S.D., Autade, S.E. and Pardeshi, S.S., 2013. Landslide hazard assessment: recent trends and techniques. Springer Plus 2 (523), pp. 1-11.
Rawat, M.S., Uniyal, D.P., Dobhal, R., Joshi, V., Rawat, B.S., Bartwal, A., Singh, D. And Aswal, A., 2015. Study of landslide hazard zonation in Mandakini valley, Rudrapayag district, Uttarakhand using remote sensing and GIS. Current Science, 109 (1), pp. 158-170.
Srivastava, S.K. and Pandey, N., 2011. Search for provenance of Oligocene Barail Sandstones in and around Jotsoma, Kohima, Nagaland. Journal of Geological Society of India, 77, pp. 433-442.
Sarkar, S., Roy, A.K. and Martha, T.R., 2013. Landslide susceptibility assessment using Information Value method in parts of the Darjeeling Himalayas. Journal society of India. 82, pp. 351-362.
Talib, J.A. and Napiah, A., 2000. Landslide hazard zonation mapping using remote sensing and GIS techniques. Geological society of Malaysia Bulletin, 44, pp. 101-107.
Van Westen C.J., Rengers, N. And Soeters, R., 2003. Use of Geomorphological Information in Indirect Landslide Susceptibility Assessment. Natural Hazards, 30, pp.399-419.
Varnes D. J. and the International Association of Engineering Geology Commission of Landslides and the Mass Movements on Slopes, 1984. Landslide hazard zonation: a review of principles and practice . UNESCO, Paris, pp. 1-63
Yin, K.L. and Yan, T.Z., 1998. Statistical Prediction model for slope stability of metamorphosed rocks. In: Proceedings of the 5th International Symposium on landslides, Lausanne, Netherland, 2, pp. 1269-1272.


 (No Ratings Yet)


Leave your response!