| Applications | |
Clustering of Geo-tectonics using GNSS data
If comparisons are made between the newly defined dynamic geo-tectonic map and the existing geo-tectonic and fault maps, the new image map shows much better relations with the distribution of earthquakes |
 |
|
 |
|
The existing geo-tectonic map of Japan has been produced by geological survey, rock classification, historical geological processes, faults etc. by expert geologists, geo-scientists, geographers and others. However, each geo-tectonic map may differ depending on by whom they were compiled. Dynamic changes in the three dimensional coordinates of GNSS data provide information about crustal movements of the earth, which could be classified into homogeneous crustal units. Since the authors assumed that such homogeneous units should be significantly related to the geotectonic maps or the distribution of large earthquakes, a clustering technique has been applied to weekly averaged GNSS data of about 1,000 Continuing Observing Reference Stations (CORSs) all over Japan for the year of 2016. Astonishingly the clustering map determined from the GNSS data shows geo-tectonic structure which is highly correlated with the distribution of past large earthquakes.
Why clustering of geotectonics with GNSS data needed?
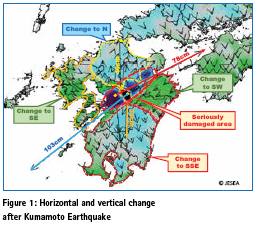
The reason for referring to the year of 2016 in this paper is that a large earthquake, namely “Kumamoto Earthquake”, occurred in Kumamoto Prefecture, Kyushu Island, Japan on the 16th April 2016 with M7.3 and Japanese seismic intensity level 7 (the maximum intensity). The quake created drastic horizontal as well as vertical changes in Kyushu Island (see Figure 1). The arrows show horizontal change in the green, yellow and red shaded areas as rising while light blue colors show sinking just after the earthquake. Looking at the figure carefully, certain areas move in similar directions while others in different directions as shown by the colored dotted lines in the figure. This behavior indicates that large areas consist of groups of different units of dynamic geo-tectonic structure. The authors have recognized that the geo-tectonic map should be based on geo-dynamism rather than static geological characteristics.
GNSS data and the clustering method used
GNSS data of the weekly average of X, Y and Z coordinates in a geo-centric coordinate system at 1,037 CORSs in the year of 2016 (52 weeks) were selected for the clustering analysis. Those GNSS data can be downloaded free of charge from the homepage of Geo-spatial Information Authority (GSI), Japanese Government. In this research all software selected is open source, such as Ubuntu Linux, QGIS, R, Cloud Compare, Libre Office etc. Before applying the clustering method, we checked data characteristics such as variance and co-variance, principal components, correlation matrix and so on for the purpose of avoiding extremely abnormal points. A clustering method called “k-medoids” has been selected instead of “k-means” as it is more robust against large errors when included in clustering. The clustering of “k-medoids” can be chosen from the open source software for statistical analysis “R”.
Clustering of GNSS data
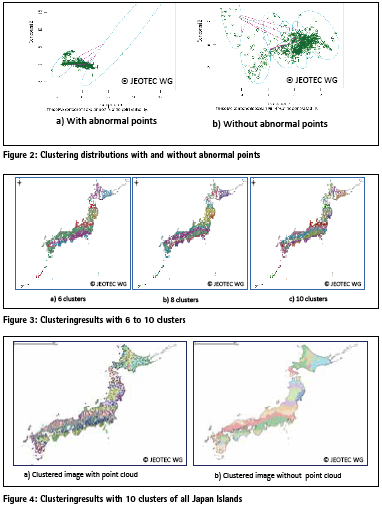
The clustering has been applied to the domain of the first and the second principal components, which comprise a cumulative proportion of 96.7% of the variability of the data. Initially we classified the data into 6 clusters in the domain of principal components of all Japan Islands as shown in the left side of Figure 2, which revealed unusual distributions due to some extremely abnormal values. Then we tried clustering again without those extremely abnormal points in the same area, resulting in much better clustering distributions as shown in Figure 2(b) which comprised 98.1% cumulative variability.
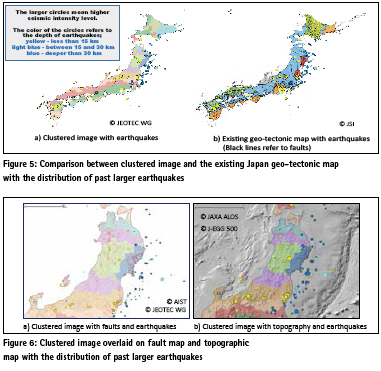
The number of clusters selected in the clustering method should be compared with the existing geo-tectonic map with limited geo-tectonic classes. We tested from 6 to 10 clusters of all Japan Islands, out of which three cases of 6, 8 and 10 clusters are shown in Figure 3 in which the different colors mean different clusters. The authors judged that 10 clusters would be reasonable to compare with the existing geo-tectonic map.
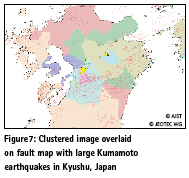
For the purpose of comparison with the existing geo-tectonic map, the point cloud clustering map has been interpolated into a smooth image as shown in Figure 4 using a simple method of nearest neighbor to ensure quantitative repeatability can be guaranteed by other scientists.
Comparison of new geotectonic map with the existing geo-scientific map
It would be meaningless if a new geotectonic map were produced without scientific definitions that are comparable with existing scientific terminology.
Firstly we have compared the clustered image with the existing geo-tectonic map with major faults as recorded in a Japanese national atlas, with the distribution of past earthquakes larger than Japanese seismic intensity level 5 as shown in Figure 5. In the figure, the larger circles mean higher seismic intensity level, while color refers to the depth of earthquakes; yellow means less than 15 km, light blue between 15 and 30 km and blue deeper than 30 km.
The following observations have been obtained.
▪ Though some similarities are recognized in the two geo-tectonic maps, many parts are completely different. For example, the blue color zone in the existing map dominates central and northern Japan, but the newly clustered image map does not show such a dominant zone.
▪ Regarding the locations of earthquakes in the two maps, most that occurred inland are located near a boundary between two different clusters. However in the case of the existing geo-tectonic map, a strong relation between the location of earthquakes and the color zones or faults is not found, although some earthquakes occurred around congested fault areas.
For a more detailed comparison, an enlarged area in north east Japan was selected showing detailed faults produced by National Institute of Advanced Science and Technology (AIST) and topography to check the relation between the clustered image map with the distribution of larger earthquakes, as shown in Figure 6 in which light red color lines refer to faults. The left hand map shows more clearly the relationship with the distribution of faults. The right hand side map is better for observing the topographic effect.
The following observations have been obtained.
▪ There are no significant relationships between the locations of faults and larger earthquakes, although there is a much higher relationship between the location of geo-tectonic boundaries and earthquakes.
▪ Concerning the relationship between the topography and earthquakes, we can say only that most earthquakes did not occur in the flat plains but in hilly or mountainous areas. There is not a significant relationship between geo-tectonic zones and topography.
Finally the clustered image map is overlaid on the fault map in Figure 7 together with the distribution of the large Kumamoto Earthquakes which occurred in April 2016 including many aftershocks. The depth of Kumamoto Earthquakes was very shallow at about10 km (yellow circles) which caused tremendous damage. Regarding the location of Kumamoto Earthquakes and faults, a belt of earthquakes is located much further north than the major fault belt zone. On the other hand, the distribution of Kumamoto Earthquakes is located near the boundaries between different clusters.
Conclusions
The variations of XYZ data derived by the GNSS CORSs during 2016 showed very interesting similarities in the clustered unit zones, which may be recognized as dynamic geo-tectonics. The clustering of geo-tectonics based on GNSS data derived from the CORSs should be evaluated because the map derived is quantitative as well as repeatable. By contrast, the conventional geo-tectonic maps and geological maps have depended on experience and subjective judgement of geo-scientists.
If comparisons are made between the newly defined dynamic geo-tectonic map and the existing geo-tectonic and fault maps, the new image map shows much better relations with the distribution of earthquakes. It means that the dynamic geo-tectonic map would be much more useful for the prediction of earthquakes, as more than 70% of larger inland earthquakes occurred near the boundaries of the different clusters.
Acknowledgement
The authors appreciate Japan Association of Remote Sensing (JARS), Japan Earthquake Science Exploration Agency Co. Ltd. (JESEA) and Aero Asahi Co. Ltd. for their warm support of the research. The authors also thank Prof. John Trinder for his kind editing of the English paper.
References
MURAI, S. and ARAKI, H: The prediction of Validation of Kumamoto Earthquake, Volume XII, Coordinates, July Issue 2016
MURAI, S. and TESHIMA, S: Development of advanced earthquake prediction method using artificial intelligence, Volume XIV, Issue 3, March 2018


 (No Ratings Yet)


Leave your response!