| Applications | |
An automated method for street floor detection
In present study an automated method for detection of street floor using the Terrestrial Laser Scanner (TLS) point cloud dataset has been proposed |
 |
|
 |
|
 |
|
Roads are the crucial geospatial feature and play vital role in national development and growth. They are the major component of nation infrastructure and economy of nation is also dependent at them. Therefore, modeling, management planning and condition assessment of road network are the major field of concern. Geographical Information System (GIS) with various surveying techniques is generally used in order to carry out these tasks.
Several traditional methods like ground surveying, Global Positioning System (GPS), photogrammetry and Distance Measurement Instruments (DMI) can be used but they are time consuming, labour intensive and costly. To overcome these complexities, Light Detection and Ranging (LiDAR) can be used. There are different platforms associated with it namely terrestrial, airborne and space borne (satellites). LiDAR is a remote sensing device which measures range and scan angle of the target by analyzing the amplitude and orientation of reflected light.
A very viable and efficient survey method to evaluate road surface along with its parameters is a Terrestrial Laser Scanner (TLS). There is a rapid growth in the utilization of TLS systems in many road corridor applications. This increase is due to the continuous development in terms of data capture speed, accuracy and density of point data obtained from these systems. These systems capture huge point clouds that describe very highly detailed road scenes. It also supports survey on demand by extracting desired features and attributes from the point cloud, removing the need to return to the field for measurements. Various benefits of using TLS are lower safety risks associated, day or night data collection, very high point density, fast collection rates, reduced time usage, provision for linking additional sensors, high resolution capabilities, reduced number of field visits (collect once, use many times), multiple end users and opportunities to share data. An inherent feature of LiDAR data is that it is acquired, processed and delivered in a digital format, making it very easy to work with and to create data products that meet a wide range of needs. Some of the drawbacks associated with TLS are that the initial setup cost is high, points require processing to be classified which is generally a semi-automatic process, skilled workers are required, and data acquired can be cumbersome.
The difficulties in automating the detection of road features comes from the complexity of the scene, unorganized nature of the point data, no prior information of the position and orientation of the road features and combination of multiple data sources. These data sources are the position and orientation data from the navigation sensors and the point cloud data from the laser scanning sensor.
Extraction of the road surface using the TLS data was the area of interest of many researchers, various techniques, algorithms and methods were proposed by them. Tsai, et al. 2013 [1] was proposed a method to measure cross slope using terrestrial LiDAR. After LiDAR calibration and data acquisition, Region of Interest Interval (ROI) extraction was performed on the collected LiDAR point cloud to extract the rectangular region within a single lane between the pavement markings. Individual cross slope measurement was conducted within each ROI. All of the cross slope measurements were computed in the tested road section, each measurement from the corresponding ROI was represented by a single geo-referenced point. Since the cross slope was computed based on the regression result of the LiDAR point’s elevation, there was a trade-off in selecting the ROI interval. Photobus for the fast acquisition of road geometry with a real-time data quality control for Advanced Driver Assistance Systems (ADAS) was used by Gontran, et al. 2005 [2]. It provides early warning and lateral control of the vehicle which coupled with Radio Direction and Ranging (RADAR) and a Variable Message Signal (VMS) to prompt a driver with reducing speed was also used. Thuy and Puente 2010 [3] was devised a method for lane detection and tracking based on LiDAR data. The registration of the measured LiDAR points with regard to time and space was done by calibrating the onboard sensors with respect to the ego-car. The obtained egoposition was transformed into Universal Transverse Mercator (UTM) coordinates. A binarisation was performed to distinguish and improve the contrast between road surface and lane markings for pre-detection of lane. For better lane detection, Canny filter was applied. For individual lane detection two vertical detection windows within the map was defined, having m rows and n columns. If the number of white pixels exceeds a velocity-dependent threshold, lane detection was assumed. A clothoid road model was applied to track the lane, least square method or extended Kalman filtering can be used. Wang, et al. 2014 [4] was presented an automatic approach for the delineation of both the direct environment of a road and the road itself into local catchments starting from a Laser Mobile Mapping System (LMMS) point cloud to estimate the road runoff. A uniform voxel size was selected for downsampling procedure as the point cloud density was very high. Surface normal was estimated during the iterative filtering of the road points. Then the largest one dimensional (1D) slope in one of the eight adjacent directions was selected to obtain the first approximation of the two dimensional (2D) slope in the regular grid defined. An algorithm was used for segmenting the roadsides points. Using the D8 algorithm, the primary flow direction was determined by selecting the direction to the neighbor having maximal 2D gradient for each of the query point present in the grid. In the succeeding steps, the flow was followed. All flow terminates at the pixels in the bottom row. An effective path detection and tracking method was designed by Lee and Cho 2009 [5]. The designed procedure consists of four main processes: initialization, lane segmentation, post-processing and adaptive parameter updating process. The initial Probability Density Functions (PDFs) were estimated based on conventional color or edge-based lane segmentation method. After initialization, lane pixels were segmented by the statistical Bayes decision rule in the lane segmentation process and the misclassified lane pixels were excluded using the Least Mean Square (LMS) algorithm for the postprocessing. The LMS algorithm estimates each optimal lane at right and left side of the region assuming that lane consists of a set of straight lines. Finally, each PDF of color and edge-orientation were updated using the current detected lane pixels. The use of the Gradient Vector Flow (GVF) snake model for the automated extraction of road from terrestrial based terrestrial laser scanning system was proposed by Kumar, et al. 2010 [6]. The GVF snake model was implemented by deriving its energy terms from the LiDAR point data and then initializing the snake contour based on the navigation information. To calculate the GVF energy from the surface slope, the Digital Terrain Model (DTM) of the LiDAR point data is needed. It was an iterative process. Point thinning over LiDAR points was achieved using the z-mean window filter method. The slope was calculated as the rate of change of the surface in the horizontal (dz/dx) and vertical (dz/dy) directions from its center point to its neighbors by the natural neighborhood interpolation method. LiDAR point cloud data and planimetric road centerline data were used by Hubo and Rasdorf 2008 [7], for modeling road centerlines and predicting their lengths in 3D. For the 3D modeling Linear Referencing Systems (LRS) were used. In LRS a 3D point can be located in a threedimensional space via the planimetric distance and the associated elevation. The comparison of interpolation and snapping method was carried out to get better results. But the prime importance was the selection of buffer size. Barbarella, et al. 2014 [8] was applied LiDAR to the study of taxiway surface evenness and slope. In this study a TLS was used for evaluation of the geometry of taxiway. The TLS measures points belonging to the pavement with a predefined sampling rate in zenith and azimuthal angles. The extremes of line segment of predefined width were calculated, which was orthogonal to the axis at intervals along the axis line. The DEM was then interpolated along those sections obtaining the profile. The least square method was used for the estimation of the slope. A line was calculated that better interpolate all points of every segment. The angular coefficient of the line was the slope of the section. Cheng, et al. 2007 [9] was developed automatic road vector extraction engine for mobile mapping systems. The road information extracted by ARVEE (Automated Road Geometry Vectors Extraction Engine) includes 3D continuous lane lines, road edges and lane lines attributes.
Study area and test data
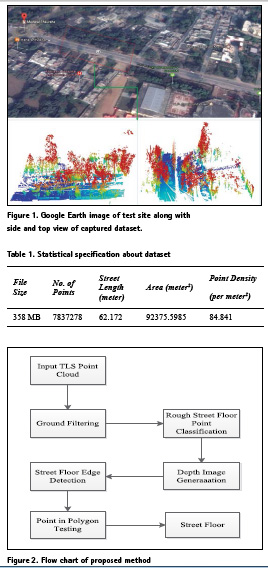
For the data collection purpose, FARO Focus3D X 330 TLS has been used. It is a dynamic 3D TLS mapping system that uses the very latest laser scanning technology combined with a precise navigation system, advanced data processing software and an innovative system design to scan highways, infrastructure, buildings and vegetation. In FARO Focus3D X 330 the onboard navigation system includes a Global Positioning Satellite (GPS) receiver. It offers a 360-degree field of view, a range from 0.6m up to 330m with distance accuracy up to ±2mm, delivering high precision performance and coverage. It is easy to use as it has a dedicated touch screen Liquid Crystal Display (LCD) display that shows status information and allows the data capture parameters to be adjusted. It can be used with ease for the road related data extraction purpose. The test data is captured from the Mahatma Gandhi Marg, Civil Lines, Allahabad city, Uttar Pradesh, India (25° 26’ 47.4108’’ N, 81° 51’ 9.6984’’ E), including 7837278 points. The maximum elevation difference within the dataset is 23.48 meter. There are very low slopes along the horizontal streets, and in some areas streets are heavily blocked by trees. Overall, the data set have an urban as well as nonurban behavior. The length of the street is 62.172 meter. Some street floor points of captured dataset are missing due to the traffic at the time of data capturing. Figure 1, shows the Google Earth image of the corresponding location along with side and top view of captured dataset.
Proposed method
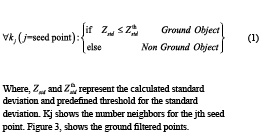
In present study, a novel method for street floor detection using TLS point cloud data is proposed. Method includes five steps namely ground filtering, rough street floor points classification, depth image generation, street floor edge detection and point in polygon testing (Figure 2). All these steps are described in subsection of this section.
Ground filtering
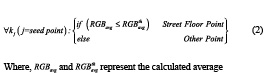
Initially, the point cloud data is projected at X-Y plane. Further, first point of the projected dataset is selected as a seed (query) point. Then, K-Nearest Neighbor (K-NN) search algorithm is applied to find the K neighbor points of the selected seed point. All the K nearest neighbor points are taken collectively and their standard deviation of Z coordinate is calculated. If the calculated deviation value is less or equal to a predefined threshold, then the seed point is labeled as ground points (1). Similar procedure is applied for all the points of point cloud dataset.
Rough street floor point classification
Filtered ground points are further used for rough classification of street floor. Captured TLS point cloud contains both positional (XYZ) and radiometric (Red, Green, Blue (RGB)) information. Radiometric information of filtered ground point cloud is used for rough street point classification.
The process of classification of street floor is similar as ground point filtering. Likewise of ground filtering first point of filtered ground point cloud dataset is selected as a seed point. Then, K-Nearest Neighbor (K-NN) search algorithm is applied to find the K nearest neighbor points of the selected seed point. All the K neighbor points are taken collectively and average of their RGB value is calculated. If the calculated average value is less or equal to a predefined threshold, then these points are labeled as street floor points (2). Similarly, one by one the points from the filtered point cloud dataset are taken as seed point.
and predefined threshold for average. Kj shows the number of neighbors for the jth seed point. The roughly classified street floor points are shown in Figure 4.
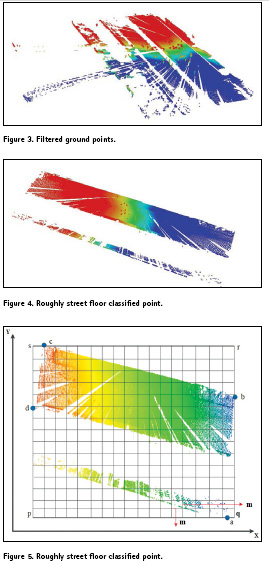
Depth image generation
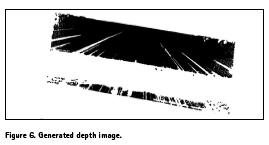
In this step, roughly street floor classified points of previous step are mapped into regular standard grids (Figure 5). The size of grid is taken m meter in both X and Y directions. For each grid, points belonging to the same grid are taken collectively and their average of Z coordinate value is calculated (7). These values are treated as Digital Number (DN) value of depth image for corresponding grid. Each pixel of depth image is represented by a particular grid. The number of pixels in depth image will depend on the grid size (m) (3,4,5,6,8).

Where, DNp is Digital Number value for the pth grid, n represents the total number of points are present in pth grid, f shows the number of rows and g shows the number of columns of generated depth image. Figure 6, shows the generated depth image.
Street floor edge detection
Canny edge detection method has been chosen to detect the edges in depth image (Canny, 1986 [10]). The Canny edge detection includes noise reduction using Gaussian filtering, computing the depth gradient and finding the maximum localized edges, and finally tracing the detected edges to include the weaker gradients if they exhibit natural extension to the strong edges. It finds a lot of edges in depth image besides the boundary edges of street floor (Figure 7). These boundary edges exist on the sides of the street floor which exhibits the highest point density across the whole scene. This high density is used to filter out the remaining edges (Figure 8).
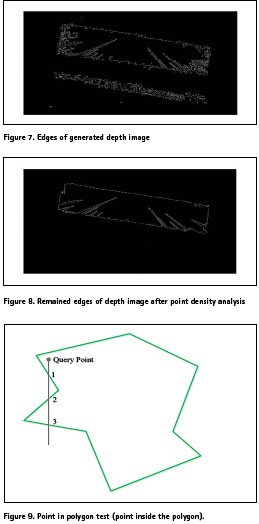
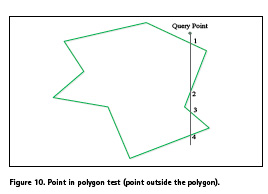
Point in polygon testing After detecting the boundary edges of street floor, point in polygon test is applied in order to detect the street floor points. Representing the edges as a closed shape around the street floor helps the point in polygon test to identify the street floor points in the roughly classified street floor.
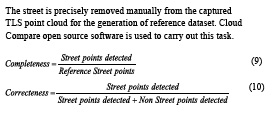
After applying the point in polygon test, roughly classified street floor points are segment into two classes; the street floor (inlier points to the curb polygon) and non-street floor (outlier points to the curb polygon). The point in polygon test simply classifies every point in either street floor or non-street floor. The test determines whether a given point lies inside, outside or on the boundary of a polygon. In this study, point in polygon test counts how many times the query point cuts the boundary of polygon (cutting number), if a line is drawn from the query point in downward Y direction (Figures 9, Figure 10). If the cutting number is even, point is outside the polygon (Figure 10). Furthermore, if cutting number is odd, it means that the point lies inside the polygon or on the polygon boundary (Figure 9).
Result and discussions
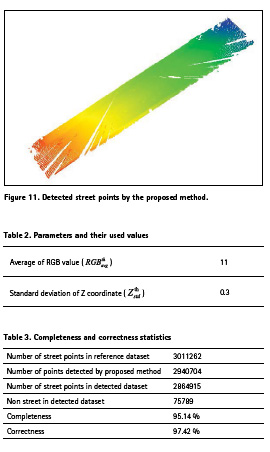
Proposed method is tested on captured TLS point cloud dataset (Figure 1). Statistical specification of the same is shown in Table I. The method uses two parameters average of RGB value ( ) and standard deviation of Z coordinate ( ) in two different steps. The threshold (used) values of these parameters are shown in Table II. Apart from positional information (X, Y, and Z coordinate) of each terrestrial laser scanner point, radiometric information (RGB) is also used by the proposed method. So, the proposed method depends on this additional information. Proposed method is independent of point density. Method has been coded at Matlab2013a installed on Sony Vaio E Series notebook (OS: Windows7 64bit, CPU: Intel Core i3@2.4GHz, RAM: 3GB). The execution time of the proposed method at standard parameters values (Table II) is 451.36 seconds.
The street is precisely removed manually from the captured TLS point cloud for the generation of reference dataset. Cloud Compare open source software is used to carry out this task.
Conclusions and future recommendations
Present study describes an effective method for the classification of street points from TLS point cloud data using both the geometric and radiometric information. K-NN search algorithm is used in ground filtering and rough street floor point classification. Roughly classified street floor points are converted in depth image in order to identify the street floor edges by Canny edge detection technique. Point in polygon test is performed for exact classification of street floor points.
The results achieved appear encouraging; although, a direct comparison could not be made to other published methods that use other data sources such as aerial photography. The classification is performed on urban area. The algorithm presented appears to work well in all areas. The shape of polygon generated by the edge detection step is not in rectangular form due the occlusion in street floor of captured data. Future work is to be focused on the automated obtaining of optimal parameters values for good classification results of the LiDAR data.
References
[1] A. Tsai, W. Cheng, and Pitts, “A mobile cross slope measurement method using lidar,” Transportation Research Record: Journal of the Transportation Research Board. Vol. 2, 2013.
[2] H. Gontran, Y. Gilliéron, and J. Skaloud, “Precise Road Geometry for Integrated Transport Safety Systems,” STRC 05 Conference Paper, Version 03 / 20.01.05, 2005.
[3] M. Thuy, and F. Puente León, “Lane detection and tracking based on LiDAR data,” Metrol. Meas. Syst., Vol. XVII , ISSN 0860-8229, No. 3, pp. 311-322, 2010.
[4] J. Wang, H. González, R. Lindenbergha, and M. Menenti, “Geometric road runoff estimation from laser mobile mapping data,” ISPRS Annals of the Photogrammetry, Remote Sensing and Spatial Information Sciences, Volume II-5, 2014.
[5] J. Lee, and J. Cho, “Effective lane detection and tracking methodusing statistical modeling of color and lane edge-orientation”, doi: 10.4156/aiss.vol2.issue3.6, 2009.
[6] Kumar, McCarthy, and McElhinney, “Automated road extraction from terrestrial based mobile laser scanning system using the GVF snake model”, 2010.
[7] C. Hubo, and W. Rasdorf, “Modeling Road Centerlines and Predicting Lengths in 3-D Using LiDAR Point Cloud Data and Planimetric Road Centerline Data,” Comp.-Aided Civil and Infrastruct. Engineering 23(3): 157-173, 2008.
[8] M. Barbarella, R. Blasiis, M. Fiani, and M. Santoni, “A LiDAR application to the study of taxiway surface evenness and slope,” ISPRS Annals of the Photogrammetry, Remote Sensing and Spatial Information Sciences, Volume II-5, 2014.
[9] W. Cheng, T. Hassan, N. El-Sheimy, and M. Lavigne, “Automated Road Vectors Extraction for mobile mapping systems,” Commission III: WG III/5. Vol. XXXVII, Part B3, pp. 98, 2007.
[10] J. Canny, “A computational approach to edge detection, Surveying Engineering,” IEEE Trans. Pattern Analysis Machine Intelligence PAMI. 8, 679–698, 1986.
The paper was published in International Journal of Advanced Research in Computer Science, Volume 8, No. 8 (2017).


 (No Ratings Yet)


Leave your response!