| Applications | |
Monitoring the changing landscape of Sutlej catchment
The objective of the paper is to assess spatio-temporal changes in landscape in and around hydel-electricity projects of Sutlej catchment in Himachal Pradesh, India |
 |
|
Background
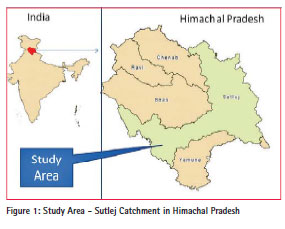
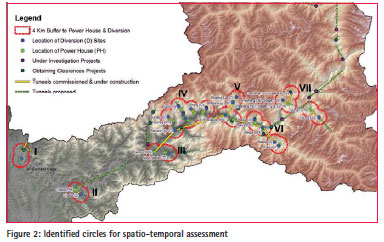
Himachal Pradesh has been experiencing massive growth in hydel electricity projects during the last two decades or so. It was mainly on account of successive state government’s policy and emphasis on harnessing the hydel power potential of the state. As Himachal Pradesh (HP) is a mountainous state, it is home to many famous rivers and provides water to both the Indus and the Ganges basins. The drainage systems of the region are Chandra Bhaga or Chenab, Ravi, Beas, Sutlej and Yamuna. These rivers are perennial and are fed by snow and rainfall. The revised hydro-power potential of the State is estimated to the tune of 27,436 MW (about 25% of the national potential), of which 129 projects with aggregate capacity of about 9442 MW stand commissioned while 72 projects of total capacity of about 3000 MW are at construction stage and remaining at other stages of implementation. The current paper discusses about the Sutlej catchment (Figure – 1), which comprises of about 40 percent of total geographical area (TGA) of the state.
Landsat satellite data
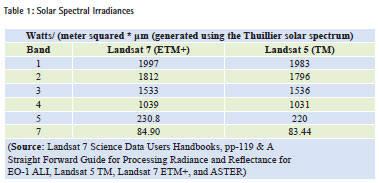
The long timeseries landsat satellite data available (since 1972) in public domain with a good temporal repetition, a readyto- use format (calibrated), global coverage, free-ofcharge availability, possibility to transfer the data over the Internet, etc., make the landsat satellite images the most sought after dataset. After careful examination of the above points, it was decided to use landsat satellite data for this study. Landsat 5 & 7 satellite data (sensors being TM and ETM+), for the years 1989, 1990, 2000 and 2011, were used for the current study.
Normalized difference vegetation index
The Normalized Difference Vegetation Index (NDVI) is a widely used vegetation index in forestry assessment and its management. It is an equation that takes into account that healthy vegetation, which reflects very well in the nearinfrared part of the electromagnetic spectrum and strongly absorbs visible light (from 0.4 to 0.7 ??m) for use in photosynthesis. Live green plants absorb solar radiation, which they use as a source of energy in the process of photosynthesis. Hence, live green plants appear relatively dark in the red and relatively bright in the near-infrared. By contrast, clouds and snow tend to be rather bright in the red (as well as other visible wavelengths) and quite dark in the near-infrared. All the geospatial analyses were conducted with the help of ArcGIS 10 and Erdas Imagine 9.2 softwares.
Equation of NDVI = (NIR – RED)/NRI+RED)
where RED and NIR stand for the spectral reflectance measurements acquired in the red and near-infrared regions.
It can be seen from its mathematical definition that the NDVI of an area containing a dense vegetation canopy will tend towards positive values (say 0.3 to 0.8), while clouds and snow fields will be characterized by negative values of this index. Other targets on Earth visible from space include free standing water (e.g., lakes and rivers) which have a rather low reflectance in both spectral bands. Thus they result in very low positive or even slightly negative NDVI values. Soils which generally exhibit a near-infrared spectral reflectance somewhat larger than the red, and tend to also generate rather small positive NDVI values (say 0.1 to 0.2).
1. Barren rocks, sand, or snow show very low NDVI values – (-0.1 to 0.1)
2. Shrubs and grasslands or crops – 0.2 to 0.5
3. Dense vegetation or tropical rainforest – 0.6 to 0.9
4.Deep water – 1
Methodology & calibration
The main purpose for applying radiometric corrections is to reduce the influence of errors or inconsistencies in image brightness values that may limit one’s ability to interpret or quantitatively process, and analyze digital remotely sensed images. Two radiometric corrections were employed to normalize landsat satellite images for time series inter-comparison. In addition, radiometric properties of the target images were also adjusted/ stretched to match the base layer (i.e., 1989), particularly for the data having very high cloud contamination. The variability between scenes were normalized (i.e., subtraction of illumination differences) by applying the following corrections in the images, which facilitated a better temporal analysis.
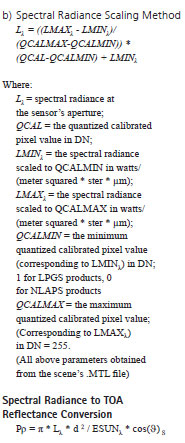
It is possible to convert these DNs to ToA Reflectance using a two-step process.
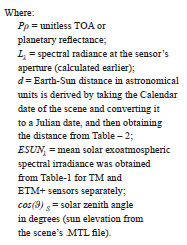
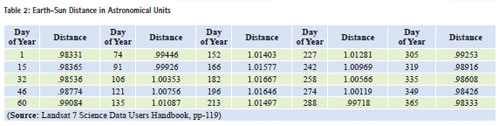
The first step is to convert the DNs to radiance values using the bias and gain values specific to the individual scene. The second step converts the radiance data to ToA (Top of Atmospheric) reflectance.
Calibrated DN to Spectral Radiance Conversion
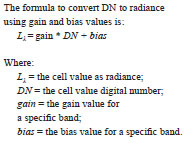
There are two formulae that can be used to convert DNs to radiance. One method uses the Gain and Bias (or Offset) values from the header file. The longer method uses the LMIN and LMAX spectral radiance scaling factors. In the current study, the latter (b) was used for spectral radiance calculation based on the metafile of the ortho-corrected datasets.
a) Gain and Bias Method
Results and discussion
Since most of the muck dumping sites and major construction activities of hydel power projects were located near to a power house or diversion sites or in between, therefore, assessments around these locations are of utmost importance. Project proponents identify and select their dumping sites near the project components such as tunnels, weir, power house etc. This is to avoid transportation cost and utilize mucks generated from the tunnel excavation in their utility development and access road construction activities. In view of the above, 4 km aerial buffer has been identified around the power house (PH) and diversion (D) sites, which virtually covers many kilometers in terms of surface distance. Red buffers shown in Figure – 2 around the power house and diversion sites depict actual area of spatial-temporal assessment.
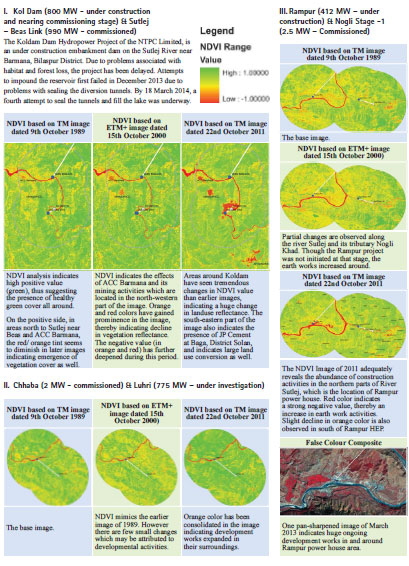
Based on the above map, red circles numbered at various locations have been assessed visually in the following timeseries NDVI maps, wherein changes in landscape and land cover are depicted. The changes were analyzed based on the base image of 1989 and 1990.
Conclusion
From the above assessment based on multitemporal vegetation indices (NDVI), it is clear that many areas close to hydel projects did reflect changes in land use and land cover properties. Of them, areas under scrubland or pasturelands have also shown changes, thus activities did take place there as well. Some areas showing positive value in earlier images have shown high negative value indicating large scale changes in landscape. It also indicated that landuse changes were also observed near mining areas of Cement plants (ACC and JP) in addition to hydel projects. It is the river valleys that have thrown more changes than higher reaches. The decade of 2000-2010 has shown greater changes in their landscape than the preceding decade of 1990-2000, clearly indicating the faster pace of development during the last decade. However, some enhancement in green reflection was also observed in many areas indicating new plantation activities as well. The spatiotemporal changes could have been assessed with greater precision at micro-level if the higher spatial resolution of multi-spectral (MS) datasets have been employed, which is the beyond the scope of this paper.
References
1. Dams and Development – A New Framework for Decision Making (2000), the Report of the World Commission on Dams, Earthscan Publications Ltd, London and Sterling.
2. Du, Y., Teillet, P. M., & Cihlar, J. (2002). Radiometric normalization of multi-temporal high-resolution satellite images with quality control for land cover change detection. Remote Sensing of Environment, 82, 123??134.
3. Frauke Urban and Tom Mitchell (2011). Climate change, disasters and electricity generation. London: Overseas Development Institute and Institute of Development Studies.
4. Kaufman, Y. J. (1989). The atmospheric effect on remote sensing and its correction. In G. Asrar (Ed.), Theory and Application of Optical Remote Sensing. New York. 314ff.
5. GOETZ, S. J. Application Of Multitemporal Landsat Data to Map and Monitor Land Cover and Land Use Change in the Chesapeake Bay Watershed, Woods Hole Research Center Woods Hole, Massachusetts (USA).
6. Landsat 7 Science Data Users Handbook, A National Aeronautics and Space Administration Publication.
7. Liu, X. H., (2000). Change Detection for Urban Growth Modeling: An Artificial Neural Network Approach. In Proc. 4th International Conference on Integrating GIS and Environmental Modeling (GIS/EM4): Problems, Prospects and Research Needs. Banff, Alberta, CA.
8. Olsson, H. (1995). Reflectance calibration of Thematic Mapper data for Forest Change Detection. International Journal of Remote Sensing, 16(1), 81-96.
9. Shilong Piaoa, Anwar Mohammata, Jingyun Fanga, Qiang Caia,b, Jianmeng Fenga, (2006), “NDVI-based Increase in Growth of Temperate Grasslands and its responses to climate changes in China” Global Environmental Change. Online Sciencedirect.com
10. Song, C., Woodcock, C. E., Seto, K. C., Pax-Lenney, M., & Macomber, S. A. (2001). Classification and change detection using Landsat TM data: When and how to correct atmospheric effects. Remote Sensing of Environment, 75, 230244.
11. Straight Forward Guide for Processing Radiance and Reflectance for EO-1 ALI, Landsat 5 TM, Landsat 7 ETM+, and ASTER.
12. Teillet, P. M., Barker, J. L., Markham, B. L., Irish, R. R., Fedosejevs, G., & Storey, J. C. (2001). Radiometric cross-calibration of the Landsat-7 ETM+ and Landsat-5 TM sensors based on tandem data sets. Remote Sensing of Environment, 78, 3954.


 (8 votes, average: 3.25 out of 5)


Leave your response!