| Geodesy | |
Geodetic measurements in the area of Kozloduy Nuclear Power Plant
The results of the measurements can be analyzed and interpreted in close cooperation with specialists from different professions and representatives of various fields of science and technology |
 |
|
 |
|
 |
|
For security purposes and safe and flawless operation of the Nuclear Power Plant (NPP) “Kozloduy” at the end of the last century it was given the task to build a monitoring system. As a major component of this system was to be built precise geodynamic (geodetic) network for investigation of deformations, which covers the territory of the plant, double channels and a territory outside the plant. One of the main objectives of the system for geodetic monitoring is monitoring of the spatial displacements and deformations that may occur in the facilities, on the terrain beneath them and in the surrounding areas. This paper presents the results of geodetic measurements of the NPP carried out during time span of 1998- 2013 by “Geoprecise Engineering” Ltd Company, mathematical data processing, analysis and interpretation of results.
Introduction
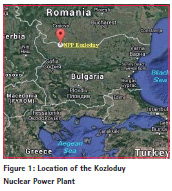
The Kozloduy Nuclear Power Plant (KNPP) is a nuclear power plant in Bulgaria situated 120 kilometres (75 mi) north of Sofia and 5 kilometres (3.1 mi) east of Kozloduy, a town on the Danube river, near the border with Romania (Figure 1). It is the country’s only nuclear power plant and the largest in the region.
The construction of the first reactor began on 6 April 1970. Kozloduy NPP currently manages 2 pressurized water reactors with a total output of 2000 MW. Units 5 and 6, constructed in 1987 and 1991 respectively, are VVER-1000 reactors. One of the main objectives of the system for geodetic monitoring is monitoring the spatial displacements and deformations that may occur in the facilities, of the terrain below them and on the surrounding terrain. The results of geodetic monitoring can be used for prediction and prevention of possible accidents.
Geodetic network and measurements
The geodetic measurements in the region of the Kozloduy NPP started in 1998 [Valev et al., 1999].
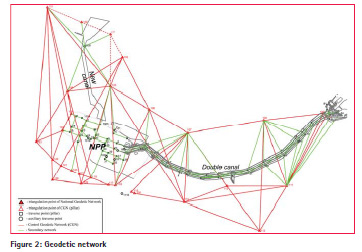
The entire geodetic network (Figure 2) is generally composed of the following parts which can be considered as separate subsites:
– Control Geodetic Network (CGN) consists of control points (pillars) and benchmarks on the pillars and covers the entire region.
– Secondary geodetic network consists of traverse points and benchmarks within the NPP.
– Geodetic network of points and benchmarks in the area of dual canal.
– Geodetic network of points and benchmarks in the area of the canal for additional technical water supply.
– Geodetic network of points and benchmarks in the area of the Coast Pumping Station (CPS).
The tectonic activity of the area of location of Kozloduy NPP has been studied as part of entire territory of Bulgaria or of Balkan Peninsula by different researchers [Kotzev et al., 2006; Kotzev et al., 2008; Milev, Dabovski, 2006; Milev et al., 2006].
The structure of entire geodynamic network according to different types of measurements can be regarded as composed of four separate geodetic networks:
– Spatial GPS network;
– Horizontal triangulation network;
– Horizontal trilateration network;
– Height (Levelling) network.
Comprehensive and integrated precise geodetic measurements of all types of networks are carried out in 6 epochs: 1st epoch – summer / autumn 1998; 2nd epoch – winter 2001 and spring 2002; 3rd epoch – autumn 2004; 4th epoch – autumn 2007; 5th epoch – summer 2010; 6th epoch – spring 2013; 7th epoch – carried out this year (summer 2016).
The measurement types carried out are as follows:
• GPS measurements with 5 dual frequency GPS Receivers LEICA Geosystem 1230 and 2 receivers GEONEX;
• Levelling measurements with electronic digital levels and barcodes invar staffs;
• Angular measurements with electronic total station with direct accuracy ±2cc;
• Distance measurements with laser rangefinder Mecometer ME 5000.
GPS measurements were carried out on the 27th control points of the CGN and on all traverse points located in the area of the plant, near the double canal, the new canal and near the coast pumping station. The total number of all measured GPS points is 279. The precise angular measurements were carried out by the approach of circular rounds and total 402 horizontal directions at 101 stations were measured. Precise distance measurements were carried out with the laser rangefinder Mecometer ME 5000. The precision of laser rangefinder is ±(0,2mm +0.2 mm/km). Weather data were measured (temperature, pressure, humidity), as at the finder, and at the reflector. Number of measured lengths with Mecometer ME 5000 is 448 lengths. The precise levelling measurements were carried out with digital level ZEISS DINI 12, which has a direct accuracy ± 0.4 mm/ km. 120 levelling runs are levelled with a total length – 75 km. The levelling includes – deep levelling benchmarks; levelling benchmarks of the existing levelling network; levelling benchmarks to the foundations of the points of the horizontal network; points of all subsites.
Data processing
The results of all types of measurements are processed in compliance with the maximum mathematical rigor, taking into account all the possible harmful external influences and with minimum of hypotheses.
Baselines are calculated first from the GPS measurements [Valev, 1987; Valev, 1995]. Distance measurements are processed after correcting them for weather conditions (temperature, humidity, pressure, curvature of the light path). Levelling measurements are processed for all subsites. The resulting rms per kilometer from misclosers in levelling loops is ± 1.3 mm/km. The horizontal network is adjusted as angular-linear network.
For each point are estimated: rms of coordinates, rms of position and the ellipses of errors. The obtained rms of the entire network is Mp = ± 5.8 mm
Secondary network is adjusted separately as definition of datum is from the control network.
The levelling network is adjusted commonly for the control network points and points of the subsites. 8 benchmarks are used for datum definition in the adjustment. The resulting rms per unit of weight, which is rms per kilometer, is: Mh = ±0.9mm. The obtained elevations of all benchmarks are in Baltic height system. The GPS network is adjusted as free network in two variants:1) using only GPS measurements; 2) using GPS measurements, distances measured by Mecometer and elevations from precise levelling [Valev, Minchev,1995]. The obtained results are adjusted spatial Cartesian coordinates of the points; ellipsoidal geographic coordinates and ellipsoidal heights; plane coordinates in a Lambert map projection. The accuracy of estimated results from two variants of GPS data processing is:
First variant: rms in space: МXYZ = ±2.0mm; rms in plane: МXY = ±1.0mm; rms in height: Mh = ±1.7mm.
Second variant: rms in space: МXYZ = ±1.9mm; rms in plane: МXY = ±0.9mm; rms in height: Mh = ±1.6mm.
On the basis of the obtained results (point coordinates, point heights and distances between points) are studied:
• Height changes of the terrain – the vertical movements of the benchmarks relative to their position in 1998, 2001, 2004, 2007 and 2010.
• Magnitude and direction of horizontal vectors of point movements.
• Surface deformations by applying the finite element method.
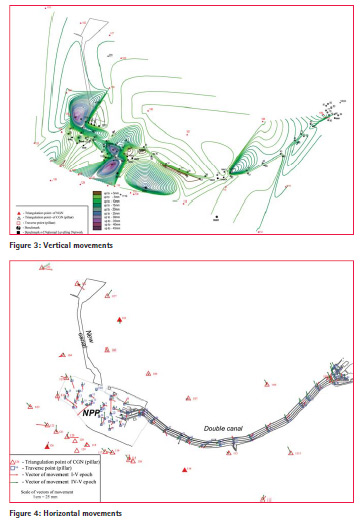
The vertical movements of the area of study are shown in figure 3.
Horizontal movements are calculated from the obtained displacements in coordinate axes for the periods between the adjacent epochs (3 years) and between each epoch and the initial epoch of measurements in 1998. Horizontal movements between 5th measured epoch and the initial epoch (in red) and between 5th and 4th measured epochs (in green) are shown in figure 4.
Determination and analysis of deformations
Finite Element Method developed for space [Vassileva, Valev, 2015a; Vassileva, Valev, 2015b] is applied under the assumption that the deformations occurring between epochs are isotropic within a single differential surface element. The same standard surface elements representing non-overlapping triangles are chosen as finite elements. Relative deformations of the sides of each finite element and principle deformations with their direction for each finite element are calculated. The principal axes of deformations between 1st and 5th epochs of measurements are shown in figure 5.

The vertical displacements of almost all points of the control network, as well as for the most of the points from the secondary network are obtained. Both uplifts and subsidence are found. Mostly is the sinking. There are also zero displacements. Vertical displacements between 1st and 5th epoch are under 5 cm. It is not found a trend in the vertical movements.
Horizontal movements of the CGN are with various directions and no trend is found. Displacements of half of the points are over 30 mm as maximum displacement is 48 mm.
Horizontal movements of the Secondary network, which covers the area of NPP, are less than 20 mm. The directions of movements are mostly southeast. For the period 1998-2010 the maximum displacement is 30 mm. For all other points displacements are less than 20 mm. Directions of movement are mainly in the south and southeast. From the analysis of the movements it is established that the horizontal displacements are much larger than vertical.
The accumulated isotropic deformations between any two adjacent epochs and between initial and final epoch are analyzed. The maximum deformation of almost all finite elements is below 10-4, but for many, they are even below 10-5. Deformations are diverse in character and direction.
The results from the analysis show that deformations established are of extension and of compression. There are sites where deformations are either just of extension or just of compression. The principle deformations are under critical. Directions of the principal axes of deformation are different. This means a slight change in space and time of the quantitative and qualitative characteristics between the epochs or there exist permanently redistribution of the intensity and nature of deformation processes in the region.
Conclusions
The results of the measurements, data processing and analysis confirm that there is a deformation process in the area of the Kozloduy NPP that is slow and has a variable character. Movements established indicate possible weak geodynamic processes and phenomena. The vertical displacements are not of the same order with the horizontal – vertical are almost an order of magnitude smaller. Deformations established between neighboring epochs are so far below critical values. The situation for now is relatively calm. Our opinion is that there is currently no reason to prescribe any special measures on the safety of the Kozloduy Nuclear Power Plant.
Recommendations
Based on the above analysis the following recommendations can be made. Geodetic measurements should continue with greater frequency. It is appropriate in the future to carry out measurements at least every two years. The most favorable time for such measurement is late summer and early fall. In addition to regular measurements extra measurements could be possible. The most important circumstances that need to carry out such measurements are: various natural disasters (earthquakes, heavy rains, floods, storms, prolonged drought, etc.); abnormal weather conditions; emergency; after repair of equipment; high water level of the river; increased seismicity; activation of geodynamic phenomena.
The results of the measurements can be analyzed and interpreted in close cooperation with specialists from different professions and representatives of various fields of science and technology. Our information must be correlated with seismic and tectonic one. If more measuring epochs are available a regression analysis and relevant prediction of the displacements and deformations are possible.
References
Kotzev, V., R. Nakov, Tz. Georgiev, B.C. Burchfiel, R.W. King. (2006). Crustal motion and strain accumulation in western Bulgaria, Tectonophysics, 413, 127–145.
Kotzev, V., R.W. King, B.C. Burchfiel, A. Todosov, B. Nurce, R. Nakov. (2008). Crustal motion and strain accumulation in the South Balkan Region Inferred from GPS Measurements, in Husebye, E., ed., Borovetz, Bulgaria, 11–18 September 2005: NATO Science Series IV: Earth and Environmental Sciences. Volume 81, 19–43.
Milev, G., Ch. Dabovski. (Eds). (2006). Geodynamics of the Balkan Peninsula, Monograph, Reports on Geodesy, Warsaw University of Technology, Institute of Geodesy and Geodetic Astronomy, 647 pp.
Milev G., G. Valev, K. Vassileva. (2006). Some Aspects of Geodynamic Investigations on the territory of the Balkan Peninsula. 16th International Symposium “Modern technologies, Education and professional practice in Geodesy”, 9-10 November 2006, Sofia, Bulgaria, 132-139.
Valev, G. (1987). Projection of points onto the earth ellipsoid. Geodesy, Cartography and Land Management, 4, 6-11. (in Bulg.)
Valev, G. (1995). Another approach to derive the parameters of the ellipse of deformations. Geodesy, Cartography and Land Management, 2-3, 15-19. (in Bulg.) Valev, G., M. Minchev. (1995). Combined Adjustment of GPS and Classical Network Data. Reports of the EUREF Technical Working Group, Symposium of IAG Subcommission for EUREF. Helsinki, May 5 -10, Verlag der Bayerischen Akademie der Wissenschaften, Heft 56, 213-220
Valev, G., G. Rainov., I. Kalchev. (1999). Establishment of precise geodetic network on the territory of Kozloduy Nuclear Power Plant. Geodesy, Cartography and Land management, 5-6, 5-10, (in Bulg.) Vassileva, K., G.
Valev (2015a). Application of Finite Elements Method in space for deformation analysis of the territory of Bulgaria, Proceedings of the 8-th Congress of the Balkan Geophysical Society, 4-8 October, Crete, Chania, Greece, 5p. art. N. 26716. Vassileva, K., G. Valev. (2015b). Deformation analysis of the Territory of Bulgaria from GNSS observations by Finite Elements Method in Space. Coordinates, Vol. XI, Issue 12, 12-15.


 (No Ratings Yet)


Leave your response!