| Surveying | |
Use of GPS in survey data error control and management
Building Code Implementation program, a project of National Society for Earthquake Technologies, uses Global Positioning System (GPS) data to control error of its surveys |
 |
|
 |
|
 |
|
 |
|
Building Inventory Data Survey (BIDS) is a survey carried out by NSET to develop the earthquake scenario of cities. It collects structural data, occupant number and spatial information of all buildings within city. This survey is planned to be conducted in 8 municipalities of Nepal that BCIPN has been working on. So far, the BIDS survey has been successfully completed on Bharatpur, Vyas, Birendranagar and Birtamode municipalities. The main purpose of the survey is to develop an earthquake scenario for these municipalities. This earthquake scenario estimates the loss of the infrastructure, economy and social disruption [1]. This crafted scenario provides a powerful tool to draft mitigation policies and action plan. It will also help the community to set priorities that will significantly reduce the impact of likely future events.
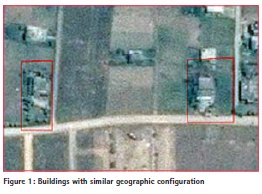
The survey consists of two aspects, geography (the georeferenced building footprints) and attribute (building and occupant data). They navigate on field with the help of the map that they are provided with. However, while navigating, there are often problems as there are many areas that seem similar on map. As seen in the satellite image below in Figure 1, the two buildings marked by squares below are very similar in geographical configuration. Also, the satellite image is not recent which means that there could be some considerable changes such as extraction of new buildings as well as demolition of buildings. In these situations surveyors may get confused while locating the correct building on the map. This often leads in a chain effect and the buildings around it being incorrect surveyed as well. In order to tackle this GNSS (Global Navigation Satellite System) technologies have been put to use. Modern smart phones that are available in market have built in GPS receiver [2]. GPS is a navigation system that uses satellites that are constantly orbiting the Earth to provide location of the receiver. This location can be compared with the location of the footprint of the surveyed building. This can tell whether the survey is spatially correct or not.
Methodology
The area to be surveyed is broken down into grids and a map is prepared for each grid of 200 by 200 meters. Then, surveyors are provided with a map and asked to go to the corresponding location and survey all buildings in the region within the grid. Survey data is collected on a smart phone and uploaded to the ODK based platform KOBOTOOLBOX [3] while the footprint of the building is drawn on the map. The drawn footprint is then digitized using google earth or a web tool developed by NSET after the completion of survey by surveyor in their assigned grid.
The first step in finding the error is to check the distance between the locations recorded by devices during survey and their corresponding digitized building footprints. To find the distance, first the centroid of a building is computed. After that, the distance between centroids and their corresponding survey locations are computed. These distances are used to determine whether the surveyed building was indeed the building marked on map. In order to make the process efficient and easier, a web map application was developed. The web application automatically fetches GPS coordinates and identifier of survey data from the database where it was uploaded. In the web application, after the digitized footprints that is saved as kml file is selected, it is parsed and matched it against the surveys that it fetched earlier. The matched survey and footprint are connected with a line that, when clicked, pops up with the identifier and distance between building centroid and survey GPS location which is computed by the application. A screenshot of the web application can be seen in Figure 2.
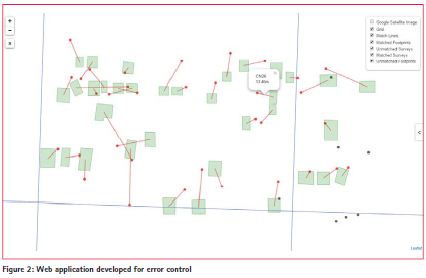
Satellite image can also be added as base on this map to get a better idea as it can be seen below in Figure 3.

This procedure can be carried out in two approaches depending when it is carried out
1. Post-Survey Approach
2. During-Survey Approach
Post-Survey Approach
In this approach, the check is performed after the whole survey is complete. The advantage of this approach is that it is performed only once i.e. at the end and is not dependent on availability of internet connection. Since Microsoft Excel is a widely used application, so once the data is exported to spreadsheet, the level of expertise required is relatively low. Since the error management is done after survey ends, the survey period can be kept short. The general workfl ow for this approach can be seen below in Figure 4. However, there are some disadvantages as well. One of the major disadvantages is that since the check is done at the end, any error occurred will be solved only at the end. This results in accumulation and propagation of error. Since the corrections are made after survey ends, most of the corrections are based on conclusions derived from the available data such as satellite image which is not always reliable as the images are generally old. Visiting the place itself could prove to be impractical if the activity has a predefined time limit.
During-Survey Approach
In this approach, the check is performed after survey in each grid is complete before the overall survey ends. Using this approach, errors that occur in survey can be handled during survey which stops the accumulation and propagation of error. Since the survey is ongoing when checks are performed, the corrections can be made more accurately as it’s more practical to visit field if any confusion arises. Most corrections will be done by the time the survey ends and errors will also be smaller in number because of the quality control. So, the data management process after survey becomes a lot faster and easier. The general workfl ow for this approach can be seen below in Figure 5.
 s
s
One downside to this approach is that since checks and corrections are carried out during survey period, the survey period is generally longer. Since the data is checked in parts, the whole state of survey can’t be seen while it is being checked. For example, surveys towards the outer extents of region completed till now could appear to be spatially correct when they are not.
Conclusion
GNSS has made collection of geolocation very easy. Collecting location obtained from GNSS services such as GPS has multiple advantages. While checking spatial correctness of geographic data, the ability to collect location information with such ease makes a huge difference. Even while conducting BIDS survey, GPS data has been implemented as core element of the survey. While it has been used and evaluated using two different approaches, it can be concluded that the approaches are suited for different scenarios. In scenarios where the onsite survey duration is limited and have limited on-field personnel, even though post-survey check would take longer time, the post-survey check approach is better suited. However, in order to minimize possible errors, it is best to have experienced surveyors when using this approach. Conversely, if there is no time constraint, then during-survey check approach is best. Surveyors with less experience can also work in this approach as the data they bring is constantly monitored.
Acknowledgements
The authors would like to acknowledge all people directly and indirectly involved with the program. The financial support provided by United States Agency for International Development, Office of U.S. Foreign Disaster Assistance (USAID/ OFDA) to NSET for BCIPN program is also greatly appreciated. The authors would also like to thank the involved municipalities for their assistance for the program. The encouragement and review provided by NSET management and colleagues, especially Er. Sumit Maskey, is highly acknowledged.
References
[1] E. E. R. I. (EERI), “Earthquake Scenarios,” [Online]. Available: https://www.eeri.org/projects/ earthquake-scenarios/ [Accessed 10 Jan 2016].
[2] “GPS.gov: GPS Overview,” [Online]. Available: http://www.gps.gov/systems/ gps/ [Accessed 26 December 2015].
[3] “KoBoToolbox | Data Collection tools for challenging environment,” KoBoToolbox, [Online]. Available: http://www.kobotoolbox.org/. [Accessed 26 December 2015]


 (No Ratings Yet)


Leave your response!