| Application - New, Disaster Management | |
Towards the prediction of Earthquakes with GNSS data
The paper aims to validate the use of Global Navigation Satellite System (GNSS) signals prior to the occurrence of earthquakes as a means of earthquake prediction, by referring to the Great East Japan Earthquake |
 |
|
 |
|
 |
|
The paper aims to validate the use of Global Navigation Satellite System (GNSS) signals prior to the occurrence of earthquakes as a means of earthquake prediction, by referring to the Great East Japan Earthquake (hereafter called the Great Earthquake). The Great Earthquake occurred on March 11, 2011 with Richter Scale M 9.0 and it killed about 18,000 people mainly due to the subsequent Tsunami. The validation is based on data analysis of GNSS signals at GNSS-based Control Stations, about 1,200 of which have been installed all over Japan by Geospatial Information Authority (GSI) since 1996.
The objective of the study is to detect signals before the Great Earthquake using various indicators computed from the daily GNSS data, with a view to their being used in future for the prediction of earthquakes. The study succeeded to detect several pre-signals six months, five months, one month and three days before the Great Earthquake in the daily data, averaged weekly data, weekly maximum deviations, height changes over two years and/or accumulated changes.

The most important finding in this paper is that the detection of pre-signals as well as the pre-slips in the three days prior to the Great Earthquake could have led to the prediction of the forthcoming seismic event, when it has previously been claimed to be impossible to do so with existing measuring techniques.
Introduction
Since GSI commenced releasing GNSS daily data (in the beginning only GPS data) on the Internet in 2002, correlation analyses between abnormal changes in position and elevations detected in the GNSS signals have been made before seismic events (called pre-signals in this paper), and the location and magnitude of subsequent earthquakes. 162 earthquakes which occurred in Japan larger than M6 in the eight years between January 2000 and December 2007 were checked to determine whether or not pre-signals existed. Surprisingly, the investigation proved that all earthquakes showed some kind of pre-signals, which means that GNSS data should be useful in predicting earthquakes. Although, the authors were able to detect some pre-signals before the Great Earthquake, public release of this information was prohibited as only the governmental authority was officially permitted to make public statements about the prediction of earthquakes. However after the Great Earthquake, any private sector is allowed to start a business for predicting earthquakes. Since then the authors have supported a private company called Japan Earthquake Science Exploration Agency (JESEA: http://www.jesea. co.jp), which was established in January 2013 for developing earthquake prediction methods and predicting the risk of earthquakes. JESEA initiated the business in February 2013 by providing the weekly ‘MEGA earthquake prediction information’ through mail magazine to registered individuals and organization members at a low cost.
In 2013, eight large earthquakes occurred in Japan for which the presignals were validated and publicized to JESEA members. The prediction method has been developed and validated using the GNSS pre-signals study of the Great Earthquake as described in this paper. Murai, S and Araki, H acquired a Japanese patent for the prediction of earthquakes and volcanic eruption using GNSS data in 2006, and another patent was submitted in September 2013 together with JESEA which is now pending approval.

GNSS data used
Every week, seven days of GNSS data for the period from Sunday to Saturday are downloaded, based on the precision ephemeris, following its release on each Monday by GSI, two weeks after its acquisition. Figure 1 shows an example of a GNSS-based control station and the distribution of GSI’s GNSS-based control stations in Japan. The GNSS data include geocentric coordinates of X, Y and Z, as well as converted latitude, longitude and ellipsoidal height (H), acquired by the US GPS, the Russian GLONASS and the Japanese Quasi-Zenith Satellite Systems (QZSS). The F3 level data have an accuracy of about 2 to 3 mm. According to the results of past validation studies, the changes of ellipsoidal height (H) have been mainly used, although X, Y and Z are also supplemented as reference.
Validation areas
As Tohoku district is the closest to the epicenter and also suffered most damage due to the Great Earthquake and Tsunami as shown in Figure 2, which shows the Japan Meteorological Agency seismic intensity data, the validation areas have been selected mainly on the Pacific Coast of the three prefectures of Iwate, Miyagi and Fukushima as shown in Figure 3. The epicenter is located 130 km offshore east-east-south of Miyagi Prefecture. Other areas are also referred to for the pre-earthquake validation. The dramatic height changes caused by the Great Earthquake are clearly visible in the data for the GNSS-based control stations in Iwate, Miyagi and Fukushima Prefectures in Tohoku District as shown in Figures 4, 5 and 6 respectively. The largest subsidences in height of over 50 cm were in order, – Ojika (111 cm), Iwaki (90 cm), Onagawa (85 cm), Ofunato (76 cm), Kesennuma (65 cm), Shizugawa (65 cm), Kahoku (65 cm), Kamaishi (59 cm), Odaka (56 cm) and Yamada (55 cm), the locations of which are shown by red dots in Figure 3. Ojika showed the largest horizontal movement of 5.3 m in the direction to easteast –south, which is perpendicular to the Japan Trench.
Indicators for detecting pre-signals
Various indicators have been used as shown below to detect presignals before the Earthquake. The indicators are classified into short term of daily and weekly span, and long term of two years’ span.
Short term span:
1) Daily height change
2) Averaged weekly height change
3) Weekly maximum deviation (height difference between the maximum and minimum in a week)
Long term span:
4) Daily changes of X, Y, Z and H over two years; it was considered that data from two years prior to a seismic event could demonstrate normal position information unaffected by earthquakes
5) Accumulated daily changes of X, Y, Z and H over the two years

Recognition of the pre-signals
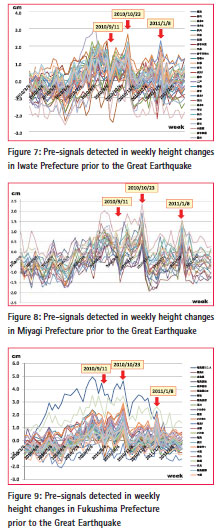
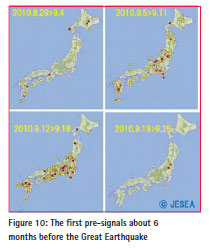
Close attention was paid to simultaneous dramatic changes at multiple sites at district scale to recognize presignals before earthquakes. Before larger earthquakes more points change simultaneously in position than before smaller earthquakes. A review of one year of GNSS data in Tohoku District from March 2010 to March 2011, prior to the Great Earthquake, revealed the first presignals which were abnormal simultaneous changes in height at around September 11, 2010 in Iwate, Miyagi and Fukushima Prefectures as shown in Figures 7, 8 and 9 respectively, although abnormal changes commenced from around August 2010. The second pre-signals were detected around October 23, 2010, while the third was detected around the January 8, 2011. It should also be noted that several points in particular showed extraordinary behavior in Fukushima Prefecture, but the tendency seems similar to other points. As shown in Figure 10, the week from September 5-11, 2010 and the following week from September 12-18, 2010 (about six months before the Great Earthquake), showed abnormal weekly maximum deviations in red (a critical level over 5 cm) and yellow (moderate level over 4 cm). Not only the Tohoku District but also many other districts showed abnormal changes prior to this huge earthquake. It may be a mistake to consider only the movement of local faults near the epicenter. After the three dramatic pre-signals referred to above, the Japanese Islands remained relatively calm until three days before the Great Earthquake. It is recognized that there should be a calm period after such dramatic simultaneous changes, although the duration of the calm period cannot be estimated. A question arises, how can we predict impacts such as those that occurred in the critically affected areas shown in Figure 3, because the pre-signals referred to above were detected all over Japan?
Detected pre-slips
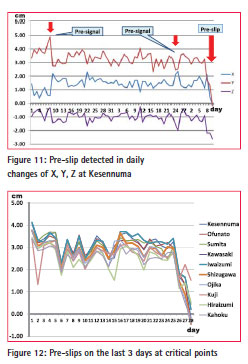
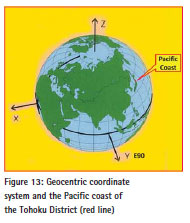
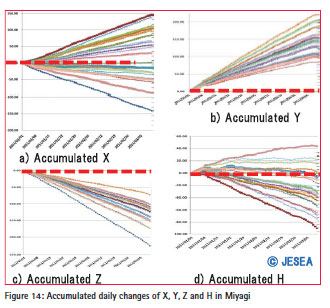
Pre-slip is defined as the abnormal crustal changes just before an earthquake, which it has been said in Japan, would be impossible to detect by the existing measurement methods. If one can detect pre-slip a few days before an earthquake, it would be really helpful in alerting people to be better prepared for evacuation. The pre-slip can become clearer if one checks the daily height changes over two years at critical points. Figure 11 shows the daily changes of X, Y and Z over two years at Kesennuma at the most critical location in which dramatic falls in the X, Y, Z values can be seen on the last three days (March 8, 9 and 10) before the Earthquake. In particular, the largest fall of 3 cm occurred in the Y values over these three days. Figure 12 shows very clearly the height changes at the 10 worst points with large preslips on the last three days. A reason why the Y values showed the maximum pre-slip can be explained as follows. Firstly, the Pacific coast of the Tohoku District which is almost parallel to the Japan Trench (a border between the Pacific Plate and the North American Plate), and the direction of which almost coincides with that of the Y axis as shown in Figure 13. Secondly, the increase of the Y value means a movement upwards and to the west with an oblique angle to the horizontal direction, while a decrease of the Y value means a movement downwards and to the east with the opposite direction of the oblique angle to the horizontal direction, since the Pacific coast at the Tohoku District is located roughly on a longitude meridian of E 142°and 52°east along the Y axis. The actual movement of the Pacific coast at the Tohoku District during and after the Great Earthquake consisted of a south-easteast horizontal movement and downward vertical movement, which is almost equivalent to the decrease of Y values.
Accumulated changes during two years
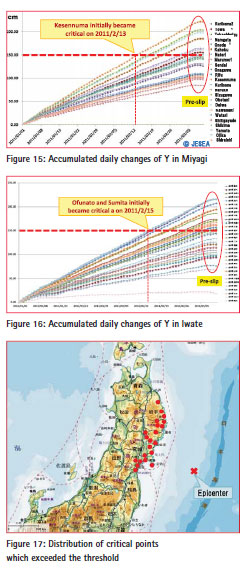
In order to find the most appropriated indicator to determine the critical areas and alert timing before the earthquake, the accumulated changes of X, Y, Z and H during two years in the three prefectures were checked. A comparative study was also conducted to determine the best parameters out of X, Y, Z or H which best fit the critical points shown in Figure 3. The accumulated daily changes of X, Y, Z and H in Miyagi Prefecture are shown in Figure 14. The red line in the figures shows zero level for each parameter. The accumulated X values show little correlation between the larger value and the critical areas, and does not seem to be the best parameter. The accumulated Y values above a threshold of 150 mm are most strongly correlated with the critical points, while the accumulated Z and H values show little correlation. The Y values may show the accumulated deformation energy. In addition, Y values show more clearly the pre-slips in the last three days as shown in the figure. Figure 15 shows the enlarged graph of the accumulated daily changes of Y values in Miyagi Prefecture, where a threshold of 150 mm was set as a signal that the deformations had reached a critical situation though the threshold is not based on a theoretical approach, but just trial and error. The authors adopted 150mm as the threshold because the value showed best fit to seriously affected areas. The Y values initially exceeded the threshold of 150 mm at Kesennuma on February 13, 2011 about a month before the Earthquake. Several GNSS-based control stations in Iwate Prefecture also exceeded the threshold, as shown in Figure 16. Those points where the Y values exceeded the threshold of 150 mm are Kesennuma (222 mm), Shizugawa 204 mm), Ojika (198 mm), Kahoku (185 mm), Oketani (162 mm), Yamoto (161 mm), Towa (155 mm) and Diawa (151 mm) in Miyagi Prefecture and Ofunato (215 mm), Sumita (215 mm), Kawasaki (215 mm), Iwaizumi (207 mm), Kuji(194 mm), Hiraizumi (186 mm), Daito (174 mm), Taneishi (172 mm), Mizusawa (163 mm), Yamada (161 mm), Miyako (157 mm), and Kawai (157 mm) in Iwate Prefecture. Figure 17 shows the distribution of the critical points, which are located mostly in the regions seriously affected by the Great Earthquake. The location of critical areas could have been predicted from the accumulated values of Y in this case.
Consideration
This validation study was made not in advance of, but after the Great Earthquake. Therefore, there is no assurance that it would be possible to apply the same method in advance for predicting other earthquakes, as this case might be a very special one. However, one can at least obtain a hint of how GNSS data could be useful for predicting earthquakes based on various indicators computed from GNSS data.
The following problems are identified for future development of the prediction method.
1) The location and the intensity could be predicted from GNSS data as indicated in this paper, but the exact date of earthquake occurrence cannot be predicted well. The calm period after several pre-signals cannot be estimated. In this case, there was a period of about 6 months after the first pre-signal before the Great Earthquake.
2) It would be possible to determine the best fit indicator to detect critical areas in advance for considering or estimating the direction of deformation by an earthquake. The validation in this paper showed the best fit to the accumulated Y values correlated well with the movement of the Pacific coast at the Tohoku District. In the case of the different types of earthquakes and different crustal conditions, the best fit indicator would be different.
3) The pre-slip was detected after the Earthquake as the GNSS data was only obtained after the event. However, it is difficult to obtain near real time GNSS data (called R3 data), because GSI does not release such data to the private sector. Open data but with two-week delay will be too late to detect the pre-slip.
4) The long term indicators in this paper are based on a two year span for convenience, but it would be better to determine the averaged normal trend curve for several normal years.
Conclusion
It is possible to detect presignals and pre-slips with GNSS data before an earthquake as demonstrated from the data acquired prior to the Great Earthquake. This is a new development in earthquake prediction. Not only short term indicators, but also long term indicators are necessary to detect pre-signals. Simultaneous dramatic changes at multiple points enable the identification of pre-signals.
These pre-signals were detected not only over a narrow area, but also a much wider area in case of this huge earthquake. Accumulated daily changes of Y over two years were the best fit indicator to predict the most affected areas in this validation study.
Acknowlegements
The authors deeply express thanks to Geo-spatial Information Authority (GSI) for providing open GNSS data on the Internet. The authors also thank Mr Toshihiro Kitta, President of JESEA and also Mr Toshihiko Tanigawa, Executive of JESEA for supporting the validation study. We also thank Prof Dr John Trinder for editing the language grammar of this paper.
Reference
Murai, S and Araki, H: Earthquake Prediction using GPS, GIM International, Volume 17, No. 10, October 2003
Murai, S and Araki, H: Prediction of Earthquake and Volcanic Eruption using GPS Data, Asian Journal of Geoinformatics, Vol. 4, No.3, March 2004
Murai, S and Araki, H: Was early warning of Sumatra earthquake possible? Coordinates, Volume 1, Issue 2, 2005.7, p.8-11
Murai, S and Araki, H: Was there any pre-signal of Pakistan earthquake? Coordinates, Vol. 2, Issue 4, April 2006, p6-7 Murai, S and Araki, H: Crustal Movement before and after the Great East Japan Earthquake, Coordinates, May Issue 2012
Homepage: http://terras.gsi.go.jp/gps/gpsbased_ control_station.html (Japanese) Homepage: http://www.jesea. co.jp (Japanese)


 (6 votes, average: 3.67 out of 5)


Leave your response!