| Applications | |
Spatial analytics for a resilient and low carbon urban India
Optimum use of land and natural resources, lifestyle for environment and new partnerships are critical elements of a resilient, low carbon habitat |
 |
|
Abstract
Urban India is passing through a rapid physical and socio-economic transformation leading to increasing carbon footprints, climate change and disasters. There are conflicts among spatial planning and sustainability due to chronic peripheralization, increasing pollution, transport, energy, land and water consumption. It needs relooking at the repertoire and processes of urban development which should shift from fossil fuel era to the circular concepts of urban planning, renewal, recycling and conservation of natural resources. Leapfrogging in the areas of fourth industrial revolution by using remote sensing and IT tools would help in making the cities resilient, pollution free and carbon negative.
Introduction
Climate change has become an imminent reality with a rise in global temperatures, changes in rainfall, floods, droughts, air pollution and water shortages. With increasing traffic, wastes and stubble incineration, fossil fuel usage, carbon footprints and growing air conditioning, adversely affecting population’s health and productivity and decline in agriculture yield. This may cause an increase in incidences of droughts, floods, cyclones, earthquakes, pandemics, urban heat islands and changes in microclimate due to radiant energy in the earth’s atmosphere. India continues to suffer from deadly air pollution in the North, while the South is inundated by catastrophic floods (November 2021). This calls for rethinking the paradigms of urban development and use of spatial analytics, remote sensing and IT tools to address the threats of climate change, pollution and disasters.
India’s Perspective at the COP 26 (2021)
In 2015, the Sustainable Development Goals (SDGs) were adopted by the United Nations, which were signed by 193 countries, including India. The United Nations Conference of the Parties (COP 26) in Glasgow (November 2021) deliberated upon various measures to limit global warming to 1.5 degree Celsius by the year 2100. Indian delegation led by PM Narendra Modi put forward the need to scale up clean technologies and formation of the International Solar Alliance (ISA). Under this, One Sun-One World -One Grid envisions an interconnected transnational solar energy grid. The COP 26 agreed to reduce the use of fossil fuels and coal by new sources, such as green hydrogen, green metals, carbon capture, solid state batteries, electric fuels, heat pumps, electric and hydrogen powered transport and next generation solar PV. PM Modi put forward his five-point agenda at the conference, and informed that India’s non-fossil fuel energy will be raised from 160GW at present to 500 GW by 2030 and 50% of the power requirement will be met by renewable energy. The Union Budget (2022-23) has allocated Rs. 19,500 crores for solar modules under the products linked incentives (PLI) scheme. This will reduce the carbon intensity of the economy to less than 45%. India will achieve net zero emissions by 2070 by clean technologies, like electric transport, ethanol blending in gasoline, solar photovoltaic and batteries. These technologies would play a critical role in India’s decarbonisation. India has also led the formation of a global Coalition for Disaster Resilient Infrastructure (CDRI) and Clean Energy Ministerial Industrial Deep Decarbonisation Initiative (IDDI). PM Modi underlined at the COP 26 that there is a need for a mindful balance between development and environment.
Reimagining urban planning
Carbon footprint is the total set of greenhouse gas (GHG) emissions, mainly from energy, industries, transport , solid and liquid wastes, agriculture and forestry. Linked with it is the phenomenon of climate change and disasters, which impact health, infrastructure services, housing and livelihoods. These need to be resilient.
Resilience is defined as “the ability of a city as a socio-ecological infrastructural system and its components to absorb and recover from shocks whilst retaining the essential functions and adjust to stresses to reorganise, develop, and transform in order to adapt to socioeconomic and environmental changes, over temporal and spatial scales”.
This implies certain basic changes in the planning and urban processes, which are resilient and reduce the use of natural resources and energy. These should conform to net-zero energy and water standards, thrift consumption and doing more with less.
According to UNISDR, the Disaster Risk Reduction (DRR) related activities comprise planning regulations, plans and development activities; setting up institutional structures dedicated to DRR; constructing or enhancing hazardmitigating infrastructures, along with education/awareness/training programmes.
Spatial analytics
Operationally useful and time bound information is the basis of the planning process. As such, it is important to identity appropriate indicators and their sources as integral elements of developing an interactive and flexible approach for information collection, rather than rigid statistical methods. This involves working out flexible check lists and semi-structured cross examination of various sources of information. The salient features of such an approach are as follows:
a. to collect digital information by new methods, such as Satellite Imagery, Drone Surveys, Total Station Surveys, UAVs, National Spatial Data Infrastructure (NSDI), National Resources Information System (NRIS), etc.
b. to relate information and inputs with reflective observation, conceptualization and experimentation.
c. to recognize the limitation of optimal ignorance and appropriate in precision.
d. adoption of triangulation process for a three-dimensional perception.
e. proxy indicators as an aid to information and perceptive understanding,
f. quality control vs quantitative/ statistical approach.
g. use of GIS and digital tools
h. recognizing the principle of “less is more” (time/information/resources).
As the basis of the planning, the following information is necessary:
i. Physical: such as land required, location, access, land ownership power and water, services, raw material, markets etc.
ii. Environmental factors: such as, pollution, EIA, carbon emissions and reduction, waste management, water recycling, energy efficiency etc.
iii. Organisation, Management and Legal issues, such as laws, rules, regulations, labour , organizations involved, contracting, completion, regulatory system, political support, timelines, etc.
iv. Technology: level, import potential, skills, safety retrofitting, repair, maintenance, impact, etc.
v. Finances and other resources, such as institutional finance, taxes, human resource, subsidies, cost benefit, market potential, pricing, etc.
vi. Service Delivery: consumers, society, local community, jobs, etc.
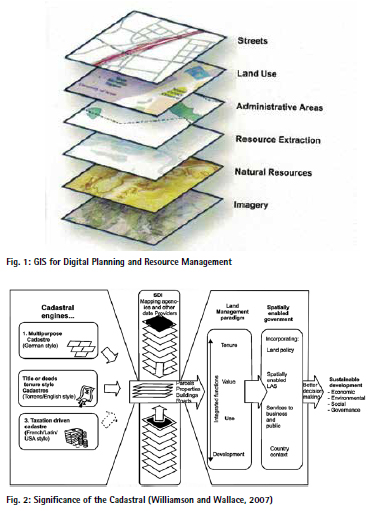
Once the spatial and attribute data are generated in GIS frame, their applications are many and varied. These include resource inventory and management, planning and monitoring, land records for taxation and ownership controls, facilities and services management, and environment impact assessment. GIS is being used for planning of various cities in India lately. Preparation of Digital Plan using RS & GIS can be undertaken in different layers for resource management and implementation. The cadastre map for planning is usually drawn on Survey of India sheets and the Satellite Imageries. Various information is superimposed on it from the cadastral maps, revenue records, plans and schemes of government agencies like service departments, Industrial Development Corporation, Public Works Department, Railways, National Highways Authority, etc.
The existing land use map incorporating the land use from the satellite interpretation and revenue records is taken for ground verification. The amount of ground verification varies from 15 to 50 percent. The Indian Space Research Organisation (ISRO) provides interpreted satellite imageries, thematic data and other services for urban and regional planning to the government agencies.
By utilising the Bhuvan portal the planners can create new data layers for the non-conforming land uses to assess the deviation between the previous approved Proposed Land use plan and the existing situation. Since the mapping has been done on GIS, temporal variations from the latest remote sensing imageries can also be superimposed. Such data can be uploaded on Bhuvan portal for public viewing. Both attribute data and pictorial data can be collected from the field through the app and uploaded on a centralized data base.
Collecting the data
There are two kinds of data sourcesprimary and secondary. Primary data are first-hand information, gathered from original sources, for instance through interviews or going out and directly observing the phenomena that is being studied. Secondary data, such as collected by the Census of India provides such information.
Interviews
They can be face-to-face or by internet or telephone. Face-to-face interviews are more accurate, but any sort of interviewing is expensive. Interviewers must be trained and since one-shot surveys cannot hire full time interviewers, staffing a survey is difficult. In these circumstances, survey research centres, often affiliated with universities, are frequently used for survey and research.
Direct inspection
The direct inspection of conditions or activities is employed in making traffic counts, recreation area use surveys, housing quality studies, and many other kinds of surveys where human communication is not required to elicit the information directly. However, this is not always as easy as it sounds. A wellknown direct technique is participant observation. The techniques was developed by anthropologists in the study of community life. The surveyor becomes a resident of the community and lives among the people, learning their way of life by participating in it. It has been very effectively used by some social scientists to investigate the urban problems.
The choice of techniques rests primarily on two criteria-time and cost, both of which we always want to minimise but often reducing one results in increasing the other. This poses the need to strike a balance of the two. This means that each question should relate to its core purpose, such as the variations in the population being surveyed. This needs careful design and structuring the questions of a survey.
A sample, properly chosen of some fraction of the whole is usually adequate to estimate the information for the whole population. If the population to be surveyed is very large and the sampling proportion is small then a test run will allow the adjustments in sample size or number of questions. It also helps to spot the ambiguous questions, areas of misinterpretation and poor layout of the form. When surveys are conducted, some system of monitoring is advisable to discourage improper practices.
Multiple index surveys
To assess the particular aspect or condition, such as poverty, the multiple index system can be adopted by means of a sieve map (or quantitatively by calculating average multiple index). This may help to determine the areas having worst (shown by incidences of all the bad factors), moderate (few bad factors) or fair (no bad factors) conditions.
Average Multiple Index is calculated for different areas, which can be given different weight depending upon the gravity of a factor in contribution to condition of buildings, poverty or environment.
Transect
Transect as a schematic device can be extremely useful to obtain an overview of a particular area and its problems and issues. This is a diagrammatic illustration and record of major characteristics, events, profiles or issues. While conducting windscreen or triangulation reconnaissance, freehand transects can be prepared, which can supplement the records.
Proxy indicators
Proxy Indicators are short-cut to time consuming data collection and an alternative to unstructured observations. Information about these indicators may be readily available, which has to be applied on the basis of past experience, common sense and certain assumptions. For example, the growth in the number of banks in an area may indicate its economic base or a greater number of fast food restaurants may represent a youth dominated society or business.
Quality of information
Accuracy, timeliness, reliability and cost effectiveness are important qualities determining the usefulness of data for planning and formulation of policies. These factors should be kept in view while collecting the data. To collect quality information, the key informants should be selected carefully, so that those who are knowledgeable are approached. In addition to public agencies, other sources of information, viz. cooperatives, resident groups, women’s organizations, traders associations etc. can also be useful to augment information obtained from primary and official sources. Secondary sources of data, such as reports and literature can also provide useful information. The information should be triangulated and integrated – synoptic/ sectoral data with local/ ground level studies and provider’s perception with that of the consumers.
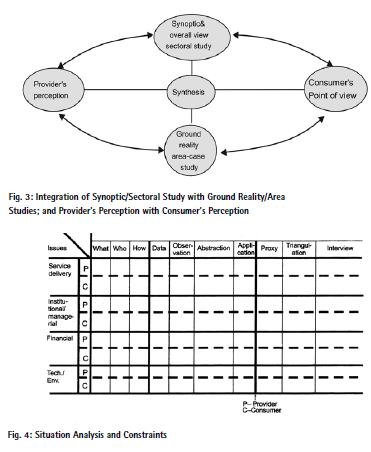
Triangulation
Triangulation is an important method to cross-check information obtained from different sources. Multi-disciplinary teams are useful in triangulation, so that the data and information can be cross-checked by observation, discussions and by interdisciplinary perspectives. This way, the reliability of information obtained through rapid surveys/ appraisal can be enhanced.
Exploration
A preliminary visit can be very helpful to work out a handy semi-structured check list and a framework of indicators for actual survey. Simultaneously, a semi-structured questionnaire for interviews with people and organizations concerned can be prepared. The information thus obtained should be triangulated from time to time to make sense out of it. Information related with observations can be transformed into abstractions, which should be crisp and clear so that it can be digested, codified, analysed, and synthesized.
Triage
Triage is a useful method for assessing social, economic, institutional and technical performance of alternative options, systems or technology. It is particularly concerned with the technical aspects and design process and, therefore, is relevant for project planning and design. Under this method, various components of a system are given a score and a screening-criteria is evolved. For this, the results of the system and performance are reviewed and scored as low, medium or high, as case may be.
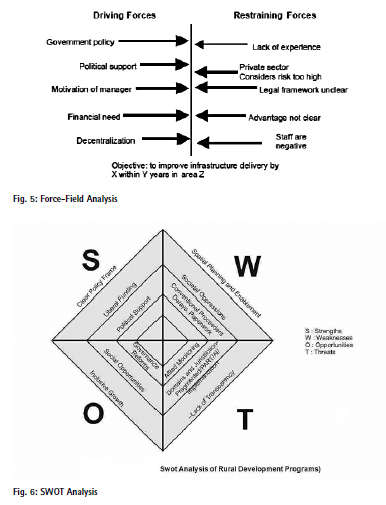
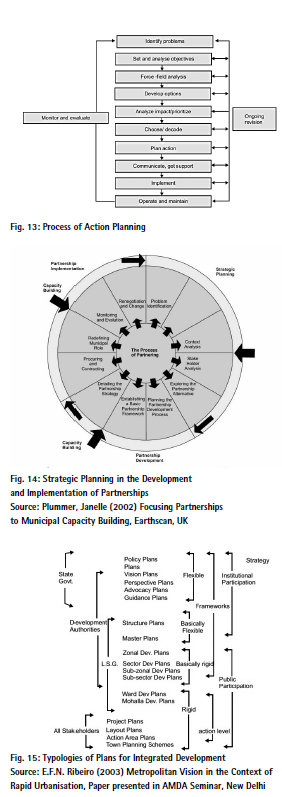
Force-Field analysis
Force-field Analysis is a well-established management tool. It allows the analysis of a problem, or an opportunity in a manner that helps to generate innovative but realistic actions. The actions generated may range from use of certain technology to manpower development and choice of partners in development. It has become an appropriate tool to develop innovative solutions to urban problems, such as better use of private sector participation to improve urban services.
Strategic issues identification
Many enterprises, whether infrastructure, industrial or business end up in failures. While the success stories become the talk of the town and the media, no one knows what happened to other 90% of failures. It is common to blame the political system, interference, corruption or red tape for the failures and troubles, while the planning and management pitfalls are underplayed. However, ‘politics’ in a democratic set up is part of the management and cannot be wished away. It works both ways-political alignment and interventions can speed up the project or kill it. The fact is that initiating a large infrastructure project involves a complex cohort of risks, clearances and interventions, such as obtaining licences, loans, land, labour, technology, public services (like power, water), environment impact assessment, etc. In order to obviate the unforeseen problems, which may adversely delay or stall the project, it is necessary to make a detailed study of the strategic issues which are critical for smooth operation of the project. This helps to troubleshoot the critical problems that could be anticipated. Some of these can be nipped in the bud through initial planning and legal framework, rules and regulations, agreements, etc.
Impact analysis
The purpose of impact analysis is to assess the impact of a particular service, project or facility. A preliminary impact analysis may be essential at the planning stage. For this, the intended or planned activity is placed at the centre and its direct and indirect, positive and negative results are listed in the boxes around the activity. The arrows linking various boxes indicate the linkages, directions and causes. The effects may be comprehensive, which can be categorized under physical, environmental, social, economic, political, institutional, legal and other impacts. For example, the impact of intended regularization of unauthorized colonies can be analysed by evolving a set of Impact Diagrams, such as given below:
Economic-how is the plan likely to impact economically. This includes its effects on employment and on business in the plan area and also at a broader level, e.g. the city or region.
• Social-what will be the impact on social organization?
• Political- Is the plan likely to have political repercussions?
• Environmental-what will be the environmental impact of the plans-both within the site and at a broader level?
• Cultural-Are the plans sensitive to existing culture? Are they likely to have an impact?
All these questions need to be answered both in terms of short term and long term impact.
Sustainability analysis
Sustainability is a key consideration in working out a policy and plans for urban development. For this at various stages, key areas involved in planning and implementation are listed, such as energy, water, building construction, waste management, greenery, noise, safety, etc. Against each, major issues are identified with their possible solutions. This allows assessing the proposal with the norms and exploration of possible options.
SWOT analysis
Evaluating strengths, weaknesses, opportunities and threats. Often, we realise that strategy falls short of the plans. This may be due to ad-hoc decisions, political, societal, or legal pressures or financial constraints. The SWOT analysis aims to visualise various weaknesses and threats, for which pre-planning may be necessary.
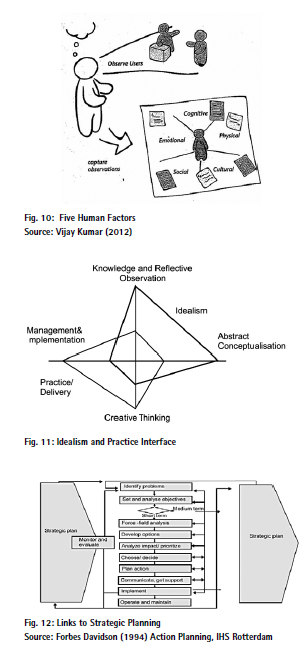
People, Objects, Environments, Messages and Services (POEMS)
The POEMS framework is an observational research framework to make sense of the five elements, i.e., people, objects, environments, messages and services. These help teams to think about context as systems of related elements by a note taking template to record and categorise the observations (notebooks, cameras, pens, recorders, etc.).
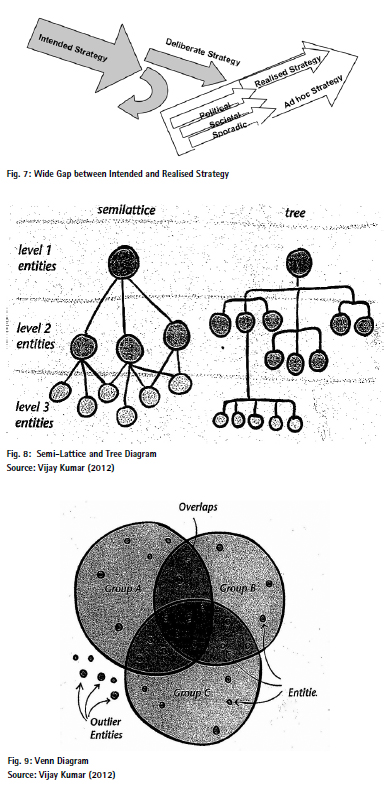
Tree/Semi-Lattice diagramming
The Tree and Semi-Lattice Diagrams are used to analyse the hierarchical nature and relationship among entities. In this dots or circles represent entities and lines show connections, hierarchy and understanding the differences for getting insight about the context.
Venn diagramming
Venn diagramming is an effective method to analyse the overlaps between two or more clusters of entities. Venn diagrams use visualisation with overlapping circles. The interior of the circle represents the entities in the cluster, while the exterior represents entities that are not members of the cluster.
Remote Research uses online research tools, such as given below:
• Experience Simulation engages peoples in simulated experiences to understand what matters to them.
• Users Response Analyses to understand patterns and drive insight
• ERAF System Diagram to analyse Entities, Relations, Attributes and Flows
• Strategy Roadmap- Planning solutions for short-term, mid-term and long-term, integrating information, processes and work flows
• Trend Matrix summarises changes that leads to future direction
• Solution Database involves organising the concepts and solutions in a searchable database
• Five Human Factors (physical, cognitive, cultural, social and emotional factors) are considered to synthesise the elements of remote research.
• Behavioural Prototype involves simulation to understand user behaviour
• Insight Clustering Matrix aims to understand the insights and showing their relations and hierarchies
Conceiving holistic solutions
Shifting from parts to whole, the objective is to look holistically at the individual concepts. Specialised teams talk through different possible configurations, concepts and evaluate which of these are optimal for a given context.
Concept generating matrix
It involves inter-relationship among various data, attributes and processes, and seeks to balance knowledge, abstraction, creative thinking/ideation and practice/ implementation. This may comprise the following tools
• Principles and Opportunities
• Mind Map
• Value Hypothesis and Ideation
• Concept Generating Mapping and Scenario
• Concept Metaphors and Analogies
• Concept Prototype, Sorting, Cataloguing and Matrix.
Morphological synthesis
The concepts lead to a systematic synthesis of plans and strategies by a series of steps, such as given below:
• Deep Learning and Artificial Intelligent Models
• Building Information Modelling (BIM)
• Concept-Linking Map
• Foresight Scenario
• Solution Diagramming, Prototypes and Evaluation
• Planning Roadmap
• Action Plan and Strategic Planning,
• Assessment and Monitoring of Technolegal Constraints and Resources.
India’s urban missions
Since 2014, the Government of India has launched several new urban missions, viz. Smart Cities Mission, Atal Mission for Rejuvenation and Urban Transformation (AMRUT), Pradhan Mantri Awas Yojana, Historic City Development and Augmentation Yojana (HRIDAY) and Swachh Bharat Mission (SBM). The SBM 2.0 and AMRUT 2.0 continue to operate with effect from October 2021. The plans for these missions including 500 cities under AMRUT have adopted the technique of Geodatabase Creation, GIS based Master Plan Formulation and Capacity Building. An MOU has been signed between National Remote Sensing Centre (NRSC), Department of Space and Ministry of Housing and Urban Affairs for Geo-database Creation.
These missions aim at low carbon urbanisation and the provision of core infrastructure services like water supply, sanitation and solid waste management, efficient urban transport, affordable housing for the poor, 24×7 power supply, IT connectivity and e-governance. These missions emphasize upon participatory planning and governance, livelihoods, connectivity and providing better education, healthcare, urban safety and smart services, which are intelligent, interconnected and instrumented.
Resilient and low carbon cities
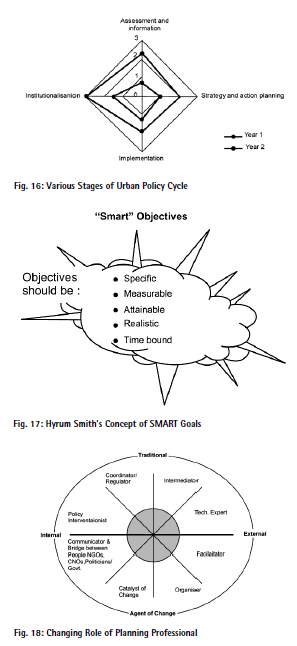
The cornerstone of making a city resilient and low carbon is to adopt an integrated approach towards ecology, the conservation of the natural resources and sustainable urban development, including the services like drainage, water supply, air, sewerage, solid waste management, transportation and energy. The planning typology can be segregated as per the domain (Government, Development Authorities, Municipal Government, PPP, etc.), levels (Local, Zonal, Master Plan, Policy Plan/Regional Plan), time frame (short, medium and long term). At every stage public and institutional participation is necessary together with sustainable, resilient and low carbon development. This involves the following:
• Local Economic Promotion and Jobs
• Reducing urban footprint
• Biodiversity, Greenery and Amenity Spaces
• Urban Heat Mitigation
• Water Conservation and Management
• Decentralised and Intelligent Services
• Air Quality Management
• Clean Transport and Transit-Oriented Development
• Green Energy
• Green and Resilient Buildings
• LIFE- Lifestyle for the Environment
These targets involve setting up of SMART goals which are specific, measurable, attainable, realistic and time bound. The new paradigm also needs a basic change in the role of planners from a technical expert to facilitator, communicator, and a catalyst of change. The thrust on strategies and action planning requires working out new mode of partnerships, financing and resource optimisation (including human resource and time).
In this digital age, all round disruptions are happening. In India the 20 year model of Master Planning was adopted during the 1950s which does not address the emerging problems of climate change, air and water pollution, public health, employment and disasters. It is also incongruent with the objectives of speed, scale and sustainability. It is necessary that urban and regional plans are prepared for a five year horizon, while their vision may extend to 20 years.
Local economic promotion and jobs
In India, the cities generate the country’s 60% of GDP and 70% of the jobs. With Covid 19 pandemic, climate change and diminishing jobs, the factors of public health, creation of jobs, environmental sustainability and climate resilience have emerged as the key issues. A target of 10 million jobs in urban areas can be achieved in next five years by development of janta markets, workshops/ sheds, kiosks, shops, small offices, etc. At least 10 per cent area of shopping/commercial centres may be reserved for the informal sector (street vendors, kiosks, fruit and vegetable stalls, etc.). The residential areas also need a higher level of mixed use and the rationalisation of FAR/FSI, height and densities.
Reducing urban footprint
The urban footprint needs to be reduced so that it leads to travel reduction, economy of services and conservation of agricultural areas. The Indian cities have an overall density of 100 to 240 PPHa, which can be selectively doubled along public transit corridors, excluding the archaeological, heritage and conservation zones. The focus has to be on redevelopment of the brownfields, infrastructure services, transportation, public greens and facilities. The urban eco-system must be compact and dense. The urban planning, governance, businesses and industries have been transformed by fourth industrial revolution. The processes need to change which are compatible to circular economy by adoption of new technologies, such as digital blockchain, LADM framework, combinatorial and discrete optimisation, algorithms, complexity theory, artificial intelligence, big data, and the ubiquitous cloud.
A digital ledger is a geographically distributed database that is shared and synchronized across a network of the participants. It has a blockchain structure where the data is stored in blocks, linked and secured by cryptography for handling identities, contracts and assets. The blockchain is an electronic transactions system. It is based on a hash algorithm that converts data into a block. Digital Blockchain system for land management is indispensable for land pooling schemes in order to curb the frauds and power of attorney transactions, which are very common in urban and rural zones.
The Land Administration Domain Model (LADM) is an International Standard (IS) of the International Organisation for Standardization. It covers basic information related to components of land administration and includes agreements on administrative and spatial data, land rights and source documents (e.g. deeds or survey plans), and forms of tenurescustomary tenure, government land, and privately held land.
The LADM, assigns the class and contains the Rights, Restrictions and Responsibilities., which are the basis of land adjustment and registration. Digital distributed ledger technology can simplify the complex and open to manipulation paperwork used for property records. As blockchain is immutable and not easily vulnerable to hacking, title records will become verifiable and simple in establish a clear chain of legal ownership.
Biodiversity, greenery and amenity spaces
A study of the present land use pattern in India indicates shortfall of land under forests and greens, while the lands under agricultural use are being increasingly converted for the highways, airports and settlements. It is estimated that an additional 2 to 3 million hectares would be required for human settlements during next 10 years. Sacrificing agricultural land for habitation implies reduction of land for producing food. The lands that sustain agriculture, biodiversity, surface water and groundwater, fragile and sensitive areas, coastal zones, etc. need protection and conservation.
In a city an overall area of 10 sq. m of greens per capita should be reserved for public greens at city, zonal and local levels. In built-up areas reservation of open space can be done by adopting appropriate regulations for redevelopment. The Government of Maharashtra has notified the regulations for Provision of Amenity Spaces and Open Recreational Spaces under Unified Development Control and Promotion Regulations (UDCPR 2020). These provisions oblige that a minimum 10% of space is reserved and provided in plots more than 4000 sqm against additional FSI or TDR for garden, playground, and/ or for a municipal school, hospital, fire brigade and housing for affected people.
A system of landscaped linkages connecting various parts of the city, water bodies and monuments can provide a sense of oasis and shelter from oppressive climate. Peripheral green belts can act as wind breakers, filters of SPM and dust-storms. The green buffers with indigenous trees, land formations, mounds, embankments, etc. a l s o provide effective barriers to transmission of noise.
The development of greenways can be integrated with the water bodies, drainage corridors and harvesting ponds, reservoirs and by sediment traps in the catchment zones. In water deficient, dry areas the landscape can be in form of Xeriscaping, which can reduce total water demand by as much as 50 to 90% by micro- just- in -time irrigation. Vertical gardens and urban farming can provide relief in the dense areas.
Urban heat mitigation
In a dense built up area air rises over the warmer city and settles down in the cooler environs. The hot air dome and its effect on microclimate may persist until wind or rain disperses it. Increased aerodynamics of built-up areas cause rapid deceleration of wind compared with open countryside. It has been calculated that wind velocity within a city is half of what it is over open land. At the town edge, it is reduced by a third. The mutations and reservation of greenery and open space in windward direction and cooler surface materials (roads, parking, buildings, roofs, etc.) help in mitigating the effects of urban heat island.
Water conservation and management
Water scarcity has become a persisting problem in Indian cities due to climate change, pollution of rivers, water bodies and massive construction. Several cities in India have become water stressed. Only 18% of the renewable water resource is being recycled, while 10% of the annual rainfall is being harvested in India. The issues of concern are increasing coliform levels and Bio-chemical Oxygen demand (BOD) in surface waters and increased concentration of nitrates in the groundwater. To overcome these problems, water sources need to be protected by sanitation/sewerage interception, and recycling and treatment of wastewater. Water resources can be augmented through recharging of groundwater and by rainwater harvesting (not only in building, but also on roads, parks and parking areas) along with conservation of rivers and water bodies, water efficient taps/fittings, dual plumbing, curbing Non-Revenue Water and recycling of wastewater. Blockchain and SCADA systems can help in 24×7 water supply of potable quality.
Decentralised and intelligent services
Surveys reveal that approximately 40% of urban population in India is not covered by sewerage, sanitation, drainage and solid waste disposal. Various alternative technologies, based on decentralized systems should be explored. The use of IT, simulation, blockchain and automation can make the services smart and intelligent. The common method of land filling for solid waste disposal is an environmental disaster. Instead, decentralized systems based on 5 R strategy of reduce, refuse, reuse, recover and recycling should be explored. Three bins provide separate bins for trash, recyclable and compost. Collection charges drop as trash drops. Biotechnology, enzyme based STP, bio-remedial treatment, vessel system, sludge gas/energy recovery, vermiculture, fossilization and compositing options can be adopted for solid and liquid waste management. Underground pneumatic conveying systems can be adopted, which are more hygienic, economical and avoid movement of trucks for transportation of wastes.
Common utility ducts or tunnels carrying electricity, water, sewerage, wastes, cables and broadband internet minimize damage from traffic, road repairs, rains, etc. A series of low carbon zones across the city with co-located tri-generation energy systems (combining power, cooling and heating), and automated, segregated waste collection and recycling can lead to bundling ‘green infrastructure’ together.
Air quality management
Air quality in Indian cities is deteriorating due to indiscriminate use of fossil fuels and vehicular and industrial emissions. According to the surveys conducted by the CPCB ambient air quality in more than 20 Indian cities have reached a very critical situation. Relatively high levels of suspended particulate matter, dust, SPM, SO2, NO2, CO2 and heavy metals, including lead content in the exhaust of automobiles and scooters, have been observed. The recent changes in the fuel like electric and hydrogen powered vehicles, adoption of clean technologies, new emission norms, development of shared taxis, NMTs and mass rapid transport system can reduce the pollution levels due to vehicular emissions. Airshed planning, continuous ventilation, use of cooler and light shaded surfaces/ materials and water spray are some other methods to reduce air pollution
Air quality data is significant to gaining a thorough understanding of local air pollution. Recent technological advancements have made it possible to gather data, with low-cost monitoring devices and advanced methods of collating and analysing it. This helps to gain an understanding of pollution levels, their causes and effect.
Now-a-days smart electricity poles with sensors are available to monitor pollution parameters along with light, CCTV, wi-fi, etc. The NDMC has been using them in New Delhi. Citywide air quality monitoring networks can provide the data of air quality.
The Google plans to map street by street air pollution that will be available to the common man. The active sensors will measure CO2, CO, NOx, NO2, ozone and particulate matter. CEMS and Air quality Data can be used to identify major components, sources, quantification and projects. It can also help the government to apply monetary incentives and penalties for polluting companies. This can also be used to introduce a cap-andtrade system, instead of the existing ‘command-and-control’ regulations. The data can be used to analyse the issues, sources and project various options and actively schedule to assign the responsibilities, project management, including timelines and monitoring.
Clean transport and transit oriented development
Prime Minister Narendra Modi, while inaugurating the Global Mobility Summit in September 2018, encapsulated 7 Cs of mobility-common, connected, convenient, congestion free, charged, clean and cutting-edge. He underlined the need to use clean energy for transport as a powerful weapon against climate change, along with pollution-free clean drive. He championed the idea of clean kilometres which could be achieved through bio-fuels, electric charging and hybrid electric vehicles. The MOHUA has issued the Metro Rail Policy (2017) and Transit Oriented Development Policy (2017) which provide guidelines for promoting urban public transit with private sector participation.
As urban transport contributes nearly twothirds of the total suspended particulate matter and 18 per cent of carbon emissions, it is time to think of sustainable modes of transit. It may be necessary to provide Integrated Transit Corridors (ITC) integrating BRT, Metro and trains together with pedestrian and cycle lanes. These can be flanked by public, semipublic, high-density developments. Metro, trains, sub-way and primary roads can run underground for easy bike and pedestrian traffic on the grade. Multimodal integration, last mile connectivity and e-governance are the pillars of sustainable urban mobility. River/water transport and ropeways can be explored which are almost pollution free and costeffective. Besides controlling growth of private vehicles, it is necessary to explore parking space in stilts, multi-level puzzle/ skeleton structures, on roofs and in underground spaces. Seamless multimodal public transport system comprising bus rapid transit and rail-based mass transport system would work better by adoption of single ticketing and restructuring of land uses by transit-oriented development. Subterranean garages near commuter destination reduce the need for ground parking. Digital parking meters tell mobile phone when a space opens up, reducing traffic caused by drivers trolling for space. The concept of walk to work should be the basis of urban structure and city size.
The concepts of cordon pricing, minimum occupancy vehicles, ceiling on new registration of private vehicles and establishment of a Unified Metropolitan Transport Authority can also contribute towards a sustainable and clean urban transport.
Green energy
Energy scenario in India is characterised by its increasing demand, which has been growing at the rate of about three times the population growth rate in the last two decades. Low carbon energy can be derived from renewable sources, such as biofuels, wind, tidal and solar power. The concept of energy efficiency, renewable energy and Zerofossil Energy Development (ZED) can reduce the energy demand and consequential pollution. The renewable energy not only helps in energy generation, but also in a pollutionfree environment. Smart Micro-Grids, Distributed Energy Systems (DES), Micro-Districts and Anchor Microgrids should be linked with renewable energy network and energy efficiency.
The energy guzzling air-conditioning can be avoided by innovative methods like Net Zero Energy Design, variable refrigerant volume (VRV) system, earth air tunnel (EAT) and thermal storage. By HVAC and EAT systems inside temperature of a building can be maintained within 27 degree Celsius during summer and 19 to 24 degree Celsius during winter. Lower ambient lighting with bionic controls and integration of natural light with high performance glazing combined with light sensors can save energy use in a building. Optimum glazing design can also help to reduce glare. Synchronized lighting and bionic climate control systems can be designed to match building loads and schedules, which are segmented into multiple zones to allow intelligent controllability. Green roof, light coloured finishes and insulation can help to reduce energy demand.
Green and resilient buildings
A low carbon and green building aims to be sustainable, comfortable and net zero. The heating, lighting, cooling, ventilation, and powering of buildings are responsible for approximately 40% of the total energy use. As buildings are the largest energy users, incorporating energy storage into them will increase the resilience of the total energy distribution network and enable widespread use of renewable energy. By passive design the building can be more climatically comfortable. It is necessary to specify building materials which are locally sourced and recycled from construction and demolition wastes, that have low embodied energy and require less energy for production and transportation to the site. Such materials include carbon-negative cements, low carbon steel, fibre The alternatives to steel reinforcement for bridges and buildings with low carbon emissions include basalt, fibre composite bars, bamboo, etc.
Building Information Models (BIM) can simulate the entire construction sequence beforehand addressing sustainability issues and reducing carbon emissions. Computer- Aided Manufacturing (CAM) and Computer Integrated Manufacturing (CIM) are useful in reducing emissions, dust and GH Gases. The simulation of construction process enables better control of time, machine, expenditure and the manpower, and could reduce carbon emissions, costs and time by half to one-third.
LIFE- lifestyle for the environment
Prime Minister Narendra Modi at COP 26 (Glasgow) has spoken of LIFE or Lifestyle for the Environment. The vision of sustainable production and consumption has to be based on mindful deliberation and utilisation, and not mindless and destructive consumption.
Low carbon lifestyle is a cluster of habits, embedded in a social context and enabled by efficient infrastructures that minimizes the use of natural resources and generation of emissions, wastes and pollution. Creating sustainable lifestyle requires a change in social norms and rethinking the ways of living based on the principles of organicity, nonaccumulation (aparigraha), minimalism and slowing down. It is also about caring, sharing, recycling and living in balance with the natural environment. We in India have a reuse and repair culture, which needs to be promoted by provision of repair workshops in all the localities. Education, capacity building and participation of civil society are necessary to develop pragmatic and innovative practices of sustainable lifestyles.
Low carbon urban strategies can not work without involving the women, who comprise nearly half of the population and work everyday in home and on fields. However, they often face the ‘gender service gap’ in terms of access to energy, water, and toilets. A low carbon city has to be gender sensitive with adequate, safe and affordable spaces for living, working and vending by the women.
Conclusions
A resilient and low carbon city comprises smart and green transport, energy, water and buildings with net zero carbon emissions. It produces surplus energy from renewable sources that compensates for all carbon emissions associated with the transport, construction, industries and buildings. Net zero urban development creates an environmental benefit by decarbonisation. Such a city promotes creation of jobs, urban variety, gender equity, digital planning and governance, adoption of microclimatic design approach and intelligent services. Optimum use of land and natural resources, lifestyle for environment and new partnerships are critical elements of a resilient, low carbon habitat.
References
Central Pollution Control Board (2018) Reports on Air Pollution in India, New Delhi.
CPCB, Status of Water & Wastewater Generation, Collection, Treatment & Disposal in Class I Cities, New Delhi
CPHEEO (2014) Water Supply and Sanitation, New Delhi.
Delhi Development Authority (2004) Report of Committee on Making Delhi Slum Free (Madhukar Gupta Committee), Unpublished, New Delhi Delhi Pollution Control Committee (DPCC) Real Time Ambient Air Quality Data of Delhi, India: http://www.dpccairdata.com/ dpccairdata/display/index.php.
E.F.N. Ribeiro (2003) Metropolitan Vision in the Context of Rapid Urbanisation, Paper presented in AMDA Seminar, New Delhi
Ehrlich Paul R, (1968) the Population Bomb, Sierra Club/ Ballantine Books, New York
Forbes Davidson (1994) Action Planning, IHS Rotterdam
Gates, Bill (2021) How to Avoid A Climate Disaster, Alfred A Knopf, USA
Government of Maharashtra (2020) Recreational Open Spaces, Provision for Amenity Spaces Unified Development Control and Promotion Regulations (UDCPR), Mumbai
IEA, (2008) India Energy Efficiency Policies and Measures: Energy Conservation Building Code, http:// www.iea.org/textbase/ pm?mode=pm&id=4162&action=detail.
ICLEI (2007) Preparing for Climate Change: A Guidebook for Local, Regional and State Government, Washington.
Indian Network for Climate Change Assessment (2011) ‘Ministry of Environment and Forests, Lodhi Road, New Delhi,
IPCC (2021) Climate Change Working Group, Impacts Adaptation and Vulnerability, IPCC, Cambridge University Press, UK and New York.
IPCC (2014) Climate Change Working Group, 6th Assessment Report, Cambridge University Press, UK and New York
Jain A.K. (2021) Environment, Urbanisation and Development, Discovery Publishing House, New Delhi
Jain A.K. (2017) Urban Transformation, Discovery Publishing House, New Delhi
Jain A.K. (2018) City Planning for a Changing India, Bookwell Publishers, New Delhi
Jain, A.K, (2009) Low Carbon Cities- Policies, Planning and Practice, Discovery Publishing House, New Delhi.
Jain, A.K. (2015) Smart Cities: Vision and Action, Discovery Publishing House, New Delhi,
Jain, A.K. (2015) River Regeneration and Water Resources. Discovery Publishing House, New Delhi
MOHUA (2015) Urban and Regional Development Plan Formulation and Implementation Guidelines, New Delhi MOHUA (2017) National Transit Oriented Development Policy, New Delhi
MOHUA (2017) Metro Rail Policy Guidance Document, New Delhi
Narain, Sunita (2002) The Flush Toilet is Ecologically Mindless, Down To Earth, New Delhi, Feb.
Plummer, Janelle (2002) Focusing Partnerships to Municipal Capacity Building, Earthscan, UK
Satterthwaite, D. (2008) Cities’ contribution to global warming: Notes on the allocation of greenhouse gas emissions. Environment and Urbanization, 20 (2).
Tewari, S. (2013) ICLEI-ACCCRN Process, Presented at the International Conference on Resilient Cities, Experiences from ACCCRN in Asia and Beyond, New Delhi.
UNFCCC (2010) United Nations Conference on Climate Change, Proceedings, Mexico
UN-Habitat (2021) Blockchain for Urban Development, UN Habitat, Nairobi.
UN-Habitat (2011) Cities and Climate Change, Global Report on Human Settlements, Earthscan, UK/USA/Nairobi.
United Nations General Assembly (2015) Sustainable Development Goals-2030, United Nations, New York
United Nations COP 26 (2021) Proceedings (Web site) Glasgow UNISDR (2013) “Toolkit for local governments – 10 essentials”,
http://www.unisdr.org/campaign/ resilientcities/toolkit/essentials
Vijay Kumar (2012) 101 Design Methods, John Wiley, New Jersey
WRI and ICLEI (2015) Global Protocols for Community Scale Greenhouse Gas Emission Inventories, Washington


 (No Ratings Yet)


Leave your response!