| Mapping | |
Seagrass mapping with supervised classification method using multispectral satellite imagery
A case study in national marine protected area of Anambas island, Indonesia |
 |
|
 |
|
 |
|
1. Background
The environment for seagrass to grow is in marine ecosystem. Providing habitat for marine biota is the seagrass’ primary role. Aside from that, seagrass is also able to absorb and store carbon, thus reducing CO2 in the atmosphere. Seagrass live best in a shallow marine water body and estuary. Seagrass ecosystem are located across the seacoast, with less than 5 meters depth.
Seagrass can be massively found near mangrove ecosystem or coral reef. In Indonesia, there are 13 types of identified seagrass. Anambas, as one of the islands that consist of many islands, is an ideal place for sea grass to grow. entified seagrass. Anambas, as one of the islands that consist of many islands, is an ideal place for sea grass to grow.
The seagrass ecosystem is one of the parts in tropical marine ecology. The role of seagrass ecosystems includes a productivity resource to absorb carbon from the atmosphere with an effectiveness 10 times greater than the forests (Kawaroe et al., 2016).
As a source of productivity, seagrass beds also serve as a place for other organisms to forage, especially dugong (Dugong dugon) and endangered turtles (Preen et al., 1992). Seagrass is the home of marine life, including economically valuable biota, including Baronang fish, shellfish, and crabs. The existence of these biota is useful for humans as a source of food. In addition, seagrass acts as a medium for filtration or purification of shallow waters, a place to live for various types of marine biota, which contribute in mitigating and adapting to climate change, controlling ocean currents energy on the coast as well as stabilizing sediments to prevent erosion on the coast. (Kennedy & Björk, 2009; McKenzie, 2008; Dorenbosch et al., 2005; Green & Short, 2003; Nagelkerken et al., 2002).
At present, the condition of seagrass beds in Indonesia is lacking a proper management from the government. Sophisticated technology is required to monitor the development of seagrass in order to maintain the balance of the ecosystem. Thus, various study is critical to contribute to the seagrass protection. The most cost-effective technology to map the seagrass distribution is remote sensing. There are still minimum studies that discuss the function of remote sensing to optimize the result of seagrass mapping. Therefore, this research needs to be carried out continuously to find the most suitable method for mapping seagrass.
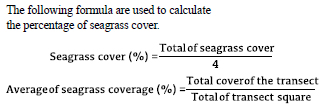
Remote sensing is the process of detecting and monitoring the physical characteristics of an area by measuring its reflected and emitted radiation at a distance (typically from satellite or aircraft). (USGS, 2020). Remote sensing helped the process of acquiring the data of a vast area near Anambas. The classification method used in this research is the Spectral Angle Mapper algorithm and Maximum Likelihood. This paper aims to (1) map the distribution of the seagrass and calculate the percentage of seagrass coverage. the usage of multiple satellite imagery to map the sea grass will be discussed. Three type of satellite imagery will be used, which are SPOT-7, Sentinel-2A and Landsat 8 OLI.
2. Methodology
2.1 Study area
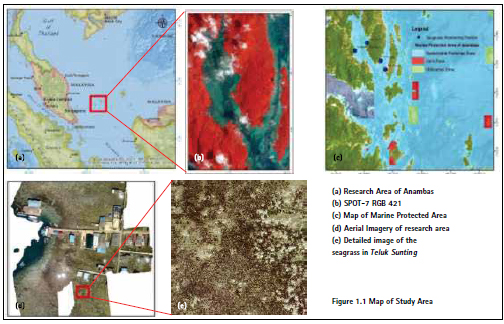
The research location is located in Teluk Sunting, Anambas Islands, which is one of the National Marine Protected Areas (MPA) under the auspices of the Ministry of Marine Affairs and Fisheries of Indonesia. The total area of the National Marine Protected Areas is 1,262,686.2 ha. The seagrass is located closely to mangrove and coral ecosystems. The three objects are interrelated with its geographic location within the bay. The is having a relatively less strong currents and waves, ideal for the seagrass ecosystem. The research location is within the Marine Protected Area which is spatially included in the Sustainable Fisheries Zone and close to the seagrass monitoring station by the Ministry of Marine Affairs and Fisheries of Indonesia.
2.2 Field survey
Monitoring of the seagrass ecosystem in the Anambas Archipelago and the surrounding sea is carried out using the Line Intercept Transect (LIT) method. The method is assisted by using a quadratic transect measuring 50 x 50 cm2 (Rahmawati et al, 2017). The LIT points are located along the observation area and determined as far as 100 m. The seagrass observation intervals are 10 m (adjusted to conditions in the field). Transects are drawn perpendicular to the coastline and each transect is placed parallel to one another. Furthermore, at each 10 m point interval on the 100 m line transect, a quadratic transect is stored / placed as an observation area. There are two main parameters, namely the number of species and the total seagrass cover. The tools and materials used in monitoring the conditions of the seagrass beds include transects of 50×50 cm, meter rollers, iron stakes, buoys, pencils, masks, snorkels, booties, newtop paper, and pencils.
The main parameter data and additional data of seagrass beds monitoring are inserted into a spreadsheet. The average seagrass cover parameters are calculated and the conditions of the seagrass beds are categorized according to the reference book for monitoring the seagrass beds and KepMenLH No. 200 of 2004. After measuring the seagrass cover, it is followed by taking ROI samples which will be used for image processing using GPS. The ROI samples taken were seagrass and sand objects. The total ROI of seagrass extracted is approximately 800 points.
2.3 Data analysis
The data used in this study were Landsat 8 OLI, SPOT-7, and Sentinel-2A imagery. These three images were recorded in three different times to ensure the minimum coverage of clouds. The Landsat 8 OLI image consist of 2 sensors, namely the Operational Land Imager (OLI) and the Thermal Infrared Sensor (TIRS). There are 9 channels on the OLI sensor with a range between 443nm to 1390nm with a spatial resolution of 30 meters and 15 meters, while on the TIRS sensor there are 2 channels with a spatial resolution of 100 meters. SPOT-7 image has 5 channels consisting of one panchromatic channel with a spatial resolution of 1.5 meters and 4 multispectral channels with a spatial resolution of 6 meters. Sentinel- 2A satellite imagery has 13 channels with 4 channels with a spatial resolution of 10 meters, 6 channels with a spatial resolution of 20 meters, and 3 channels with a spatial resolution of 60 meters. The three images that were used in this paper have different temporal resolutions. Landsat 8 OLI has 16 days of revisiting time, SPOT-7 every 26 days, and Sentinel-2A every 10 days. In this study, Landsat 8 OLI imagery was used with the recording time on August 10, 2020, SPOT-7 on February 17, 2018, and Sentinel-2A on March 29, 2019.
Radiometric correction is applied to Landsat 8 OLI and SPOT-7. The correction function to reduce the atmospheric disturbance factor and change the digital number value to a reflectance value. Radiometric correction is not required for Sentinel-2A imagery. The atmospheric value of Level 1-C Sentinel- 2A is already corrected and the geometric characteristic is already projected.
The field data used is the result of a seagrass survey in September 2020. This data contained the information of location data with coordinates and type of seagrass. The obtained coordinate data is then taken the spectral value on the image and used to map the distribution of seagrass using the Supervised method, namely Spectral Angle Mapper and Maximum Likelihood. The Spectral Angle Mapper (SAM) method is a method that uses the similarity value of the spectral reflectance of an object by calculating the angle between the two spectra (Kruse et al., 1993). Maximum likelihood classification (MLC) is a method for determining a known class of distributions as the maximum for a given statistic (Nilsson, 1965). The Maximum Likelihood method is a method that considers the maximum similarity of the pixel value of a predetermined object sample, this classification is most often used in digital image processing.
In order to map the distribution of seagrass with these two methods, in addition to the spectral reflectance value of the seagrass object, the spectral reflectance value of other objects is also needed to separate it from the seagrass, such as sand, sea and vegetation objects. Field data taken is only seagrass data, so that the spectral reflectance value of objects other than seagrass is taken visually in the image. The spectral reflectance values taken are different in each image. This is because there are differences in the characteristics of the three images, both spatial and temporal resolution. The results of the distribution of seagrass were analyzed together with the percentage of seagrass cover and the distribution of seagrass species obtained during the field survey and related to the physical and environmental aspects in the waters of the Anambas Islands.
3. Result and discussion
3.1 Coverage and species of seagrass
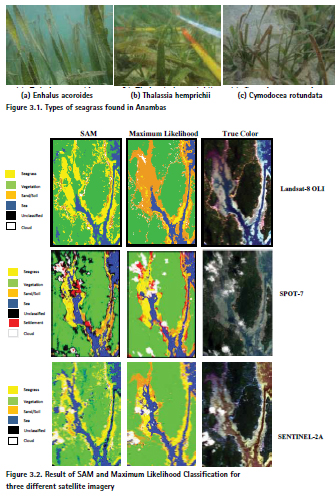
In the Anambas Islands and the surrounding sea, three seagrass species were found, consisting of Enhalus acoroides, Thalassia hemprichii and Cymodocea rotundata. Seagrass cover at the Air Asuk station was 18.07%, Makam Siantan station 23.48%, Tanjung 23.96%, Muntai 10.13% and the overall average seagrass cover was 18.82%. Based on the monitoring of the seagrass ecosystem, the condition of seagrass covers at Air Asuk, Air Nanga, Tanjung and Muntai stations, according to the Minister of Environment and Forestry Decree No. 200 of 2004, seagrass cover in Teluk Sunting is categorized as rare and in poor status. Low seagrass cover can be influenced by various factors, such as water currents, substrate, and human influences (settlement, sand suction).
Types of Enhalus acoroides spread and found at every observation station, Thalassia hemprichii was also found in almost all stations, only one station was not found. Meanwhile, Cymodocea rotundata was only found at two observation stations. This is in accordance with the statement of LIPI (2018) that in general, E. acoroides and T. hemprichii are types of seagrass that are often found in Indonesian waters. One of the factors that influence the presence or presence of seagrass species in a location is the texture of the bottom substrate. The Enhalus acoroides and Thalassia hemprichii types of seagrass grew more on substrates with relatively higher silt concentrations, while the texture of coarse sand sediments was overgrown with lemons of the Cymodocea rotundata type. This is consistent with the conditions in the field, which shows that C. rotundata is not found in locations that have mud substrate types and are usually close to mangrove ecosystems.
3.2 Supervised classification result
The images were having radiometric correction to extract the value of reflectance are used to become the basis to determine the Region of Interest (ROI). The ROI is used to sample the vegetation, cloud and deep sea objects, while the ROI sample for seagrass and sand objects is taken from the ROI sample during field surveys. To determine ROI samples other than seagrass and sand, a true color display image can be used as a reference. The true color channel on the Landsat 8 OLI and Sentinel-2A is RGB 432, while on the SPOT-7 RGB 123. True color was used to ease the identification of the objects on the surface. The ROI taken for each image is different due to the different spatial resolution. The Region of Interest obtained by the field survey and image interpretation is used for the Maximum Likelihood and Spectral Angle Mapper Classification. The two classification methods were carried out on Landsat 8 OLI, Sentinel-2A, and SPOT-7 imagery. The results of the Supervised classification show the ability of different images to classify, but it shows the concentration of the distribution of seagrass in the same location, although with different areas. This can be affected by different image spatial resolutions and different image recording times that affect the ROI sample used. The output from Maximum likelihood and SAM can be seen in the image.
Figure 3.2 is an image showing the distribution of seagrass with the SAM method and Maximum Likelihood. The distribution of seagrass is shown in yellow. Different method shows a visually significant difference in the area of distribution of the object. In the Landsat 8 OLI imagery using the Spectral Angle Mapper method, it can be seen that the distribution area of seagrass is larger than that of the Maximum Likelihood method. When compared with the results of the appearance of the image with the band combination or true color 432 composite, it can be seen that there is inconsistency in the bay. In the appearance of the composite image 432 can be seen in the bay part in the form of sea water objects with a combination of sand and seagrass but the classification results using the SAM method are dominated by vegetation and seagrass, while the results of the Maximum Likelihood classification are seen in the bay part which is dominated by sand and a less seagrass area.
The true color become the preliminary method to discriminate the objects. True color is easy to be visually interpreted, but there are also some limitations due to the eyes inability to differentiate the pixel value of an image. The Sentinel-2A image classification result of the maximum likelihood has a strong similarity to the true color. The water body is represented very well, the vegetation is also strongly differentiated. The seagrass and the sand also differentiated in a well manner. Different from the maximum likelihood, the SAM method shows a different result with the previous method. SAM shows some area that is unclassified. The sea water has a scattered distribution, shown by the shadow of the cloud is read as the water body. Some vegetation area on the lower part of the image also classified as the water. Sand in SAM is relatively less in comparison to the amount of sand in Maximum likelihood. Further, there are also misinterpretation of the sea grass that is located at the surface vegetation area.
The results of the classification on the SPOT-7 image visually show the differences that are not too far from all objects in the SAM method and Maximum Likelihood. The distribution of seagrass and sand in the two methods is also almost identical, the location of the distribution of seagrass which is quite large is also close to the monitoring point of the seagrass. This can be seen later in the next article, namely the difference in area between methods. It’s just that there are differences in interpretation between clouds and settlements, perhaps due to spectral hues that are not much different and equally bright so that there is a misclassification. The high spatial resolution of SPOT-7 makes the number of pixels increase as well for each scene in the study area, so this must be the basis for taking ROI samples which must be more and evenly distributed compared to Sentinel-2A and Landsat 8 OLI.
3.3 Total area of seagrass result
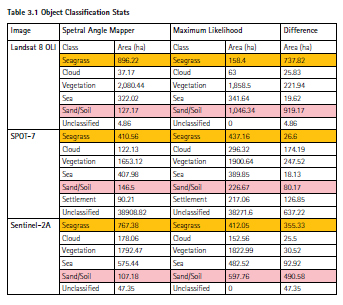
The classification results from the SAM method and Maximum Likelihood can be calculated statistically on the distribution of seagrass, to determine the differences and are shown in table 3.1
The significant difference between seagrass objects in SAM method and Maximum Likelihood on Landsat 8 OLI is due to differences in the spatial resolution. The bay area has a foggy visual characteristic which makes it slightly difficult to be interpreted. There is a possibility that there is a mixture of sea water, sand, vegetation, seagrass and sedimentation objects which affect the spectral reflectance value. The classification results also show some unclassified objects, which are shown in black. This is due to the unequal distribution of the sample objects used for processing using the SAM method and Maximum Likelihood.
Apart from that, the 30 meters spatial resolution of Landsat 8 OLI also affects the classification results of seagrass objects. Seagrass objects in the field are often found with a small area so that in the Landsat 8 OLI Image the spectral reflectance values of some seagrass objects are not purely derived from these objects but are mixed with other objects such as sand and sea water which of course affects the classification results of the two methods. Judging from the spatial resolution of Landsat 8 OLI imagery, the results of the classification and the difference in the area value of seagrass with the SAM method and Maximum Likelihood, mapping the distribution of seagrass is not suitable for the Landsat 8 OLI imagery using this method.
The biggest difference area in Sentinel- 2A result were shown in the sand object with total of 490.58 ha. The second one is the seagrass with 355.33 ha. These two objects have so much difference due to the close pixel value of sand and sea grass. Using the true color, it is even harder to differentiate the seagrass with the sand. The color is quite the same. Furthermore, the bigger explanation is the fact that sea grass lives in under the water and near the sand. The very near habitat of sea grass to the sand make it even harder to differentiate. The amount of sedimentation of sand within the water body may be one of the factors that makes it harder to differentiate the sand and the sea grass. The area difference of Sentinel-2A is not as huge as Landsat 8. The higher resolution of Sentinel-2A plays a role to minimize the difference of the area. To increase the precision of the identification, the increasing amount of sand and sea grass is required. The ideal ROI would be from the field survey.
Likewise, the SPOT-7 image requires more and more even ROI samples considering its high spatial resolution, seen from the highest Unclassified area produced in both methods, both SAM and MLH, in contrast to Sentinel-2A and Landsat-8 OLI which do not have value (0 Ha) Unclassified on the Maximum Likelihood results. However, it shows that SPOT-7 is the most capable of mapping seagrass using these methods, this can be seen from the image results and the minimum difference in the area value of seagrass with the SAM and MLH methods, which is only around 26,6 ha. The difference in the area of seagrass using SPOT-7 with the SAM and Maximum Likelihood methods on Sentinel-2A and Landsat 8 OLI images is 355.33 ha and 737.82 ha. The high spatial resolution of SPOT-7 may determine the results of seagrass mapping if it is related to the resolution of Sentinel-2A and Landsat 8 OLI images which are still below the spatial resolution of SPOT- 7 images. The same is the case with the inconsistent sand classification results in the Landsat 8 OLI image, seen from the very large difference in sand area between the SAM and MLH methods, which is 919.17 ha, while the difference in the sand area using the SAM and MLH methods in the Sentinel-2A image is 490.58. Ha. The results of theclassification of seagrass and sand in the SPOT-7 image which have a little anomaly value in the SAM and MLH methods compared to the Sentinel- 2A and Landsat 8 OLI images, it can be said that the SPOT-7 image is quite good in mapping the spatial distribution of the seagrass ecosystem. It turns out that spatial resolution plays an important role in mapping the seagrass ecosystem.
The results of the transect method during the field survey showed the percentage of rare seagrass coverage are inversely proportional to the result of image processing that showed a large enough seagrass area. This indicates an influence on the ability of the image’s spatial resolution in identifying seagrass and sand. During the field survey, it can be seen that the seagrass is very wide like a seagrass bed but it looks sparse and grows among the sand. Mapping seagrass using drones may reduce the misclassification, but it takes a longer time in comparison of using satellite image. The SPOT-7 image is considered capable of mapping seagrass well.
To produce a more specific classification, further research shall be carried out by not including the vegetation reflectance value into the classification or by masking the vegetation area, and it can also classify seagrass in clear waters and seagrass in turbid waters, such as what happened in Teluk Sunting. Different ecosystems and substrate conditions between Muntai station points – Makam Siantan station points and Tanjung station points – Air Asuk station points, where at Muntai and Makam Siantan stations are dominated by muddy sand substrate which can be directly interpreted on the true color image, the color of the western waters is darker than the eastern waters. This substrate is influenced by the surrounding mangrove ecosystem and its geographic condition, which is actually located into the bay compared to the points of Tanjung station and Air Asuk station. The water substrate at Tanjung and Air Asuk stations with clear waters that have more sands and not muddy may be due to its location that does not enter the bay too much so that it has higher currents and waves than inside the bay.
4. Conclusions
In general, 3 species of seagrass were found in Anambas, consisting of Enhalus acoroides, Thalassia hemprichii and Cymodocea rotundata and the average seagrass cover was 18.82%.
Mapping seagrass using the Supervised Classification method on Landsat 8 OLI, Sentinel-2A, and SPOT-7 images results in inconsistent seagrass classifications on Landsat-8 OLI images, is good enough on Sentinel-2A images, and very good on SPOT-7 images. %. The area of seagrass in Teluk Sunting resulted from the SAM and Maximum Likelihood using Landsat 8 OLI image was 896.22 ha and 158.4 ha, in the Sentinel-2A image was 767.38 ha and 412.05 ha, and in the SPOT-7 image were 410.56 ha and 437.16 ha respectively. The smallest difference between the two methods is in the SPOT-7 image, showing that the SPOT-7 image is the most suitable for mapping the distribution of seagrass using Supervised Classification.
5. References
Green, E.P. & F.T. Short. 2003. World Atlas of Seagrasses. University of California Press. USA. 310 pp
J.N. Nilsson. Learning Machines: Foundations of Trainable Pattern- Classifying Systems, McGraw-Hill Series in Systems Science, McGraw- Hill Book Company, New York (1965)
Kawaroe, M. (2016). Seagrass biodiversity at three marine ecoregions of Indonesia: Sunda Shelf, Sulawesi Sea, and Banda Sea. Biodiversitas, Journal of Biological Diversity, 17(2), 585– 591. https:// doi.org/10.13057/biodiv/d170228
Kennedy, H. & M. Bjork. 2009. Seagrass Meadows. In: Laffoley, D. D’A & GRIMSDITCH, G. (eds). 2009. The management of natural coastal carbon sinks. IUCN, Gland, Switzerland.53 pp.
Kruse, F.A., 1993. The Effects of AVIRIS Atmosfer Calibration Methodology on Identification and Quantitative Mapping of Surface Mineralogy, Drums Mountains, Utah, in Summaries of the Fourth Airborne Geoscience Workshop, pp.101-104.
Ministerial Decree of Ministry of Environment and Forestry Number 51.2004. Baku Mutu Air Laut.
McKenzie, L. J. 2008. Seagrass Educator Handbook. Seagrass- Watch, Queensland, Australia
Multispectral Resampling of Seagrass Species Spectra: WorldView-2, Quickbird, Sentinel-2A, ASTER VNIR, and Landsat 8 OLI. IOP Conf. Series: Earth and Environmental Science 98 (2017) 012039
Preen, A. R. (1992) Interactions between dugongs and seagrasses in a subtropical environment. PhD thesis, James Cook University.
Rahmawati, S., A. Irawan, I. H. Supriyadi, M. H. Azkab. 2017. Panduan Pemantauan Padang Lamun. COREMAP-CTI Lembaga Ilmu Pengetahuan Indonesia. Jakarta. 35 hal.
Short, F.T., McKenzie, L.J., Coles, R.G., Gaeckle, J.L. 2004. SeagrassNet manual for scientific monitoring of seagrass habitat – worldwide edition. University of New Hampshire, USA. QDPI, Northern Fisheries Centre, Australia. 71 pp.
U.S.G.S. (n.d.). What is remote sensing and what is it used for? USGS. Retrieved October 11, 2020, from https://www.usgs. gov/faqs/what-remote-sensing-and-whatit- used?qtnews_ science_products=0 KepMenLH No. 200 of 2004, dlhk. kepriprov.go.id. http://dlhk.kepriprov. go.id/wpcontent/ uploads/2018/09/i_ kepmenlh_200_2004_baku_kerusakan_ dan_pedoman_penentuan_st atus_padang_ lamun.pdf, accessed in 01 October 2020.
The paper was presented at Asian Conference on Remote Sensing (ACRS) 2020, 9-11 November 2020, Deqing, China.


 (4 votes, average: 4.00 out of 5)


Leave your response!