| Applications | |
Remote Sensing for air pollution control
Air pollution in India has become one of the most serious causes of environmental damage and health risks. As per the World Health Organisation (2018), 13 Indian cities are among the World’s top 20 cities with severe levels of PM 2.5 and PM10 |
 |
|
In 2017, 77% population of India was exposed to ambient PM2.5 above 40 μg/m3, which is the recommended limit by the National Ambient Air Quality Standard (CPCB 2018 & DPCC 2018). The mean ambient particulate matter PM2.5 annual exposure of 90 μg/m3 in India in 2017 is one of the highest in the world. The highest PM2.5 exposure level was in Delhi, followed by other north Indian states of Uttar Pradesh, Bihar and Haryana. India is home to 18% of global population, but accounts for 26% of global premature deaths and health loss attributable to air pollution.
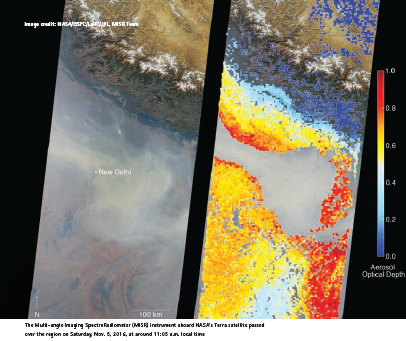
The major sources of air pollution are urban transport, dust from construction and demolition activity, the use of ‘dirty’ fuels such as diesel, coal and wood for industries, electricity generation and cooking. The sources of air pollution are geographically dispersed, often across states. Around half of Delhi’s air pollution during the months of October and November can be attributed to the burning of agricultural waste in neighbouring states. A study conducted by the John A. Paulson School at Harvard University (2018), uses satellite imaging and geospatial mapping technologies to identify agricultural fires in neighbouring States as the main source of increased air pollution during the harvesting seasons.
Data from NASA satellites was used to identify fire ‘hot spots’, after which the study used a particle dispersion model to track the amount of pollutants travelling to New Delhi from these sources. More than half of the 150 μg/m^3 concentration of PM2.5 and PM10 particles during these seasons can be attributed to these agricultural fires. This means that apart from developing localized solution to the air pollution the governments of Punjab, Haryana, Uttar Pradesh and Uttarakhand also have to control external source of pollution. A study by the Harvard Kennedy School states that ambient air pollution may cost the Indian economy 0.5 trillion dollars a year.
A study by the University of Surrey posits that the WHO’s estimates that the exposure to PM2.5 and PM10 particles in Transport Micro-environments (TMEs), Asian pedestrians were 1.6x and 1.2x worse off than their European and American counterparts respectively. Furthermore, bus passengers were 3x worse off than their American counterparts, while this figure increased to 9 times when also considering car passengers. Asian pedestrians are also 7 times more susceptible to exposure to Black Carbon, which has been linked with adverse health effects such as cardiopulmonary morbidity.
Delhi’s air quality dips to emergency levels, breaches ‘severe+’ markDelhiites woke up to the highest level of pollution this season on Friday (November 1, 2019) morning as the city was shrouded by a haze of dust and smoke. The Air Quality Index (AQI) value was hovering at 459 at 8 am on Friday after pollution levels breached the ‘severe+’ zone late on Thursday night. This is the first time that the air quality has dipped to emergency levels in the national capital this season. Such a situation was last seen in January 2019. Even though till 8 am in the morning the air quality showed no signs of improvement, government agencies have forecast that there could be marginal improvement today. Marked improvement could only be expected on Sunday when winds are expected to pick up. “At 8 am the PM2.5 level was standing at 350ug/m3, nearly six tomes above the daily permissible limit of 60ug/m3. The PM10 level was recorded to be 539ug/m3 which is more than five times above the permissible limit of 100ug/m3m” said a CPCB official. According to the Graded Response Action Plan extreme measures such as oddeven road rationing, banning entry of trucks, banning construction activities and other measures such as shutting down of schools are enforced if air quality persists in emergency zone. Hindustan Times, New Delhi, Nov 01, 2019 |
Air monitoring data and inventory
There is little information about the realtime pollution levels in the immediate vicinity that are affecting the people’s health. Even in a large city like Delhi, the government has only 26 air pollution monitoring stations which provide local data on pollution levels. The information on air pollution is often adhoc and inadequate. Lack of Continuous Emissions Monitoring (CEM) equipment means that stakeholders are unable to identify the sources, diagnose and enforce that are worsening the problem.
Air quality data is significant to gaining a thorough understanding of local air pollution. Recent technological advancements have made it possible to gather data, with new low-cost monitoring devices and advanced methods of collating and analysing it. This helps to gain a robust understanding of pollution levels, their causes and effect.
Now-a-days smart electricity poles with sensors are available to monitor pollution parameters along with light, CCTV, wi-fi, etc. The NDMC has been using them in New Delhi. Citywide air quality monitoring networks and data from these can provide consumers with a continuous feed of air quality in their area.
The Google plans to map street by street air pollution that will be available to the common man. The active sensors will measure CO2, CO, NOx, NO2, ozone and particulate matter.
CEMS and Air quality Data can be used to identify major components, sources, quantification and projects. It can also help the government to apply monetary incentives and penalties for polluting companies. SPCBs can provide tax benefits and ease other regulations on emission-efficient industries while penalizing inefficient ones. At the central level, the CPCB can also use this data to introduce a cap-and-trade system, instead of the existing ‘command-and-control’ regulations. The data can be used to analyse the issues, sources and project various options and actively schedule to assign the responsibilities, project management, including timelines and monitoring.
The challenges
Finding a solution to the problem of air pollution is daunting. A large, emerging economy such as India’s has numerous and varied sources of air pollution, be they from industry, construction, urban transport or domestic use. Regulating the air pollution from all these different stakeholders is especially difficult because its impact is geographically dispersed, often across the States and jurisdictional lines. For instance, around half of Delhi’s air pollution during the months of October and November can be attributed to the burning of agricultural waste in neighbouring states. This means that apart from developing a localized solution to the air pollution that is generated within its own city, the Delhi NCT Government must also coordinate with the governments of Punjab, Haryana, Uttar Pradesh and Uttarakhand to control this external source of pollution.
National Clean Air Programme (NCAP)
The Government of India have launched the National Clean Air Program and Graded Response Action Plan. The incidences of episodic air pollution in India, especially in Delhi NCR, in recent years has led to the preparation of comprehensive Clean Air Programme (NCAP) which seeks to address the issue, It seeks to have efficient data management and dissemination, public outreach and timely measures for prevention and mitigation of air pollution.
The Government is executing the National Air Quality Monitoring Programme (NAMP), which consists of 691 manual operating stations covering 303 cities/ towns. Under NAMP, four air pollutants viz. Sulphur Dioxide (S02), Oxides of Nitrogen (N02/NOx), Suspended Particulate Matter (PM10) and Fine Particulate Matter (PM2.5) have been identified for regular monitoring at all the locations. In addition, there are 101 real-time Continuous Ambient Air Quality Monitoring Stations (CAAQMS) in 57 cities monitoring 8 pollutants viz. PM10, PM2.5, S02, NOx, ammonia (NH3), CO, ozone (03) and benzene.
The monitoring is being carried out with the help of Central Pollution Control Board (CPCB); State Pollution Control Boards (SPCB); Pollution Control Committees (PCC) and National Environmental Engineering Research Institute (NEERI), Nagpur.
Central Pollution Control Board (CPCB) has issued a comprehensive set of directions for implementation of 42 measures to mitigate air pollution comprising action which include control and mitigation measures related to vehicular emissions, re-suspension of road dust and other fugitive emissions, bio-mass/municipal solid waste burning, industrial pollution, construction and demolition activities. Directions covering 42 action point was issued initially for implementation in NCR but have now been extended to other States in India.
Vehicles have been identified as major source of pollution. In this regard Bharat Stage IV (BS-IV) norms has been launched for mandatory implementation since 1st April 2017 and BS-VI by 1st April, 2020.
Other measures include use of cleaner and alternative gaseous fuels like CNG, LPG and ethanol blending in petrol in order to reduce vehicle exhaust emissions, promotion of public transport, Pollution Under Control Certificate, lane discipline, vehicle maintenance, etc. It is estimated that a 5% blending can save around 1.8 million barrels of crude oil.
Graded Response Action Plan (GRAP)
The Government has notified a Graded Response Action Plan for Delhi and NCR, keeping in view the key pollution sources in Delhi and National Capital Region of Delhi (NCR). While major sources of pollutionvehicles, road dust, biomass burning, construction, power plants and industries remain continuous throughout all seasons, the episodic pollution from stubble burning, increase in biomass burning, etc. varies across seasons. During winter the relative share of air pollution from the vehicles, biomass burning, municipal solid waste burning, fire-crackers, stubble burning, construction, and secondary particles increase. During summer, the influence of road dust, fly ash, vehicles, biomass burning, etc. is high. The Graded Response Action Plan includes appropriate measures for each level of pollution. The measures are graded from public health emergency level to downward. Emergency and Severe levels include cumulatively all other measures listed under Very Poor, Poor and Moderate AQI. The responsibility of implementing the GRAP lies with the EPCA.
Top court fumes over Delhi pollutionPeople are losing precious years of their lives due to pollution, the Supreme Court said on Monday (November 4, 2019) as Delhi and nearby areas face a public health emergency due to severe air pollution. The top court pulled up the centre and the Delhi government, saying “there is passing of buck” and that it “can’t happen in a civilised country”. The Supreme Court took up a report by the Environment Pollution Control Authority or EPCA, on the pollution caused by stubble-burning. The pollution control body had asked that states in the National Capital Region be asked to stop burning of waste, toxic emissions from industries and dust from construction sites. “Can we survive in this atmosphere? This is not the way we can survive. No one is safe even inside homes; it is atrocious,” a bench headed by Justice Arun Mishra said. Taking note of crop burning in Punjab, Haryana and western Uttar Pradesh, the Supreme Court asked the centre to call environmental experts, including those from IIT (Indian Institutes of Technology), to the court within 30 minutes. “Things are happening every year under our nose. People are being advised to not come to Delhi or to leave Delhi.State governments are responsible. People are dying in their state and neighbouring states. We will not tolerate this. We are making a mockery of everything,” the top court said. “Delhi is choking every year and we are not able to do anything. Question is that every year this is happening,” the bench said, adding, “People are dying and it can’t happen in a civilised country”. www.ndtv.com/india-news/delhi-pollution-supreme-court-says-statemachinery- not-acting-centre-and-delhi-must-act-dont-blame-e-2127003 |
Clean air and sustainable development
In order to arrest air pollution, the following can be the agenda for 2030 (adapted from SDG 7 and SDG 11):
i. Double the rate of improvement of energy efficiency in India’s 5 largest metropolitan cities.
ii. Double the emission reduction from energy production.
iii. Halve the number of deaths per 100,000 persons caused by air pollution
iv. Halve the number of health complications per 100,000 caused by air pollution
Based on the identification of major components and sources of air pollution and analysis of ambient air quality, various scenarios of emission control from point sources and area sources can be worked out for next five years. This involves multifarious actions to reduce emissions from transport, power and industries, incineration of wastes, dust, etc. These measures can be geographically interlinked by a comprehensive approach towards a nonpolluting and healthy city. Such a city is planned on the principles of compact and dense development, intelligent traffic management, transport demand management, efficient, comfortable and non-polluting public transport, bicycles and non-motorised transport (NMT) and walk to work (IPCC, 2014). It provides clean water, wastewater recycling, CEPTs and zero polluting industries. Coal based thermal power plants are converted into CNG based and renewal energy along with smart grids and energy efficiency. Preparation of pollution control plans at district, municipal, and local levels is linked with the principles of circular economy, recycling, underground and black hole technology of waste management and smart utilities.
Intelligent and smart systems viz, Big Data Analytics, Supervising Control Data Acquisition Systems (SCADA), ERP solutions, GIS, Integrated Digital Control/Command Centres and Satellite Surveillance are exploited for air pollution control. The technological solutions have to be based on public engagement and collaborative partnerships.
The Environmental Pollution Control Authority (EPCA) has proposed adoption of Remote Sensing and keep a check on polluting vehicles in the NCR. All the vehicles shall be checked by remote sensing in real time for their emission vis-a -vis prescribed limit. Data collected by Remote Sensing shall be stored and linked with VAAHAN Database. Violations can be flagged and if a vehicle is classified as a high emitter or a extreme polluter, a challan shall be issued on the spot. The system shall measure NO, NO2, HC, CO, CO2 and opacity.
Further, the installation of engine optimization and exhaust gas recirculation technologies and promoting rail and waterways for public transport and freight can reduce black carbon emissions by 90%. Other critical areas to reduce emission from transport include increasing the use of electric vehicles and initiating a campaign for car-pooling and ride-sharing.
Clean Air Asia is also working in 30the area of mapping efficient routes and installation of emission-efficient engines. It has also developed a walkability app for Indian cities in an attempt to reduce vehicular use. Its Value Air You Use (VAYU) app tracks air quality measurements that allow users to make choices to act against air pollution.
Industries, Power and Fuels
Industries and power have a crucial role in shaping India’s path to combating air pollution. These need to shrink their environmental footprint by following measures:
▪ Promoting solar energy
▪ Strengthening of enforcement and emissions monitoring
▪ Scaling up of Emissions Trading Schemes.
▪ The development and installation of emissions free technologies, especially in the power and brick-making industries.
▪ Installing continuous emissions monitoring technology (CEMS) at manufacturing locations and placing more accountability on industrial polluters
▪ Introduction of gaseous fuels and enforcement of stringent SO2/NOx/PM2.5 standards.
▪ Elimination of DG set usage by provision of 24×7 electricity and by innovative tail pipe control technologies.
▪ Use of agricultural residue in power plants and ether industries to replace high ash coal and open burning in fields.
▪ Boosting of PNG Supply Network and clean-cooking stoves that use PNG/ LPG or solar energy.
▪ The implementation of gasification technologies to help convert waste into biomass pellets or electricity.
Dust control by screens, filters, flagging machines, vacuum cleaning, humidification, sprinkling of water and artificial rain.
Proliferation of low-carbon, green energy and smart building technologies are necessary in controlling the air pollution. Passive design of buildings can reduce the need of air conditioning. For a comprehensive approach, it is necessary to prepare local level air pollution control, energy efficiency and low carbon transport plans. Landscape, planting of trees and ground covers are important pollution abatement. It is low-cost, aesthetic, natural and simple to execute. This can be a new frontier in making the air clean and healthy.
Conclusions
The strategic pathway towards clean air starts with digital, real time development of various sources of air pollution. This should be the basis of the preparation of pollution control plans at district, municipal, and local levels. Low carbon urban systems require alternatives such as zero net energy buildings, black hole technology of waste management and smart utilities. According to the IPCC (Climate Change Report, 2014, WG III) the critical aspects of spatial planning for clean air comprise:
▪ Density, FAR optimisation
▪ Land use (mix of activities, population)
▪ Connectivity, walkability and traffic density
▪ Accessibility for all by public transit, cycle, walk
Along with these strategies, the concept of AQLI (Air quality Life Index) should be adopted for each city and local area. It is necessary that a comprehensive, digital and real time data is developed to facilitate the civic engagement and public participation.
This needs an air-shed approach and making proper use of data and monitoring. Big Data Analytics, Supervising Control Data Acquisition Systems (SCADA), ERP solutions, GIS, Integrated Digital Control/ Command Centres and Satellite Surveillance can mitigate the air pollution to a great extent.
References
1. Central Pollution Control Board (2018) Report on Air Pollution in India, New Delhi.
2. Centre for Science and Environment (2013) Vehicles-Taming Emissions Workshop, New Delhi
3. Delhi Pollution Control Committee (2018) Real Time Ambient Air Quality Data of Delhi, India, Delhi Pollution Control Committee (DPCC). http://www.dpccairdata. com/dpccairdata/display/index.php.
4. Greenstone, Michael, Rohini Pande, Anant Sudarshan, and Santosh Harish (2018) A Roadmap Towards Cleaning India’s Air, India Policy Forum, 2017-2018.
5. Gardiner, Beth. The Challenges of Cleaning Up Cooking. The New York Times. December 21, 2017. https://www.nytimes. com/2015/12/09/business/energyenvironment/ the-challenges-ofcleaning- up-cooking.html.
6. Harvard John A. Paulson School of Engineering and Applied Sciences (2018), Agricultural Fires Can Double Delhi Pollution during Peak Burning Season https://www.seas.harvard.edu/ news/2018/03/agricultural-firescan- double-delhi-pollutionduring- peak-burning-season
7. IPCC (2014) Climate Change Working Group III, 5th Assessment Report, Cambridge University Press, New York
8. Jain, A.K, (2009) Low Carbon Cities-Policies, Planning and Practice. Discovery Publishing
9. House, New Delhi.
10. Jain, A.K, (2019) Sustainable Architecture, Buildings and Cities, Synergy Books, New Delhi
11. Jiang, Jing Jing, Bin Ye, and Xiao Ming Ma (2014) “The Construction of Shenzhen ׳s Carbon Emission Trading Scheme.” Energy Policy75: 17-21. doi:10.1016/j.enpol.2014.02.030.
World Health Organisation, (2018) WHO Global Ambient Air Quality Database, Geneva


 (5 votes, average: 4.60 out of 5)


Leave your response!