GIS


Oil spills pollution

Sep 2008 | No Comment


The purpose of this study was to locate most oil-threatened areas and to document occurrences of oil spills through the production of space oil spills Atlas in the Arabian Gulf, offshore UAE
The influx of oil from tankers and offshore oil operations are amongst the major causes of pollution in the marine environment (U. S. Coast Guard, 1990). Ballast water and other oily water
discharged into the Arabian Gulf ranged between 400,000 and 750,000 tones in 1986. There have already been several
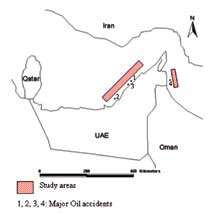
remarkable accidents in the Gulf region involving the loss of large quantities of crude oil from disabled tankers (Table 1, Figure 1). Even a small spill can cause havoc to the ecologically sensitive
environment.
Intentional or accidental oil spills, ballast water discharge, dredging and infilling for coastal development, and uncontrolled sewage and industrial wastewater discharges present real threats to the marine environment in the Arabian Gulf region. Oil discharged from ships imposes a much greater longterm threat to the marine environment than one big accident. Monitoring illegal oil discharges is thus an important component in ensuring compliance with marine protection legislations and general protection of the coastal environments.
This contribution documents the detection by means of satellite imagery, direct hydrocarbon pollution (such as big spills by tanker accidents), discharged oil caused by routine maintenance, and
leaking oil from offshore exploration and development operations. Satellite-borne sensors have varying electromagnetic sensitivities characteristics with different limitations for detecting marine surface
features. Therefore a combination of sensors is required to monitor marine.

img47

oil pollution effectively. This case study indicates that most oil spills are found along the major shipping routes and in anchorage area, as well as in those areas with intensive large-scale oil production
activities with leakage or tank-washing discharges. The results will show locations of potentially vulnerable areas, and serve as an alarm system for the implementation of effective routine monitoring
operations along the UAE offshore.
The aim of this study is to determine marine and coastal affected areas in the events of oil pollution, through the compilation and editing of the first satellite image Atlas for oil spills in the UAE, in a standard GIS format for the West and East coasts of UAE.

Study areas

The study areas are situated in the Arabian Gulf. -It is a shallow sea with its long axis oriented in NW-SE direction, and its average water depth is about 36m. The Evaporation and wind are the main driving forces for water circulation in the Arabian Gulf. Evaporation is stronger in winter due to high wind speed, than summer when the water surface temperature is higher. The overall circulation in the inner Arabian Gulf is cyclonic, with relatively fresh water entering through the Strait of Hormuz.
The study areas have one of the busiest and most important tanker shipping lanes in the world; one ship passes the strait approximately every 6 minutes, another statistic indicates that more than 40 % of
the world’s total oil transportation passes through the region. About 15.5 million barrels of oil per day is transported through the Strait of Hormuz. Contamination influx is mainly from tankers releasing
ballast, tank cleaning, and leakage from drilling rigs and production platforms, and maritime accidents.
Located at longitude 52oE and 56o45’E, latitudes 24o15’N and 26oN, the study area covers two sub-areas -one offshore of Abu Dhabi and northeast wards to Ras al Khaimah in the Arabian Gulf, and the other offshore Fujairah in the Gulf of Oman (Figure 1).

Methodology

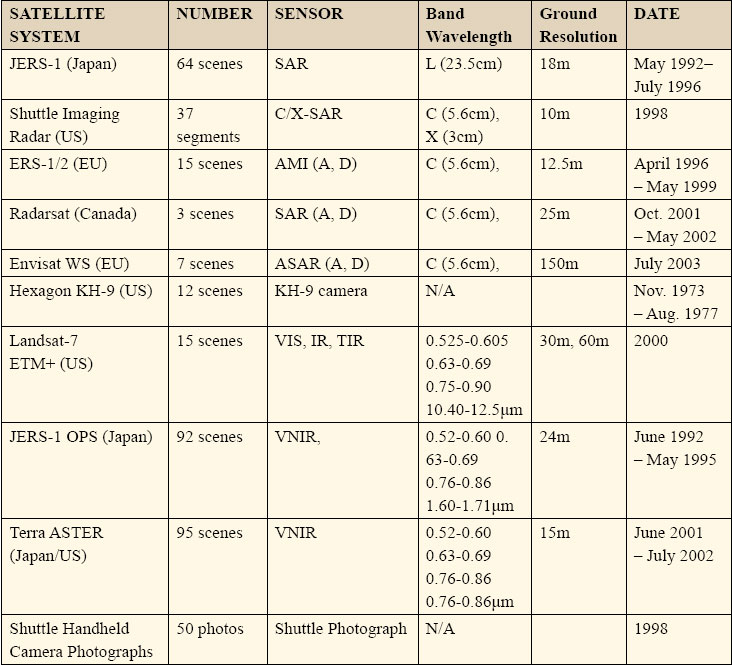
More than 300 satellite images have been examined during this study (Table 2). ERS-1/2, RADARSAT, and ENVISAT Cband SAR data has been used for the great majority of oil spill detection operations. However, other satellite images including optical sensor images have shown good detection capabilities. Therefore, we looked for all available image data archives and selected more than one hundred images derived from different platforms that covered most of the offshore waters of the UAE. We conducted a search of ERS-1 and 2 data archives to compile a list of all images acquired over the study areas. To evaluate their suitability for slick detection, historical wind conditions for corresponding SAR images were obtained. For each acquisition date, surface wind speed histories were reconstructed using historical records.
The method used for image data analysis is based on manual interpretation. We start by defining target areas based on historical records and on personal observation, then we select imageries satisfying minimum wind conditions and covering study areas, we reconstruct surface wind speed histories, geometric image transformation, image contrast/brightness manipulation to optimize slick discrimination, an overlay analysis incorporating oil well location layer to discriminate ships and oil production facilities. Finally we perform manual image interpretation to discriminate various oil slicks and conduct the comparison between different satellite sensors (Berry, 1995). Some field pictures of historical oil contamination in the UAE waters were obtained from NOAA historical oil spills information.

Results and discussion

The manual interpretation results indicate that certain coastal areas of the UAE face frequent oil spills. Striking examples of oil slicks are shown on figure 2, offshore Fujairah (centered at the coordinates 25o30’N/56o25’E). Here considerable spill concentrations have been found within successive JERS- 1 OPS, Landsat-7 ETM+ images and ERS-1/2 SAR browse images. Figure 2 compares images from 29 June 1992, 21 May 1995 and 28 May 2000 for the same area of offshore Fujairah. Oil discharged from both anchored and moving vessels can be observed in each image. Immediately after discharging flush ballast water, the simmering water surface can be seen as bright silver to gray colour patches on the surrounding water. Based on the size of the image pixel, most of the vessels are super tankers whose hull is more than 300 m in length.

img48

Figure 1: Demonstration Study Areas. Remarkable Oil accidents in the Gulf region

img49

Table 2: Satellite imagery investigated during the study project

«Previous 1 2View All| Next»

Pages: 1 2

1 Star2 Stars3 Stars4 Stars5 Stars (No Ratings Yet)
Loading...


Leave your response!

Add your comment below, or trackback from your own site. You can also subscribe to these comments via RSS.

Be nice. Keep it clean. Stay on topic. No spam.