| GIS | |
Oil spills pollution
|
||||||||
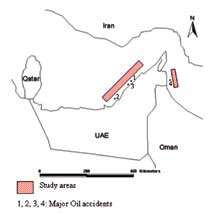
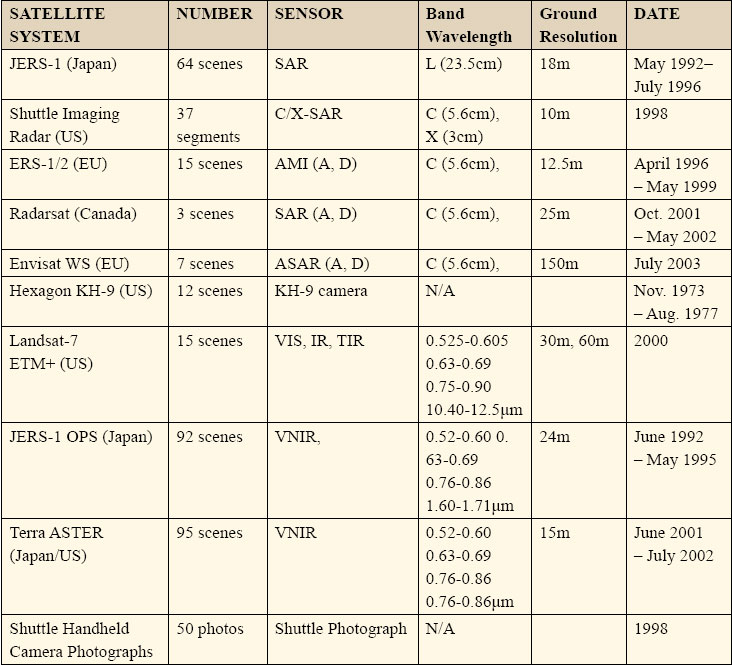
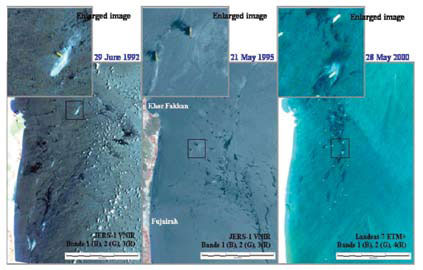
Study areasThe study areas are situated in the Arabian Gulf. -It is a shallow sea with its long axis oriented in NW-SE direction, and its average water depth is about 36m. The Evaporation and wind are the main driving forces for water circulation in the Arabian Gulf. Evaporation is stronger in winter due to high wind speed, than summer when the water surface temperature is higher. The overall circulation in the inner Arabian Gulf is cyclonic, with relatively fresh water entering through the Strait of Hormuz. MethodologyMore than 300 satellite images have been examined during this study (Table 2). ERS-1/2, RADARSAT, and ENVISAT Cband SAR data has been used for the great majority of oil spill detection operations. However, other satellite images including optical sensor images have shown good detection capabilities. Therefore, we looked for all available image data archives and selected more than one hundred images derived from different platforms that covered most of the offshore waters of the UAE. We conducted a search of ERS-1 and 2 data archives to compile a list of all images acquired over the study areas. To evaluate their suitability for slick detection, historical wind conditions for corresponding SAR images were obtained. For each acquisition date, surface wind speed histories were reconstructed using historical records. Results and discussionThe manual interpretation results indicate that certain coastal areas of the UAE face frequent oil spills. Striking examples of oil slicks are shown on figure 2, offshore Fujairah (centered at the coordinates 25o30’N/56o25’E). Here considerable spill concentrations have been found within successive JERS- 1 OPS, Landsat-7 ETM+ images and ERS-1/2 SAR browse images. Figure 2 compares images from 29 June 1992, 21 May 1995 and 28 May 2000 for the same area of offshore Fujairah. Oil discharged from both anchored and moving vessels can be observed in each image. Immediately after discharging flush ballast water, the simmering water surface can be seen as bright silver to gray colour patches on the surrounding water. Based on the size of the image pixel, most of the vessels are super tankers whose hull is more than 300 m in length. Figure 1: Demonstration Study Areas. Remarkable Oil accidents in the Gulf region Table 2: Satellite imagery investigated during the study project |
||||||||
Salem Issa
|
|||||||||||||||
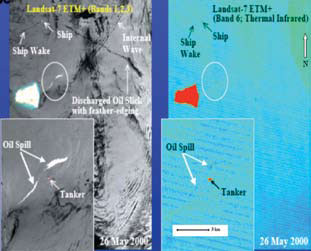
| Fujairah Port Authority has introduced Fujairah Offshore Anchorage Area (FOAA) since February 1993 to restrict and prohibit anchoring in the area from Bidiya (north of Khor Fakkan) to Dibba. Shipping routes bordering the UAE with relatively frequent incidences of oil spills include the offshore area running parallel to the coast of Abu Dhabi, Dubai, Sharjah and Ajman, where intensive oil production activities exist, and the routes through the Strait of Hormuz. Attention was focused on monitoring natural seepage of oil in the area with coordinates 54º 00′ E/25º 15′ of the offshore of Abu Dhabi. The analysis was carried out using images from, ERS- 2 SAR, and RADARSAT-1 SAR images. Beside the SAR images, other sensors were tested to detect oil slicks in the study areas. In the thermal infrared band images an oil slicked surface shows a lower brightness temperature than the surrounding clear water surface (Figure 3). The image data observed at night time is a more reliable method for determining water temperature because it avoids the influence of solar illumination on the difference between seawater and oil slicks. This study is probably the first time that oil pollution has been monitored and mapped at National level over quite a wide sea area in the UAE, using high spatial resolution satellite images of varying sensor types. Standards followed to produce the atlas follow international standards; well known international examples (Al-khudhairy, 2002; European Commission, 2001) were consulted. Examples of maps appearing in the oil spills Atlas are presented in figures. Figure 2: JERS-1 OPS and Landsat-7 ETM+ showing oil discharged, offshore Fujairah, oil tankers anchorage points in the Gulf of Oman. Images are from 29 June 1992, 21 May 1995 and 28 May 2000 ConclusionsResults of this study demonstrate and confirm that the offshore UAE faces frequent occurrences of oil spills both in the Arabian Gulf and the Gulf of Oman. In particular offshore Fujairah in the Gulf of Oman there are considerable spill concentrations found in the multi-temporal image analysis. The spills are thought to be caused by high oil content ballast water discharged from giant oil tankers. It is worth stressing here that the identification of such areas is an important step for any effective monitoring scheme based on space-borne imagery, which is attainable with the current acquisition conditions. Figure 3: Comparison between Landsat-7 ETM+ visible bands composite and thermal infrared band images. milestone on the road to achieve an early warning system against oil pollution in the Gulf. Gulf States coastlines host most of its capitals, greatest cities and water desalination plants making them highly vulnerable to any offshore oil accident. ReferencesBerry, J. L., 1995. Detecting and evaluating oil slicks on the sea surface. Space Congress on Remote Sensing for Oil Exploration and Environment, 23- 24 May, Bremen, Germany, pp. 90-110. |
|||||||||||||||
|
|||||||||||||||
|
Pages: 1 2


 (No Ratings Yet)


Leave your response!