| Surveying | |
National Forest Cover Assessment
|
|||||||||||||||
|
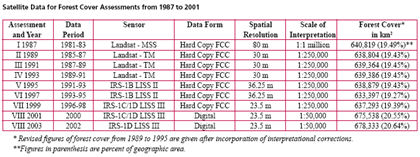
Space borne Remote Sensing technology has proved to be an important tool in rapid assessment and mapping of natural resources over a large area with reasonable accuracy. Application of satellite data in assessment of forest cover in India was first demonstrated by the National Remote Sensing Agency (NRSA), Department of Space, Hyderabad in 1985 when it came out with first ever estimate of country’s forest cover based on interpretation of Landsat (an American Satellite) data. Almost simultaneously, Forest Survey of India (FSI), Ministry of Environment & Forests started interpretation of satellite data for assessment of forest cover of the country and published country’s forest cover in 1987 using Landsat (MSS) data, the most reliable data at the time. Thereafter, FSI was mandated to assess and map the forest cover of the country on a two-year cycle and monitor the changes in forest cover during the intervening period. Since then FSI is assessing and mapping forest cover of the country using satellite data on a two-year cycle. Results of these assessments are published in the form of a biennial report- State of Forest Report (SFR). So far FSI has completed nine biennial assessments, the latest being the State of Forest Report, 2003. During this period, there had been a rapid development in satellite-based technology and also in related high-end hardware and software for digital image processing of satellite data. FSI kept pace with these developments by continuously updating its methodology to suit the new developments. Each assessment had improvement over the previous one and some unique features. Following is a brief account of special features of each assessment made by FSI since 1987 is given below: SFR 1987The first satellite data based assessment of forest cover made by FSI was published as the State of Forest Report 1987. It was based on the visual interpretation of Landsat Multi Spectral Sensor (MSS) satellite data with spatial resolution of 80m x 80m pertaining to the period 1981-83. The scale of interpretation was 1:1 million and cartographic limit of mapping was 400 ha. Thus patches of forest cover more than 400 ha only could be delineated. Interpretation was followed by extensive ground truthing. The forests were classified into dense forest (crown cover of more than 40%) and open forests (crown cover between 10-40%). Mangroves were delineated as a separate class. Degraded forests having crown cover of less than 10% were classified as scrub (a non-forest category). The forest cover of the country was estimated to be 640,819 km2 which was 19.52% of the country’s geographic area. SFR 1989The second assessment was based on the satellite data of Thematic Mapper (TM) of Landsat that had a resolution of 30m x 30m. The data period was 1985-87. Technique of interpretation remained visual but the scale of interpretation improved to 1:250, 000. As a result cartographic limitation improved to 25 ha and forest cover could be estimated with better accuracy. As per SFR 1989, forest cover of the country was 640,134 km2 (19.47% of country’s geographic area). SFR 1991The third assessment was based on satellite data pertaining to the period 1987-89. The sensor of the satellite, its resolution, method of interpretation and cartographic scale were the same as used in the 1989 assessment. However, there were some improvements in this assessment over the previous ones. Geographic area figures of the country, states and districts were revised based on figures received from the Survey of India and accordingly area under forest cover was computed. Another important feature of this assessment was that for the first time FSI provided District-wise forest cover of the country. The forest cover was estimated to be 639,182 km2 (19.44% of the geographic area). During this period, an important development, at FSI was the procurement of the then state of art computer (VAX-11/780) in 1989 which made the beginning of digital interpretation of satellite data. Digital interpretation has the advantage of overcoming subjectivity prevalent in visual interpretation. In order to develop the technique of digital interpretation of satellite data, a full-fledged separate unit called National forest Management Centre (NFDMC) within FSI, Dehradun was created in 1989. SFR 1993The fourth assessment marked a modest beginning in the field of digital interpretation when forest cover of some parts of Bihar, Himachal Pradesh, Madhya Pradesh and Uttar Pradesh was assessed digitally. In this assessment, satellite data of Landsat-TM for the period 1989-91 was used and scale of mapping was 1:250,000scale. As per this assessment, forest cover of the country was 640,107 km2 (19.47% of its geographic area). SFR 1995Though the method of interpretation and scale of mapping remained same in this cycle, but the most significant feature of this assessment was the use of Indian Remote Sensing Satellite (IRS-1B) data for the period 1991- 93. While data pertaining to most of the States was interpreted visually, data of Madhya Pradesh, Maharashtra (Part) and Orissa (Part) was processed digitally. This report showed forest cover of the country as 639,600 km2 (19.45% of the geographic area). This report also contained information on growing stock (above ground wood volume) of country’s forests and its annual increment. Country’s total wood volume was estimated to be 4741 million m3 and volume per ha was estimated as 74.42 m3. The annual increment of India’s forests was estimated at 87.62 million m3. SFR 1997It was based on IRS-1B (LISS-II) data pertaining to the period 1993- 95. Satellite data of Madhya Pradesh and Maharashtra was interpreted digitally while for other States visual interpretation was done. The scale of mapping remained 1:250,000 scale. As per this report, forest cover of the country was 633,397 km2 (19.27% of the geographic area). Salient feature of this report was that for the first time FSI provided forest cover information on Hill districts and Tribal districts. This report also provided revised estimates of forest cover of previous assessments after adjusting corrections due to interpretational errors or due to other reasons. Another very significant field-inventory based finding of this report was that in Haryana State, wood volume of areas outside forest was about seven times higher than that inside forest areas. SFR 1999There was a significant improvement in the infrastructure in NFDMC due to procurement of high-end workstations and state of art software for digital image processing. Due to this, satellite data of fourteen States/ Union Territories (UTs) could be interpreted digitally. The data for the remaining States/UTs was interpreted visually on 1:250,000 scale. Though digital interpretation was done on 1:50,000 scale, the interpretation was transformed to 1:250,000 scale to make the data comparable with the previous assessment for detecting real changes. Satellite data of LISS-II of IRS-1B and LISS-III of IRS-1C & 1D for the period 1996-98 was used in this assessment. Forest cover of the country was assessed to be 637,293 km2 (19.39% of the geographic area). The report provided not only forest cover in Hill and Tribal districts but also valuable information on forest plantations raised since 1951 to 1999, land use in the country, forests in villages, area under Joint Forest Management (JFM) and Protected Areas, mining in forest areas and shifting cultivation in North-East region. During this period, three large States namely Bihar, Madhya Pradesh and Uttar Pradesh were bifurcated to constitute three new States namely Jharkhand, Chhattisgarh and Uttaranchal. FSI issued a supplementary to SFR, 1999 providing information on these six newly carved States. SFR 2001With the availability of efficient digital image processing software and powerful workstations, and capacity building of technical manpower of FSI, it became possible for FSI to completely switch over to digital interpretation of satellite data. Consequently, FSI interpreted the satellite data of the entire country (LISS-III of IRS-1C & 1D of the year 2000) through digital image processing at 1:50,000 scale during this cycle. The improvement in the methodology led to generation of a new baseline data on forest cover as for the first time FSI could map forested areas down to 1 ha while in the previous assessments this limit was 25 ha. As per SFR 2001, the forest cover of the country has been assessed to be 675,538 km2 (20.55% of the geographic area). In addition, FSI also estimated tree cover which were less than 1 ha in extent or which could not be captured in the satellite data. The area under tree cover was estimated to be 81,472 km2 (2.48% of geographic area). Forest and tree cover of the country thus was estimated to be 757,010 km2 (23.03% of the geographic area). Mangrove cover though assessed separately, were merged with the corresponding density classes of the forest cover. SFR 2003This has been the latest series, where satellite data of LISS III of IRS-1D for the period 2002 was interpreted digitally. The significant features of this report were (i) introduction of an additional density class by bifurcating dense forest (with more than 40% canopy density) into Moderately Dense Forest (canopy density between 40% and 70%) and Very Dense Forest (canopy density of more than 70%), (ii) use of high resolution data in tree cover estimation and (iii) estimation of growing stock of the country’s forests. The forest cover of the country was assessed to be 678,333 km2 (20.64% of geographic area), tree cover was estimated as 99,896 km2 (3.04% of geographic area) and total forest and tree cover was thus estimated to be 778,299 km2 (23.57% of geographic area). The total growing stock of the wood in the country was estimated to be 6,414 million m3 that includes 4,782 m3 inside forest area and 1,632 m3 of TOF (Trees outside Forests). The average growing stock per ha of recorded forest area worked out to be 61.72 m3. A summary of the forest cover assessments made by the FSI since 1987 is given in the following table, which provides the synoptic view of the technological and methodological changes. FSI is currently working on the tenth cycle of forest cover assessment which will be published as SFR 2005. For this assessment, FSI is using LISSIII data of IRS- P6. In addition, FSI is also procuring high resolution data of LISS-IV (resolution of 5.8m x 5.8m) for remote areas where accessibility is a problem and also for areas vulnerable to shifting cultivation, encroachments, mining etc., FSI is also carrying out a number of remote sensing and GIS based national level projects taking the advantage of advancements in remote sensing technology. |
|||||||||||||||
|
|||||||||||||||
|


 (1 votes, average: 3.00 out of 5)


