| Surveying | |
LIDAR for visualization of 3D geological models
Geological researches have increased the utilization of tridimensional models in the last years in order to make possible visualization, parametrization and interpretation of data. The LIDAR technique allows to acquire a huge amount of georeferrenced data using a Terrestrial Laser Scanner (TLS). Both fastness and accuracy are the main characteristics of this equipment. Its utilization in geological studies has started in the last decade (Bellian et al., 2002), but only in the last years the number of scientifi c articles has increased signifi cantly. The TLS acquires georeferrenced point clouds that can be converted in digital models after processing, especially digital outcrop models (DOM). Digital Outcrop Models obtained from TLS have been expanding worldwide in the last years. There are relatively few studies that used laser scanners for generating tridimensional outcrop models. Research using the LIDAR technique is still incipient and requires improvements, especially concerning processing, visualization, geological interpretation and integration with other databases. The integration with other available geotechnologies such as total station, GPS and high-resolution digital photographs allows creating models with high accuracy and visual quality, which enhance geological features and help to interpretate DOMs under a geological point of view. Recent applications in geology has yielded good results (Pringle et al., 2004, Bellian et al., 2005; Buckley et al., 2008; Fabuel-Perez et al., 2009; Rotevatn et al. 2009; Ferrari et al., 2011). TLS is capable of capturing hundreds of millions of points with three-dimensional coordinates. The equipment emits laser a pulse with the aid of a scanning mirror. This pulse hits the object and part of the energy return to the system. Thus, knowing the geodetic coordinate of the TLS station, the speed of the laser propagation and the time between the transmission and reception of the laser pulse is possible to determine the distance between the sensor and the object, calculate the geodetic position of each point and, consequently, reconstruct the surface of the object. New procedures and methods involving remote sensing techniques and DOMs are crucial for improving the quality of tridimensional geological models and, consequently, their interpretations. Nowadays, the huge volume of data, the lack of optimized processing resources and the inadequate dataset management became visualization and interpretation of DOMs a diffi cult task. Furthermore, it is necessary to develop a software with an effi cient tridimensional visualization system with specifi c tools for geological interpretations. The main goal of this study was to set up some key guidelines for generating 3D DOMs. Materials and methodsDatabase
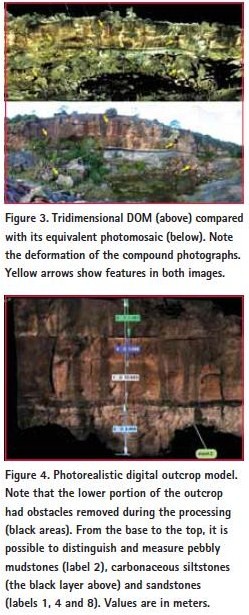
The following equipment and softwares were used in this work, as follow: MethodsFieldwork – Tracking the Geodetic MarkerThe acquisition of fi eld data with GPS was needed as the fi rst step to determine the coordinates of a geodetic marker, tracked for 4 hours with a dual frequency GPS (L1, L2). The transport of the coordinates was performed from points of the Brazilian Network for Continuous Monitoring (RBMC) of the Brazilian Institute of Geography and Statistics (IBGE), located in Santa Maria (SMAR) and Porto Alegre (POAL). Fieldwork – Scanning the outcrop with Terrestrial Laser Scanner 3DThe integrated utilization of a GPS-RTK together with the TLS in both the control points was necessary for guaranteeing the accuracy of the data. This technology allows the real-time correction based on radio frequency. The coordinates obtained from two different scanning stations were used for georeferrencing the point cloud acquired with the TLS. It was necessary to locate the equipment in two different stations in order to assure a minimum of 10% of overlap between the two shots. This procedure was previously recommended by Bellian et al. (2005) to avoid and/or minimize effects caused by shadows during scanning. It was adopted as a parameter for the scanning a spacing ranging from 1 mm to 3 cm between the dots, which generated a cloud with 151,395,728 points. The total time involved in this procedure lasted approximately eight hours. For a good acquisition it was necessary good illumination conditions, i.e., few clouds, sun light directly on the outcrop and low amount of aerosols in order to ensure a better quality of the digital photographs, once that TLS has a digital camera integrated in the system. Good photographs are necessary to associate the RGB pattern of the digital photos with the point cloud, allowing the visualization of DOMs with good quality for geological purposes (Fig. 3). Image processing techniques were also used for improving the quality of digital photographs by the manipulation of properties as brightness, contrast and intensity. Data processingThe data collected with the TLS were downloaded using the software Parser® whereas the processing of the point cloud was performed with the software Polyworks®. Four steps were necessary, as follow: Results and discussions
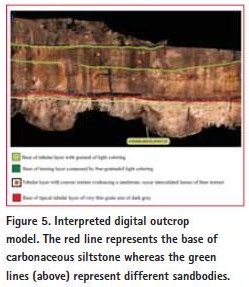
This study has shown that LIDAR/TLS is an effi cient technique for geological purposes. DOMs are an effi cient tool for helping in the planning a field activity as well as in high accuracy measurements of geological features such as thickness of beds, size of clasts and orientation of fractures. Moreover, a database formed by DOMs can help to preserve geological data, either in situations involving degradation by weathering, common in tropical areas, or antropic action, for example, mining and civil engineering activities. The geological interpretations are still limited due to utilization of a conventional CAD-based software for manipulation and processing of point clouds, in which is available only lines, polylines and polygons (Fig. 4). Moreover, the huge amount of data has been an additional problem due to limitations of the central processing unit (CPU) of desktop computers. Preliminary results approaching graphic processing unit (GPU) have shown improvements in handle a large amount of points with fastness and efficiency. AcknowledgmentsThe authors would like to thank CAPES for supporting the first author with a PhD schoolarship. LCI is supported with a partial PhD scholarship from the Milton Valente Program. LJ and DL were supported with schoolarships of the National Council for Scientifi c and Technological Development (CNPq). This project was fi nancially supported by PETROBRAS through the projects NEAP (16 – SAP 4600242459) and “Mapeamento 3D Georreferenciado de Afl oramentos Utilizando uma Técnica LIDAR” (0050 0044869. 08.4 – SAP: 4600285973) and FAPERGS, project “Modelos Digitais de Afl oramentos como ferramenta na análise e interpretação geológica” (ARD – Process 10/0477-0). ReferencesBellian, J.A.; Jennette, D.C.; Kerans, C.; Gibeaut, J.; Andrews, J.; Yssldyk, B.; Larue, D. 2002. 3-Dimensional digital outcrop data collection and analysis using eye-safe laser (LIDAR) technology: American Association of Petroleum Geologists (AAPG). Search and Discovery Article 40056, Available at http://www.searchanddiscovery. net/documents/beg3d/index.htm).
|


 (5 votes, average: 2.20 out of 5)


Leave your response!