| Positioning | |
Indoor Positioning Using Probabilistic Virtual Anchor Point Graphs
Hybrid indoor positioning with concept of Virtual Anchor Points along with Bluetooth Low Energy tags saves infrastructure and maintenance costs |
 |
|
Along with the evolution of mobile devices a wide landscape of applications tailored for mobile usage has been developed. To make them as smart as possible most of them take the user’s current context into account, amongst others time and location. While location in outdoor environments can be easily obtained from GPS sensors, in indoor scenarios this is not possible due to shielding and scattering of GPS signals.
Enabling indoor positioning has been a large research field during the last years with approaches relying on dead reckoning, Bluetooth, and Wi-Fi signals. Especially the last technology gained a lot of attention since Wi-Fi fingerprinting solutions turned out to be among the most accurate ones [1].
Additionally, after releasing the Bluetooth Low Energy (BLE) standard a new class of devices was unveiled: the socalled BLE beacons or tags. Once deployed at a fixed position they provide a proximity interface for positioning, dividing distance into discrete factors like far, near and immediate.
In our concept called Virtual Anchor Points (VAP) [2], we demonstrated how unambiguous patterns of receivable Wi-Fi fingerprints can be extracted from timeseries of Wi-Fi readings. Furthermore, these patterns can be used to form virtual beacons providing a proximity interface analogous to BLE tags. That is why we called our concept Virtual Anchor Points.
In this paper we extend the existing proximity detection algorithm using a simple next neighbor classifier with a solution called graph particle filter. In the next section, we provide an overview over the related work and show the differences to our system. Next, in the third Section we give a short explanation of the VAP concept and describe how this concept can be extended with a particle filter. Afterwards we evaluate the graph particle filter comprehensively against our existing approach and conclude the results in the last section.
Related work
The research field for indoor positioning using Wi-Fi infrastructure is comprehensive: one of the first solutions was RADAR [3]a radiofrequency (RF based on next neighbor matching of fingerprints. Further improvements to Wi-Fi fingerprinting were introduced by using probabilistic frameworks [4], [5] and sensor fusion combining IMU data and Wi-Fi data in particle filtering methods [6]–[9].
In this paper we extend the simple next neighbor proximity detection method used in the online phase of the Virtual Anchor Points concept with a new one called graph particle filtering, which solely relies on time and Wi-Fi data without incorporating further sensor data.
Method
In this section we first describe briefly how Virtual Anchor Points are extracted from Wi-Fi time series data during the offline phase and present the existing proximity detection based on a next neighbor classifier as well as the new graph particle filter detection for online usage.
Creating Virtual Anchor Points
We use Wi-Fi time series as input data in which each timestamp is associated with a set of Basic Service Set Identifications (BSSID) b and their respective Received Signal Strength Indications (RSSI) r from access points (AP) within reach . ![]() Based on this time series data VAPs are created with three steps: first, candidates for anchor points are extracted from the time series data. Next, these candidates are projected into a lower dimensional space using multidimensional scaling. Within this space, unambiguous candidates can be filtered out from ambiguous ones, resulting in a final set of VAPs.
Based on this time series data VAPs are created with three steps: first, candidates for anchor points are extracted from the time series data. Next, these candidates are projected into a lower dimensional space using multidimensional scaling. Within this space, unambiguous candidates can be filtered out from ambiguous ones, resulting in a final set of VAPs.
We assume that our time series data carry annotations about the places visited during recording, which can be used for the extraction of candidates. Using a time window of five seconds around an annotation we calculate the mean RSSI and its standard deviation for each measured BSSID. Thus, for each annotation we have a set of quadruples (b, μ, σ, n) with b denoting the BSSID, μ and σ describing a normal distribution using mean, and standard deviation and denoting the number of measurements for b in the time window. Sets of quadruples with the same annotation are merged with the portioning algorithm from Chan et al. [10] to a candidate
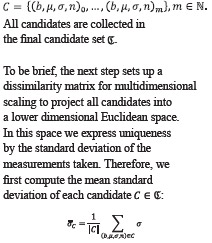
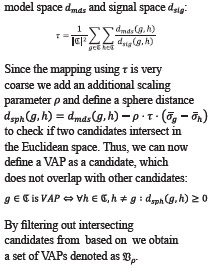
Next, we have to scale this value into the model space, thus we calculate the mean ratio between pairwise distances in
Proximity detection using next neighbor classifier
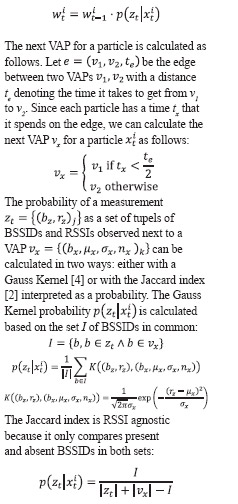
Since RSSI varies highly over time even at the same place [11]–[13] we implemented a first in first out (fifo) queue with fixed size to keep track of the last n measurements (Figure 1). This queue supports two different operations: first, returning the union set of all seen BSSIDs and second, returning the intersection set of all BSSIDs, both with their respective mean RSSIs. Thus, querying the queue results in an aggregated measurement ẑt combining multiple single measurements z.
Proximity detection using graph particle filter
Since all VAPs have their origin in time series, the previous and next VAPs can be easily derived from this data. Thus, we are able to connect all VAPs in a graph G=(V, E) with each VAP as a vertex and edges denoting if two VAPs are next to each other and labeled with the time it takes to walk from one VAP to another.
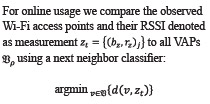
Our existing approach for detecting the next VAP is based on simple next neighbor algorithm, which calculates the distance from the currently observed fingerprint and all VAPs and returns the VAP with the lowest distance. However, this approach does not take previous proximity detections into account, which can be helpful if RSSIs have a large variance. To make our novel method more robust and less dependent on single measurements we implemented a particle filter on this graph.
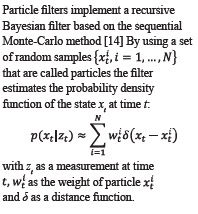
In our case particles travel along edges based on the time between two measurements and are weighted according to the probability that the current measurement is observed next to a VAP.
Furthermore, the fifo-queue described above can be applied to the graph particle filter as well to obtain a more stable and reliable measurement.
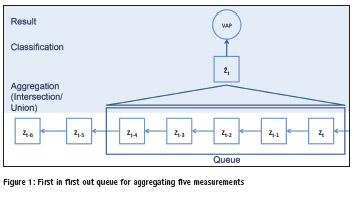
Figure 2 shows an example how particles are distributed equally on all edges of the graph after initialization. Blue points symbolize the particles on the edges with their heading depicted in the arcs. Since the graph is directed, but edges can be traversed in both directions, there is an edge for each direction, labeled with the time it takes to walk from one VAP to another. At this state, each VAP has an equal probability of being the next anchor point, which is indicated by the value behind the label.
Evaluation
In this section, we show how the graph particle filter approach performs against the existing next neighbor classifier. To make the particle filter results comparable with the next neighbor approach, we concentrated on VAP vertices in the graph with at least one neighbor. Thus, we adapted our test dataset [2] as well and evaluated on 6,203 fingerprints containing RSSIs from 242 different BSSIDs.
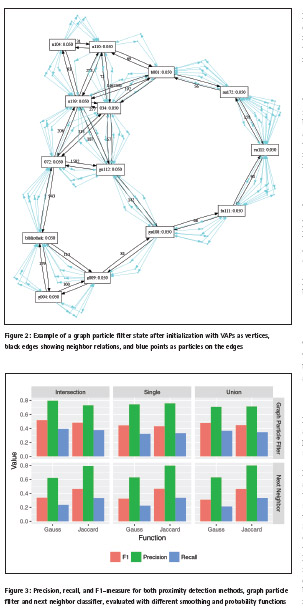
Figure 3 depicts how both proximity detection algorithms behave with different aggregation methods and different probability functions. In all experiments the precision is about two times higher than the recall with a precision mean value of 0.73 versus a recall mean value of 0.32. Given a new measurement a high precision is desirable for predicting the next VAP.
Generally speaking, the graph particle filter performs 6 % better using a Gauss kernel than the Jaccard index with respect to the F1-measure. In contrast the next neighbor classifier works best with the Jaccard index, which is a 43 % improvement in F1-measure over a Gauss kernel.
If we take a closer look at the interaction between aggregation methods and probability functions, differences get more obvious. As already stated in our previous work, the next neighbor classifier works best with the Jaccard index in combination with the union set aggregation method. This combination leads to a precision of 0.80, a recall of 0.33, and an overall F1-measure of 0.46. The graph particle filter has its best performance after aggregating using the intersection method and comparing the measurement with the Virtual Anchor Points using a Gauss kernel. Here, we have a precision of 0.80, a recall of 0.39, and an overall F1-measure of 0.51.
Thus, with respect to precision, both methods perform equally, but recall is 18 % higher when using the graph particle filter instead of the next neighbor classifier. In the end, the graph particle filter has 12 % higher F1-measure than the next neighbor classifier.
Both methods behave completely different when using the same aggregation and probability functions. The graph particle filter works best with the Gauss kernel and an aggregation based on the intersection set of all observed access points. Both parts are closely related because the Gauss kernel takes the RSSIs into account and by focusing on the BSSIDs, which were observed in all measurements of the fifo-queue, their RSSI values become stable. Additionally, the graph particle filter takes the previous state into account and allows no jumps in the graph, leading to a further stabilization of all predictions. In contrast to this, the next neighbor classifier performs best when using the Jaccard index, which is completely RSSI agnostic. Since it only compares the present and absent BSSIDs, the union set of all measurements provides more information about the APs within reach. For a prediction that has no information about the past this approach combines the most information without relying on unstable RSSI data.
Conclusion
In this paper we extended our existing concept of VAPs and their proximity detection with a novel approach that we call graph particle filter. In contrast to other methods that use sensor fusion, our particle filter takes only time and Wi-Fi readings for predicting the next VAP. Using this filter we could improve the proximity detection compared to the existing next neighbor classifier by 12 % (F1-measure) and gain an overall precision of 80 %.
Our graph particle filter is not limited to VAP but can also include BLE tags as nodes, leading to a hybrid framework that can serve as an abstraction layer over physical tags and VAPs.
In future work, we want to extend this set of VAPs with points in signal space, which are sufficiently distinguishable from the current set of VAPs and which have a sufficient support in the time series set in the sense that enough people have observed these places. These points could then be pushed out to the service asking users to assign labels to them.
References
[1] H. Liu, H. Darabi, P. Banerjee, and J. Liu, “Survey of Wireless Indoor Positioning Techniques and Systems,” IEEE Trans. Syst. Man Cybern. Part C (Applications Rev., vol. 37, no. 6, pp. 1067–1080, Nov. 2007.
[2] E. J. Hoffmann, M. Werner, and L. Schauer, “Indoor navigation using virtual anchor points,” in 2016 European Navigation Conference, ENC 2016, 2016.
[3] P. Bahl and V. N. Padmanabhan, “RADAR: an in-building RF-based user location and tracking system,” in Proceedings IEEE INFOCOM 2000. Conference on Computer Communications. Nineteenth Annual Joint Conference of the IEEE Computer and Communications Societies (Cat. No.00CH37064), 2000, vol. 2, pp. 775–784.
[4] T. Roos, P. Myllymäki, H. Tirri, P. Misikangas, and J. Sievänen, “A Probabilistic Approach to WLAN User Location Estimation,” Int. J. Wirel. Inf. Networks, vol. 9, no. 3, pp. 155–164, 2002.
[5] M. Youssef and A. Agrawala, “The Horus WLAN location determination system,” in Proceedings of the 3rd international conference on Mobile systems, applications, and services – MobiSys ’05, 2005, p. 205.
[6] J. Seitz, T. Vaupel, and J. Thielecke, “A particle filter for Wi-Fi azimuth and position tracking with pedestrian dead reckoning,” in 2013 Workshop on Sensor Data Fusion: Trends, Solutions, Applications (SDF), 2013, pp. 1–6.
[7] M. M. Atia, M. J. Korenberg, and A. Noureldin, “Particle-Filter- Based WiFi-Aided Reduced Inertial Sensors Navigation System for Indoor and GPS-Denied Environments,” Int. J. Navig. Obs., vol. 2012, pp. 1–12, Jun. 2012.
[8] N. Zhu, H. Zhao, W. Feng, and Z. Wang, “A novel particle filter approach for indoor positioning by fusing WiFi and inertial sensors,” Chinese J. Aeronaut., vol. 28, no. 6, pp. 1725–1734, Dec. 2015.
[9] Z. Wu, E. Jedari, R. Muscedere, and R. Rashidzadeh, “Improved particle filter based on WLAN RSSI fingerprinting and smart sensors for indoor localization,” Comput. Commun., vol. 83, pp. 64–71, 2016.
[10] T. F. Chan, G. H. Golub, and R. J. LeVeque, “Updating formulae and a pairwise algorithm for computing sample variances,” in COMPSTAT 1982 5th Symposium held at Toulouse 1982, 1982, pp. 30–41.
[11] K. Kaemarungsi and P. Krishnamurthy, “Properties of indoor received signal strength for WLAN location fingerprinting,” in Proceedings of MOBIQUITOUS 2004 – 1st Annual International Conference on Mobile and Ubiquitous Systems: Networking and Services, 2004, pp. 14–23.
[12] M. Kranz, C. Fischer, and A. Schmidt, “A comparative study of DECT and WLAN signals for indoor localization,” in 2010 IEEE International Conference on Pervasive Computing and Communications (PerCom), 2010, pp. 235–243.
[13] K. Kaemarungsi and P. Krishnamurthy, “Analysis of WLAN’s received signal strength indication for indoor location fingerprinting,” Pervasive Mob. Comput., vol. 8, no. 2, pp. 292–316, Apr. 2012.
[14] M. S. Arulampalam, S. Maskell, N. Gordon, and T. Clapp, “A tutorial on particle filters for online nonlinear/ non-Gaussian Bayesian tracking,” IEEE Trans. Signal Process., vol. 50, no. 2, pp. 174–188, 2002.


 (No Ratings Yet)


Leave your response!