| Geodesy | |
Improved concepts of using natural targets for geo-monitoring
Based on data acquired by a single total station of a landslide area in the Bavarian Alps, three different analyzing concepts are described and evaluated. These methods use images, point clouds, and a fused approach of both data types |
 |
|
 |
|
 |
|
 |
|
Due to the increasing probability of rock falls and landslides caused by environmental change, the necessity for monitoring of geo-risk areas is growing. In particular, the degradation of mountain permafrost will be a challenge of the future.
In Europe, case-by-case services in the area of geo-risk monitoring and management are mainly provided by small and mediumsized enterprises. Most projects are based on conventional techniques, like Terrestrial Positioning Systems (TPS), Terrestrial Laser Scanners (TLS), (Stereo) Photogrammetry, Global Navigation Satellite Systems (GNSS), or/and geotechnical methods. As shown in Wagner et al. (2014), the geodetic methods generally differ from each other in cost, spatial and temporal resolution, range, dependence from weather or light conditions, energy, communication link requirements, as well as in the necessity to access the possibly endangered surveillance area.
Due to the rapid hardware development most of these techniques/sensors are already unified in a single (universal) instrument (Wunderlich et al. 2014): a modern total station. These devices are equipped with a multitude of sensors for accurate angle and distance measurements to prisms and less precisely to nearly any other surface, tilt correction by 2-axis inclinometers, automatic target recognition and tracking, GNSS positioning, overview and telescope cameras, as well as a scanning function with up to 1000 points per second. This enables us to develop entirely new measurement approaches for surveying tasks and, especially, for (geo-)monitoring projects, where repeated measurements of artificial or natural structures have to be performed. The integration of cameras and the increasingly faster scanning capabilities in modern total station allow us to replace signaled artificial control points by (non-signalized) natural objects. This provides several advantages: No artificial targets have to be placed onsite/ on the object which saves equipment and installation costs and prevents access of endangered areas. The observation range of the system can easily be expanded to additional areas without any installation. Depending on the natural features used, an area-based dense acquisition is possible. In total, a higher flexibility and a faster system setup is provided.
At the Technical University of Munich (TUM) – Chair of Geodesy, different geomonitoring approaches have been and are continually being developed. Most of them are based on modern scanning and image assisted total stations, which are described briefly in this paper.
Modern total stations
The introduction of electronic total stations has already changed the survey processes and the methodology enormously. For example, the electronic data flow, reflectorless (RL) measurements to any surface, and motorized axes have reduced the size of survey teams from previously three or more persons to a single one. The result is a more economic surveying, not necessarily a more enjoyable.
Yet another innovative step forward is the ongoing integration of camera chips and the implementing of scanning functions in the devices. Currently all major manufacturers of total stations have released instruments with at least one integrated camera. These devices are commonly referred to as Image Assisted Total Stations (IATS). Instruments of the Leica Nova and Topcon Imaging Station series further provide an additional coaxial camera which benefits from the magnification of the telescope, resulting in a very high spatial resolution of the images, especially compared to the additional built-in wide angle overview cameras. An overview of all current commercially available IATS is given in Wagner (2016).
Each image taken by a calibrated total station camera is accurately geo-referenced and oriented. It can be immediately used for direction measurements with no need for object control points or further photogrammetric orientation processes. Currently, the camera images are only used to ergonomically optimize the standard measurement procedure, e.g. by replacing the view through the telescope and/or to transfer it to the range pole via remote control. Furthermore, the image and video function is used as a support capacity for the standard field survey tasks of a total station. In detail these are:
• documentation,
• aiming support,
• overlay of the live video stream with measurements, planning data or sketches,
• photogrammetric post processing,
• scan area selection,
• georeferenced photo texture,
• very simple edge and point detection.
The last three items are implemented to support the scanning function of the devices (if available). In most cases, this scanning function is only an automation of subsequent single RL point measurements. However, recently an instrument with a scan rate of up to 1000 points per second was released. This frequency is comparable to that of a laser scanner of the first generation, such as the Cyrax 2500. It is now possible to generate dense 3D point clouds of the surveillance area in addition to the normal survey task and further to develop new survey and analysis concepts, such as those as described later in this article. It is merely a matter of time until other manufacturers attain comparable scan rates for their total stations.
Test site Aggenalm
The Aggenalm landslide in the Sudelfeld region of the Bavarian Alps near Bayrischzell has been used as an outdoor laboratory for various geo-deformation measurement systems and prototypes since 2007. The slide has been active since 1935; the last big event happened in 1997, when a debris flow originated from the landslide area after extreme precipitation. Currently, displacement rates with a magnitude of 1-2 cm per year makes it ideal for research activities (Thuro et al. 2010).
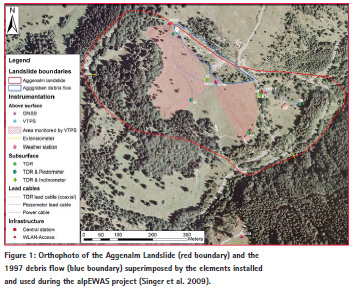
In the alpEWAS project (Development and Testing of an Integrative 3D Early Warning System for Alpine Instable Slopes, funded by the BMBF R&D program “Geotechnologien II” 2007-2010), several innovative measurement systems were evaluated, consisting of low-cost GNSS modules, time-domain-reflectometry inhole measurements (TDR), and image assisted tacheometry. Various measuring devices and infrastructure elements have been installed in the area, as shown in Figure 1. A main sensor node is set up at the center of the monitoring area, including a measurement pillar for surveying instruments, 230V power supply, a weather station, and a webcam. Remote sensing technologies are tested with fixed installed corner reflectors. In the surrounding area – distributed at geologically stable areas – a small number of control points are marked, which can be signalized with survey prisms.
This makes it possible to do timediscrete epoch measurements in intervals of several months or even years, as well as to run a permanent monitoring system or experiment. These surveys are always comparable, as the same geodetic reference datum can be used. The resulting spatial displacement vectors of observation points can further be verified by a classical deformation analysis.
Image-based approach
During the previously mentioned alpEWAS project, the first approach of using an IATS prototype for geo-monitoring was developed. The aim was to detect slope movements without artificial targets (i.e. reflectors) solely by monitoring natural objects. This is helpful in particular to avoid the loss of target points by destroyed reflectors, e.g. by grazing livestock, which frequently happens in the Alpine region. Further, the observation range of the system can easily be expanded to additional areas without any installation effort, e.g. when critical areas are not identified at the beginning of the monitoring task.
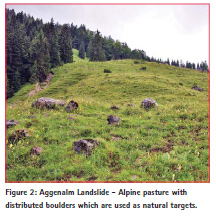
In the Aggenalm case, single distributed boulders, lying on the slope and being shifted by a possible slope movement, have been identified as appropriate objects (Figure 2). A prototype of an Image Assisted Total Station was used as measuring device, positioned on the pillar at the main sensor node (labeled as VTPS in Figure 1). The system was designed to automatically measure signalized stable control points to (re-)calculate the position and orientation. As object points, images of the boulders were taken and using image processing techniques these were matched with predefined templates. If a correspondence was found, the reference point of the template was precisely aimed by the instrument and a reflector-less distance measurement was initiated. As a result, a 3D coordinate of the natural target can be calculated and, in case of a movement between subsequent epochs, a spatial displacement vector can be specified.
Edge-based template matching and radiometric operators have been tested as image processing algorithms in the project. In the course of the measurement epochs, performed over four years, a limited set of natural targets could be tracked, but with decreasing matching success in the progressive project flow (Thuro et al. 2010). As limitation factor of such natural scenes, bright sunlight and refraction effects were identified. The images appear blurred and sharp object boundaries are lost against the meadow in the background. In our case, only structures on the boulders themselves (i.e. mainly lichens/fouling) were detected reproducibly and could be re-measured and observed during the project runtime.
The conclusion of the project is a basic suitability of Image Assisted Total Stations for geo-monitoring using natural targets, provided that the imaging component is further supported by additional information, e.g. coming from laser scans.
Scan-based approach
In a different approach, automatically generated and orientated point clouds are used. Comparable to image features in computer vision; geometric features are used to find correspondences and to detect displacements in this method. The approach is still under development but we want to present first experiences, as we have strong expectations regarding this analyzing strategy.
Using TLS as an acquisition sensor is well suited to the task of geo-monitoring, as it is an area-based measurement system. Comparable data can now be determined by the scanning function of modern total stations. This makes it possible to use of the same analyzing methods with both sensors. One very common method is to detect deformations and changes in multi-temporal point clouds by a simple calculation of Euclidian distances between nearest neighbor points in two epochs. However, this method bears certain disadvantages. In subsequent point cloud epochs, no discrete points are measured. Instead, the object surface is sampled at different positions in ever successive scan. This may lead to apparent deformations in the range up to half of the scan resolution at the object. To avoid this problem, the point-to-point distance calculation is mostly performed only in the local normal direction, with a meshed or reconstructed reference surface being a compulsory requirement. As a consequence, the deformation analyses provide only one-dimensional displacement information which is most sensitive to distance changes in the line of sight. To derive real 3D object movements, expert knowledge for the data interpretation is necessary. Other methods are: using matching algorithms, like Iterative Closest Point (ICP) (Besl and McKay 1992; Chmelina et al. 2012), Least Squares 3D Surface Matching (LS3D) (Gruen and Akca 2005) or Gauss- Helmert LS3D (Ge and Wunderlich 2016) to derive transformation parameters (for sub regions) of the surveillance area.
In our new approach we want to derive deformation parameters from point clouds by using geometric features. Either all points or a preselected subset of “interesting” points are converted into a descriptor. Simplified, this means a numerical vector that intends to (uniquely) encode the individual point characteristics and its local spatial neighborhood. These descriptors, extracted from two point clouds, are matched to find correspondences and possible displacements. This procedure is equivalent to feature matching algorithms in computer vision, e.g. SIFT (Lowe 2004) or SURF (Bay et al. 2006).
In 2D as well as in 3D space, an endless number of features exist. In 3D, mostly the local structure in the spatial neighborhood around a point is described, e.g. the adjacent points inside a sphere with a given radius or a voxel with a defined edge length. This can be done with characteristics of the 3D covariance matrix (3D structure tensor), such as the ratios of the eigenvalues or eigenvectors (Weinmann et al. 2014). Another approach is using the local curvature around the point by a multi-dimensional histogram of values (Flint et al. 2007; Rusu et al. 2008; Scovanner et al. 2007).
Most applications using 3D feature matching are developed in the computer vision and robotics community, in conjunction with (artificial) indoor scenes. To transfer these features to be used in natural scenes with diffuse, random structures, some work is still necessary. We need to develop more unique features which can be reliably found in the point clouds of both epochs. At the moment we are testing multiple feature types, their combinations, and the most suitable neighborhood radius and respective voxel sizes. So far we have been able to reliably segment different types of objects, such as stones from vegetation, as in our Aggenalm scenery (Figure 2). This is used as preliminary step for further processing, which can be concentrated only on selected parts of the data.
In the future, we will integrate radiometric properties into these feature vectors obtained by laser scanners (intensities), cameras (color), or a combination of both, like a scanning IATS as described.
Fused approach based on image and scan data
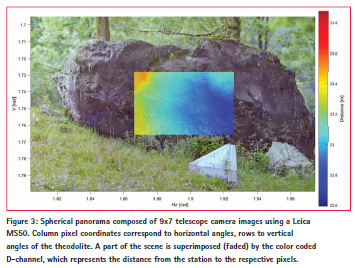
Based on experience of the previous mentioned methods, in particular on the research project “alpEWAS”, we developed an approach to analyze fused image and scan data. The release of a new total station with integrated overview and telescope cameras and the aforementioned scanning ability of up to 1000 points per seconds further supported this idea. In this approach, movements will be uncovered by generating 3D displacement vectors of subsequent epochs using RGB+D images. The measurement device, a single modern total station, acquires images and point clouds of the monitoring area. The single images are projected onto a sphere, whose center point is defined by the instruments station. The angle value of one pixel defines the resolution of the final spherical panorama. If the instrument’s resolution (in our case: 0.61 mgon) is used, the resulting panorama will be generated in full resolution. Smaller values lead to up-sampled panoramas, larger values result in lower resolution panoramas, which speed up the further processing but limit the final accuracy. To compensate vignetting effects, each image is brightened at the border region to generate a smooth blended panorama. A panorama stitching by image processing methods is not necessary, as the high accurate exterior orientation of each single image – determined by the total station – can be used directly. The image coordinates of the spherical panorama correspond directly to theodolite angular values. Needless to say, an appropriate image-theodolite system calibration is necessary for all these steps, e.g. as proposed by Walser (2004), Vogel (2006) or Wasmeier (2009).
In the following step, the scanned 3D points of the total station get projected into the previously generated spherical panorama. For each image pixel the respective obtained distance from the station is converted into a grey or color value, forming a depth image – the D-channel of the RGB panorama image. The projection of the point cloud first results in an irregular grid of 2D points. These points need to be interpolated into a regular grid with the same grid dimensions of one panorama pixel.
Figure 3 shows an RGB+D image taken at the Aggenalm test site. It is a spherical panorama consisting of 9×7 single images which are blended into each other. The x-axis is given in angular values, representing horizontal theodolite angles, the y-axis the respective vertical angle values. Together with the D-channel (partly superimposed in the center of Figure 3) a 3D polar coordinate can be determined for each pixel.
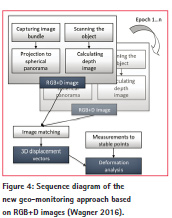
In the proposed monitoring approach, multiple measurement epochs (RGB+D images) are generated in permanent or periodical operation mode. If corresponding points are found in subsequent RGB+D images, 3D displacements can be directly determined. Such correspondences can be found by using any kind of image matching method, such as intensity-based, feature-based, relational or global/dense matchers. All of these methods detect 2D pixel displacements which can be transformed into the 3D space by the D-channel of both RGB+D images. If additional stable control points are measured by standard surveying methods, e.g. points signalized with prisms, a further geodetic deformation analysis can be calculated. Figure 4 summarizes the single processing steps in a sequence diagram.
The main advantage of this approach is the fused analysis of image and scan data. Using RGB+D images combines the advantages of both acquisition methods (imaging and scanning) to detect displacements. In contrast to a pure comparison of point clouds, such as those determined by TLS, object movements perpendicular to the line of sight can be reliably uncovered as additional image information is used. Movements in line of sight, on the other hand, can also be detected. This would not be possible if only a single camera system was used. This method will be the first that makes use of the full potential of modern total stations by utilizing different sensor data in a combined approach. A more detailed description of the approach can be found in (Wagner 2016).
Summary
In this paper we presented three different approaches to use natural targets for geomonitoring. All of these methods have been tested, or are still under development at the Aggenalm landslide. The test site there is used as an outdoor laboratory for various geo-deformation measurement systems and prototypes. The data of all methods presented can be acquired by modern total stations, which combine standard surveying features with image analysis and scanning functions.
So far, only the last mentioned method delivers reliable outcomes. In the first mentioned image-based method, the reliability of the object recognition was too low. With the benefit of hindsight, other image analysis algorithms, like template or feature matching, would have been the better choice. The second approach is a very promising one – even though it does not yet provide the desired results. Different object types can already be segmented from each other, which can be preliminary work for other analysis steps. We are confident that we will be able to track natural objects by analyzing geometric features more reliable in the future. The last presented method: using a fused analysis of image and scan data, can be seen as a continued development of the first approach, while overcoming the disadvantages mentioned. The next logical step is to further incorporate the second (scan-based) approach. We plan to generate feature vectors consisting of scan and image elements and thereby extend/combine both approaches.
References
Bay, H., Tuytelaars, T. and van Gool, L. (2006). SURF: Speeded Up Robust Features: 32. In: Computer Vision – ECCV 2006, pp. 404-17.
Besl, P. J. and McKay, H. D. (1992). A method for registration of 3-D shapes. IEEE Transactions on Pattern Analysis and Machine Intelligence, Vol. 14, No. 2, pp. 239-56.
Chmelina, K., Jansa, J., Hesina, G. and Traxler, C. (2012). A 3-D Laser Scanning System and Scan Data Processing Method for the Monitoring of Tunnel Deformations. Journal of Applied Geodesy, Vol. 6, 3-4, pp. 177-85.
Flint, A., Dick, A. and van den Hengel, A. (2007). Thrift: Local 3D Structure Recognition. In: 9th Biennial Conference of the Australian Pattern Recognition Society on Digital Image Computing Techniques and Applications (DICTA 2007), Glenelg, Australia, 3-5 Dec. 2007, pp. 182-8.
Ge, X. and Wunderlich, T. (2016). Surface-based matching of 3D point clouds with variable coordinates in source and target system. ISPRS Journal of Photogrammetry and Remote Sensing, Vol. 111, pp. 1-12.
Gruen, A. and Akca, D. (2005). Least squares 3D surface and curve matching. ISPRS Journal of Photogrammetry and Remote Sensing, Vol. 59, No. 3, pp. 151-74.
Lowe, D. G. (2004). Distinctive image features from scale-invariant keypoints. International Journal of Computer Vision, Vol. 60, No. 2, pp. 91-110.
Rusu, R. B., Marton, Z. C., Blodow, N. and Beetz, M. (2008). Persistent point feature histograms for 3D point clouds. In: Proceedings of the 10th International Conference on Intelligent Autonomous Systems (IAS-10), Baden- Baden, Germany, pp. 119-28.
Scovanner, P., Ali, S. and Shah, M. (2007). A 3-dimensional sift descriptor and its application to action recognition. In: Proceedings of the 15th ACM International Conference on Multimedia, Augsburg, Germany, pp. 357-60.
Singer, J., Schuhbäck, S., Wasmeier, P., Thuro, K., Heunecke, O., Wunderlich, T., Glabsch, J. and Festl, J. (2009). Monitoring the Aggenalm landslide using economic deformation measurement techniques. Austrian Journal of Earth Sciences (AJES), Vol. 102, No. 2, pp. 20-34.
Thuro, K., Singer, J., Festl, J., Wunderlich, T., Wasmeier, P., Reith, C., Heunecke, O., Glabsch, J. and Schuhbäck, S. (2010). New landslide monitoring techniques – developments and experiences of the alpEWAS project. Journal of Applied Geodesy, Vol. 4, No. 2, pp. 69-90.
Vogel, M. (2006). Vom Pixel zur Richtung. Die räumlichen Beziehungen zwischen Abbildungsstrahlen und Tachymeter-Richtungen. PhD thesis. Technische Universität Darmstadt.
Wagner, A. (2016). A new approach for geo-monitoring using modern total stations and RGB+D images. Measurement, Vol. 82, pp. 64-74.
Wagner, A., Huber, B., Wiedemann, W. and Paar, G. (2014). Long-Range Geo-Monitoring using Image Assisted Total Stations. Journal of Applied Geodesy, Vol. 8, No. 3, pp. 223-34.
Walser, B. (2004). Development and Calibration of an Image Assisted Total Station. PhD thesis. ETH Zürich. Wasmeier, P. (2009). Grundlagen der Deformationsbestimmung mit Messdaten bildgebender Tachymeter. PhD thesis. Technische Universität München.
Weinmann, M., Jutzi, B. and Mallet, C. (2014). Semantic 3D scene interpretation: a framework combining optimal neighborhood size selection with relevant features. ISPRS Annals of the Photogrammetry, Remote Sensing and Spatial Information Sciences, Vol. 3, pp. 181-8.
Wunderlich, T., Wasmeier, P. and Wagner, A. (2014). Auf dem Weg zum geodätischen Universalinstrument – wie nahe am Ziel sind IATS und MS50? In: Terrestrisches Laserscanning 2014 (TLS 2014), Fulda, Germany, 11-12 Dec. 2014, pp. 177-92
The paper was presented at the 3rd Joint International Symposium on Deformation Monitoring (JISDM). Vienna, Austria, March 30 – April 1, 2016.


 (2 votes, average: 3.00 out of 5)


Leave your response!