| Perspective | |
Humorous science: Exploring our physical world
This paper highlights humorous research employing physics and mathematics to analyse and explain intriguing problems encountered in our professional or everyday lives, including examples related to gravity, astronomy and sports. |
 |
|
This is the fifth in a series of papers celebrating some of the weird and wonderful research findings hidden amongst the scientific literature. It aims to ensure that we remember the funnier side of science and provides answers to questions we may have been too afraid to ask. This study was conducted entirely in the author’s spare time and is in no way related to his employer. Here, we explore studies employing physics and mathematics to analyse and explain issues that we may be grappling with in our professional or everyday lives.
Gravity
Despite defying the laws of physics, B. Volfson was granted a US patent in 2005 for inventing a space vehicle propelled by a superconducting shield, which alters the curvature of space-time outside the craft in a way that counteracts gravity. This inspired Cyr and Lanthier (2007) to present a cost-utility analysis of abolishing the law of gravity. Using a hidden Markov model (a statistical model in which the system is assumed to be a Markov process with unknown parameters), they estimated that 2 million quality-adjusted life years would be saved as a consequence and determined the cost-effectiveness of adapting Volfson’s anti-gravity machine for use on Earth. It was argued that a microgravity environment could have important positive impacts, such as stopping climate change by reducing the use of fossil fuel by 90% because cars would no longer be needed with transportation only required for overseas travel. However, they also noted that several negative side effects were ignored, e.g. extended microgravity exposure on the human body and technical problems related to the absence of gravity (including the use of wigs, intravenous fluids and toilets). Nevertheless, the study proved that a combination of technological, statistical and medical jargon can convince intelligent people to read a manuscript (and have a chuckle along the way).
Noting that only a few legged species on Earth manage to run on water, Minetti et al. (2012) conducted experiments with humans running in place on water at simulated reduced gravity. They used a hydrodynamic model to predict the gravity levels required for humans to run on water (about 20% of the Earth’s gravity) and then tested these predictions in the laboratory using a reduced gravity simulator. Progressive body weight unloading of a person running in place on a wading pool confirmed that a person could run on water at lunar (or lower) gravity levels using relatively small rigid fins. 3D motion capture of reflective markers on major joint centres revealed that humans keep the head-trunk segment at a nearly constant height, in spite of the high stride frequency and the intensive locomotor effort required to move their body through space. These results showed that a hydrodynamic model for lizards running on water can also be applied to humans, despite the enormous difference in body size and shape.
Astronomy
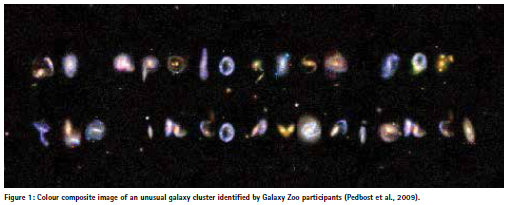
Pedbost et al. (2009) identified a peculiar new class of galaxy cluster using data from the Galaxy Zoo project. It is well known that galaxies are not randomly distributed throughout space but tend to cluster together. However, it was a surprise to find several high-density clusters exhibiting rather unusual characteristics such as the shapes and colours of its component galaxies (blue colours and spirals are unexpected for high-mass clusters), the entire cluster being rather linear and boxlike, and (most surprisingly) individual galaxies and close systems approximating the geometric shapes of letters in the modern Latin alphabet. Although galaxies displaying morphologies corresponding to Latin characters have been noticed before (S and Z being particularly common), a localised collection of this size arranged in sub-groups was highly improbable. In one example, these shapes and subgroups were interpreted as “we apologise for the inconvenience” (Figure 1).
Noting that this may indicate the existence of intelligent extra-terrestrial life, the scale of the message would require a lifeform with extraordinary powers. Two other clusters demonstrated additional features, including punctuation, capital letters, a numeral, an abbreviated unit and left-justified sub-groups, with messages interpreted as “caution! structure formation in progress” and “Delays possible for 7 Gyr”. When considered collectively, these appeared to suggest a common theme reminiscent of road works. This not only implies the existence of other intelligent beings (inconvenienced by said road works) but also may cause concern for Earth potentially having to make way for an intergalactic super-highway.
Armstrong (2012) reported on the nondetection of the Tooth Fairy at optical wavelengths. It appears that the Tooth Fairy obtains a child’s tooth with minimal difficulty and undetected, despite potential barriers such as bolted front doors and bad-tempered dogs. The only observational evidence of the being’s transient presence is the disappearance of the tooth and the small gift left behind in its place. Attempting to finally detect the Tooth Fairy, the MDM Astronomical Observatory’s 1.3-metre McGraw-Hill telescope near Tucson, Arizona, was used for optical observations of the author sleeping about 47 metres away on the roof of the neighbouring observatory, with a freshly removed wisdom tooth under her pillow. The telescope was programmed to obtain an 8-hour time series of a 2-metre radius circle centred on Armstrong’s sleeping bag. At the end of the night, the wisdom tooth could not be located (neither could the pillow, which had tumbled down the sloped roof and come to rest against a tumbleweed).
Standard data processing failed to detect evidence of the Tooth Fairy. However, given the tooth’s disappearance, it was concluded that she indeed paid a visit. Preliminary evidence therefore suggests that the Tooth Fairy is transparent at optical wavelengths. The lack of a gift being left behind was attributed to the creature possibly feeling offended at this deliberate attempt to invade her privacy. Noting the limiting time resolution of 4 seconds for both the exposures and dead time between the observed images, the findings also indicate that the Tooth Fairy may be operating at much faster speed than previously assumed.
Krugman (2010) extended interplanetary trade theory to an interstellar setting, determining how interest rates on goods travelling at close to the speed of light should be computed. Following Einstein’s theory of relativity, this is of course a problem because the time taken in transit appears less to an observer travelling with the goods than to a stationary observer. After explaining the physical background by considering trade between Earth and Trantor, he derived a solution from economic theory and proved “two useless but true theorems” of interstellar trade: (1) When trade takes place between two planets in a common inertial frame, the interest costs on goods in transit should be calculated using time measured by clocks in the common frame and not by clocks in the frames of trading spacecraft, and (2) If sentient beings may hold assets on two planets in the same inertial frame, competition will equalise the interest rates on the two planets. Interestingly, the paper was written in 1978 but not published until 32 years later, proving that persistence does pay off.
Sports
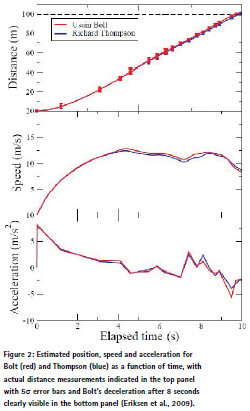
At the Beijing 2008 Olympic Games, Usain Bolt shattered the 100 m world record by finishing in 9.69 seconds to win the gold medal. Most impressively, after accelerating away from the rest of the field, he started celebrating with two seconds (20 metres) to go. This led to an intriguing question: What would the world record have been if Bolt had not slowed down towards the end? Eriksen et al. (2009) provided an answer by measuring Bolt’s position as a function of time using video footage of the run, based on the bolts (pun intended) of a rail-mounted moving camera along the track and fitting a smooth spline to the data (Figure 2).
The resulting motion profile was then extrapolated into the last two seconds of the race, based on two different assumptions. First, it was conservatively assumed that Bolt could have maintained silver medallist Richard Thompson’s acceleration. Second, given his clearly stronger acceleration around 6 seconds, they assumed that Bolt could have kept an acceleration of 0.5 m/s2 higher than Thompson. Consequently, the new world record would have been 9.61 and 9.55 seconds, respectively (both with uncertainties of 0.04 seconds at the 95% confidence level). Maybe to prove this result, Usain Bolt went on to set the still current world record of 9.58 seconds in 2009, which nicely falls into the calculated range and reiterates that he could have already broken the 9.6-second barrier at the Olympics.
Gettelfinger and Cussler (2004) investigated whether humans would swim faster or slower in syrup. To this end, water in a swimming pool was thickened with guar gum to make it about twice as viscous as water, while the density and therefore the buoyancy changes were insignificant. Analysing data collected by 10 competitive and 6 recreational swimmers for different strokes, they determined that swimming in guar does not change swimming speed. Fluid mechanics revealed that the viscosity must increase at least 1,000 times to have an effect. Such an increase would cause a viscositydependent drag coefficient, but the increased drag caused by the frontal area of the body would at least be partially balanced by the increased drag on the hands and forearms.
Applying statistical analysis to international football (soccer) scores and results, McSharry (2007) assessed the effect of altitude on match results and physiological performance of players. Using an extensive database of 1,460 football matches in 10 countries across South America spanning 100 years, it was shown that altitude provides a significant advantage for high-altitude teams who score more and concede fewer goals. Each additional 1,000 m of altitude difference increases the goal difference by about half a goal. The probability of the home team winning for two teams from the same altitude is 0.537, whereas this rises to 0.825 for a home team with an altitude difference of +3,695 m (e.g. Bolivia vs. Brazil) and falls to 0.213 when the altitude difference is -3,695 m (e.g. Brazil vs. Bolivia). However, it was noted that the high level of skill in the lowland national teams (Brazil, Argentina and Uruguay have so far won nine World Cups between them) disguises this advantage somewhat.
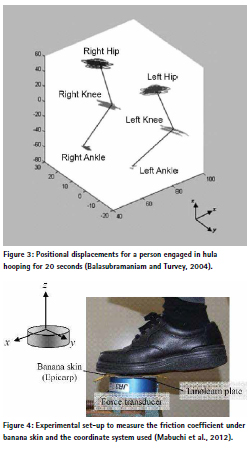
Balasubramaniam and Turvey (2004) studied the coordination modes in the dynamics of hula hooping. This skill is based on the conservation of angular momentum, with the performer exerting small but carefully regulated impulses on a small portion of the interior edge of a short section of the hoop. Based on a series of experiments with seven participants, a systematic analysis of balancing a hoop at the waist was performed under variations in hoop size and oscillation frequency. Movements were recorded using a magnetic motion tracking system, with six tracking receivers placed on the hips, knees and ankles, collecting data at 40 Hz (Figure 3). This revealed that the multiple degrees of freedom of the lower limbs can be reduced to two: one to sustain fore-aft oscillations (largely involving hipankle movements) to maintain the hoop motion and another to organise the vertical suspension of the body (largely involving knee-joint rotations) to counteract the force of gravity.
Everyday phenomena
The randomness of a coin toss was investigated by Clark and Westerberg (2009), using an experiment where 13 participants attempted to flip the coin to achieve a heads result. Based on 300 attempts, all achieved more heads than tails, with 7 participants having significantly more heads results. The highest proportion of heads achieved was 0.68 at the 95% confidence level. This showed that some people can successfully manipulate the coin toss with minimal training, raising concerns about its validity to determine a chance result. Devoted training would probably increase the number of (significantly) successful participants and the magnitude of the manipulation.
In Germany (of course), Leike (2002) demonstrated the exponential decay law using beer froth. A cylindrical beer mug with a diameter of 72 mm was filled immediately after opening the bottle, showing that froth reaches its maximum height within a few seconds and then lasts for several minutes. Experimenting with three types of beers and applying the exponential decay law revealed that the decay constant is dependent on beer type, and the lifetime of the froth can be used to distinguish between different beers. Apart from being essential education for beer drinkers, this study also demonstrated the data analysis techniques commonly applied in science, including consistency checks of theoretical models with observed data, parameter estimation and determination of confidence intervals.
Mulet et al. (1999) discovered that ultrasonic velocity in Cheddar cheese is highly correlated with temperature. The decrease in ultrasonic velocity with increasing temperature reflected thermal transitions of fat within the cheese structure. The most convenient temperature span to determine velocity was found to be 0°C to 17°C, with velocity decreasing by 3.3 m/s per 1°C temperature increase. Velocities measured near 7°C were deemed suitable for studies of structural changes because this is a common curing temperature for cheese. Benedito et al. (2000) went on to determine that the ultrasonic velocity was related to the square root of the deformability modulus and the slope in puncture. The increase of velocity during maturation showed the feasibility of using an ultrasonic device to non-destructively monitor Cheddar cheese maturity, including assessment of its moisture content.
Uncovering the mystery of what makes banana peels so slippery, Mabuchi et al. (2012) determined the frictional coefficient under banana skin using an experiment to simulate a slipping accident. Friction (or slipperiness) under banana skin was measured on a flat panel of common floor material (linoleum) during the sliding motion of a shoe and compared to a banana-free situation. A force transducer detected the applied forces in three dimensions at 100 Hz (Figure 4). They found that the tiny sacs of gooey substance lining the inside of banana skins burst when stepped on, forming a lubricated surface ideal for slipping. Compared to other fruit, banana peels were by far the most slippery. It was also shown that a banana skin is less slippery when the inside of the peel is in contact with the shoe because the irregularity of the shoe sole tends to break the lubricating film. A follow-up paper provided further information and explained the connection between slipping on banana skin and the mysterious world of mucus, based on the similarity of the lubricating function in banana peels and the joints of a rabbit (Mabuchi et al., 2016).
Noting that visual space perception is influenced by bending the body, tilting the neck and raising or lowering the eyes, Higashiyama and Adachi (2006) investigated the perceived size and perceived distance of targets seen from between the legs. Five rectangular targets, varying from 32 to 162 cm in height, were presented at viewing distances between 2.5 and 45 m, and a total of 90 observers verbally judged the perceived size and distance of each target. Firstly, 15 observers inverted their heads to view the targets between their legs, while another 15 observers viewed them while standing normally. This revealed that inverting the head lowered size constancy (the tendency to perceive an object as being the same size regardless of the viewing conditions) and compressed the scale for distance.
Secondly, comparing observers standing upright and seeing the targets through prism goggles that rotated the visual field by 180° with observers viewing the targets through hollow goggles showed that size constancy prevailed and perceived distance was a linear function of physical distance under both goggle conditions. Thirdly, comparing observers wearing the 180° rotation goggles and viewing the targets between their legs with observers viewing them through hollow goggles and lying on their belly lowered the degree of size constancy and compressed the scale for distance. This proved that perceived size and distance are affected by the inversion of the body orientation and not of the retinal image orientation, which was explained by humans learning visual space perception over time mainly with the head and body being upright. Applying path analysis and partial correlation analysis to the entire data, perceived size was found to be independent of perceived distance.
Conclusion
The laws of physics play a crucial role not only in surveying, mapping and geodesy but also in our general understanding of the world in which we work and play. The highlighted studies have provided amusing examples of researchers applying serious science to peculiar problems, often integrating spatial considerations and tools, to reveal how and why things work in a particular way but also to show that science can be a lot of fun. After all, considering the student’s point of view, it is always easier to learn when you are enjoying the experience.
References
Armstrong E. (2012) Nondetection of the Tooth Fairy at optical wavelengths, Journal of Irreproducible Results, 52(3), 22-25.
Balasubramaniam R. and Turvey M.T. (2004) Coordination modes in the multisegmental dynamics of hula hooping, Biological Cybernetics, 90(3), 176-190.
Benedito J., Carcel J.A., Sanjuan N. and Mulet A. (2000) Use of ultrasound to assess Cheddar cheese characteristics, Ultrasonics, 38(1-8), 727-730.
Clark M.P.A. and Westerberg B.D. (2009) How random is the toss of a coin? CMAJ, 181(12), E306-E308.
Cyr C. and Lanthier L. (2007) One giant leap for mankind? A cost-utility analysis of abolishing the law of gravity, CMAJ, 177(12), 1536-1538.
Eriksen H.K., Kristiansen J.R., Langangen O. and Wehus I.K. (2009) How fast could Usain Bolt have run? A dynamical study, American Journal of Physics, 77(3), 224-228.
Gettelfinger B. and Cussler E.L. (2004) Will humans swim faster or slower in syrup? AIChE Journal, 50(11), 2646-2647.
Higashiyama A. and Adachi K. (2006) Perceived size and perceived distance of targets viewed from between the legs: Evidence for proprioceptive theory, Vision Research, 46(23), 3961-3976.
Krugman P. (2010) The theory of interstellar trade, Economic Inquiry, 48(4), 1119-1123.
Leike A. (2002) Demonstration of the exponential decay law using beer froth, European Journal of Physics, 23(1), 21-26.
Mabuchi K., Sakai R., Honna M. and Ujihira M. (2016) Ig Nobel Prize-winning episode: Trip from a slip on a banana peel to the mysterious world of mucus, Biosurface and Biotribology, 2(3), 81-85.
Mabuchi K., Tanaka K., Uchijima D. and Sakai R. (2012) Frictional coefficient under banana skin, Tribology Online, 7(3), 147-151.
McSharry P.E. (2007) Altitude and athletic performance: Statistical analysis using football results, BMJ, 335(7633), 1278-1281.
Minetti A.E., Ivanenko Y.P., Cappellini G., Dominici N. and Lacquaniti F. (2012) Humans running in place on water at simulated reduced gravity, PLoS ONE, 7(7), e37300.
Mulet A., Benedito J., Bon J. and Rossello C. (1999) Ultrasonic velocity in Cheddar cheese as affected by temperature, Journal of Food Science, 64(6), 1038-1041.
Pedbost M.F., Pomalgu T. and the Galaxy Zoo team (2009) Galaxy Zoo: An unusual new class of galaxy cluster, https://arxiv. org/abs/0903.5377 (accessed Dec 2021).


 (2 votes, average: 1.00 out of 5)


Leave your response!