| GIS | |
GIS for predicting environmental pollution
This study predicts and maps the geographic distribution of copper Cu in the soils of northern Lebanon and soil organic carbon SOC across Denmark |
 |
|
Detailed spatial information about environmental pollution/climate change is indispensable for land resources management, environmental decisionmaking and sustainable development. Distribution patterns of soil copper (Cu) content have a large potential to affect plant growth (chlorosis) (Lewis et al., 2001; Kumar Sharma et al., 2008), and are detrimental to animal and human health (acne, allergies, hair loss, anaemia, anorexia, arthritis, autism, migraine headaches, chronic infections, insomnia, neuralgia, sciatica, hypertension, schizophrenia, etc.) (Dauwe et al., 2006; Zheng et al., 2007; Huang et al., 2008). The geographic distribution of soil organic carbon (SOC) affects global climate, and the international efforts for using soils and vegetation as carbon sinks are rapidly increasing (IPCC, 2000). Changes in soil copper content/soil organic carbon distribution are attributed to both natural processes and human activities, the latter being widely recognized in recent years.
Land use changes, including deforestation, biomass burning, use of manure and inorganic fertilizers, waste disposal, enhanced urbanization, industrial contamination, vehicular emissions, etc. are continuously adding to the pool of Cu contaminant in the soils, and are regarded as the main factors causing loss of soil organic carbon (SOC) and the emission of CO2 into the atmosphere. These changes can be significant in several areas, where very dense population is highly concentrated, and/or where intensive artificial drainage activities are carried out. This is particularly true in the case of Lebanon/Denmark; in Lebanon, an important increase of urban and industrial areas during the past 30 years has been noticed; and in Denmark, an important reduction of the total wetland area during the past 200 years as a result of much drainage activity (digging of drainage ditches and introduction of tile drainage) has been observed. As part of international efforts to fight the widespread occurrence of pollution in the coastal areas, it seems necessary to establish inventories of heavy metals for Lebanon. The international efforts are also gathered nowadays to stabilize atmospheric greenhouse gas concentrations, and Denmark (like several other countries) is committed to establish inventories of organic/mineral soil distribution in the frame of the Kyoto protocol.
Estimates of diverse heavy metals (including Cu accumulation) and soil properties (including SOC distribution) have been made in several countries using various modelling tools. Recently, different statistical methods have been used by several scientists to predict heavy metals (including Cu) and SOC, such as linear and non-linear regression (function fitting), logistic regression, artificial neural networks (ANNs), and genetic algorithms (e.g., Moore et al., 1993; Dobos et al., 2000; Gessler et al., 2000; Lin et al., 2002; Scull et al., 2003; Manzoor et al., 2006; Hengl, 2009). These methods are heterogeneous in terms of environmental input parameters, ease of use, sensitivity to parsimony, ease of interpretability, handling of mixed data, handling of non-linear relationships, etc. For instance, decisiontree based models are easy to interpret and discuss when a mix of continuous (e.g., elevation) and nominal (e.g., parent material) environmental parameters are used as predictors (McKenzie and Ryan, 1999; Breiman, 2001). They are scalable to large areas (Breiman, 2001), invariant to monotone re-expressions (transformations) of predictor parameters (Scull et al., 2003), and can optimize non-additive and non-linear relationships between inputs (e.g., environmental independent parameters) and outputs (dependent variables) (Breiman, 2001). In addition, they are non-parametric/probabilistic, and do not require the specification of the form of a function to be fitted to the data, as is necessary for other competing procedures (e.g., non-linear regression) (Breiman, 2001). In contrast to artificial neural networks, once decision-tree models have been built, they can be converted to statements that are implemented easily in most computer languages, without requiring a separate interpreter. Moreover, decisiontrees can indicate the relative weight of each predictor variable in explaining the training data, while bivariate analysis demonstrates only the implication of a couple of predictor variables against the target variable. Decision trees also have excellent prediction capabilities (Breiman, 2001); however they have been criticized for overfitting and poor performance on small datasets (McKenzie and Ryan, 1999).
The decision-tree method is increasingly being used in thematic mapping from remotely sensed data (Huang and Jensen, 1997; Friedl et al., 1999) and habitat modelling in ecology (Michaelsen et al., 1994; Kandrika, 2008). In soil science, the decision-tree method has been used to create a map of soil types based on field investigation from a small reference area (Lagacherie et al., 1995), to improve existing soil and geological maps (Bou Kheir et al., 2008a), to model individual soil properties (Zhou et al., 2003), and to predict soil erosion occurrence (Bou Kheir et al., 2008b). However, the potential of decision-trees to contribute to the field of soil pollution (by heavy metals)/climate change has received little attention. In this context, this study proposes systematic regression/classification tree-models to predict the spatial distribution of soil Cu contents and SOC classes, based on the analysis of environmental parameters likely to impact soil Cu concentrations/ SOC classes and quantification of their weights using Geographic Information Systems (GIS) in northern Lebanon and Denmark. They comprise a set of rules to classify (predict) a dependent target variable [Cu concentration in mg kg-1 or SOC class (organic or mineral)], using the values of independent predictor environmental variables (both natural and anthropic). The predictive Cu/SOC maps resulting from the conversion of the best decision-tree models, at 1:50,000 cartographic scale, serve as inventories useful for land use management and environmental decision-making.
Materials and methods
Soil samples collection and laboratory analysis
A sampling program of surface soil from 200 sites in Lebanon and 1541 in Denmark refl ecting the different land uses was established. The Lebanese sampling was partly done in spring, when snowmelt increases the availability of running water – as a means of mobilizing contaminants. It was completed in summer, when drier conditions allow a higher concentration of the contaminants. The Danish sampling was based on four different existing field surveys to represent the studied area in Denmark.
The field sites in the Lebanese case study were chosen by random stratified sampling method to cover all landscape units that differ by at least one of the following variables: geological substrate, soil type, slope gradient and land cover/use (Bou Kheir et al., 2004). These landscape units were determined by combining the corresponding GIS layers. Additional sites were also sampled, if the covered area of a given landscape unit was important. A sampling density of one sample per km2 was used. Geographic locations of all Lebanese sampling points (200) were determined using a global positioning system (GPS) with 10 m precision. The collected soil samples were then stored in polyethylene bags for transport and storage. These samples were air-dried in an oven at 50 °C for three days and subsequently sieved through a 2.0 mm polyethylene sieve to remove stones, coarse materials and other debris. Soil subsamples (around 20 g) were placed in a mechanical agate grinder and finely ground (5200 mm). The ground soil samples were analyzed for copper using an aqua-regia digestion method. Approximately 0.5 g of the soil samples was weighed and placed in pre-cleaned Pyrex test tubes. Concentrated nitric acid (8 ml) and 3 ml of concentrated perchloric acid were added. The mixtures were heated in an aluminum block at 200 ºC for 3 hours, until they were completely dry. After the test tubes were cooled, 10.0 ml of 5% HNO3 was added and heated at 70 °C for an hour with occasional mixing. Upon cooling, the mixtures were decanted into polyethylene tubes and centrifuged at 3500 rpm for 10 min. Copper concentrations of the solutions were measured using inductively coupled plasma-atomic emission spectrometry (ICP-AES; Perkin-Elmer 3300 DV).
The collected Danish samples (around 25 bulk samples at each site) in two of the existing surveys [Danish Soil Classification (1975) and the Danish Profile Investigation (1990)] were taken within a radius of 50 m from a depth of 0–30 cm (plough layer). These samples were air-dried at room temperature and passed through a 2 mm soil sieve. Concentrations of soil organic carbon (SOC) were determined by the combustion method in a LECO induction furnace, converted to % Soil Organic Matter (SOM) using a factor of 1.72. The other two surveys (ochre classification and well database performed in 1985) gave categorical information on parent material (e.g. peat, sand, silt and clay). This parent material information was reclassified into organic and mineral soils. In order to increase the number of samples used in the modeling process, the continuous soil organic matter (SOM) obtained in the former surveys was converted to a categorical variable (organic/mineral soil occurence) using 10% SOM as a cut off value (commonly used in Denmark). With less than 10% SOM, soils are classified as mineral; and with more than 10% SOM, soils are considered organic.
Collection of predictor environmental parameters explaining Cu/SOC accumulation
Soil Cu/SOC accumulation depends on local site-specific conditions (e.g., parent material, soil properties, etc.) as well as on the type of land use and land management (De Temmerman et al., 2003; Remon et al., 2005). For this reason, in the Lebanese regression-tree analysis, fifteen environmental parameters were selected as independent variables, whereas the values of Cu pollution were dependent variables. While in the Danish classificationtree analysis, thirteen environmental parameters were considered as predictors and the classes of SOC (mineral/organic) were regarded as the target variable.
The generated parameters in the Lebanese case study, i.e. parent material, soil type, pH, hydraulic conductivity, organic matter, stoniness ratio, soil depth, slope gradient, slope aspect, slope curvature, distance to drainage line, land cover/use, proximity to roads, nearness to cities, and surroundings to waste areas were extracted from satellite imageries, digital elevation models (DEMs), ancillary maps and/ or field observations. These parameters were chosen according to our field observations, and most of them were used to build predictive models of Cu variation in similar (prevailing in Mediterranean environments) or dissimilar environmental conditions (Facchinelli et al., 2001; Zhang et al., 2011). Parent material and soil type were extracted from scanned and registered geological/soil maps of Lebanon (Dubertret, 1945; Gèze, 1956). Soil pH, hydraulic conductivity and organic matter content were analyzed, respectively, by soil suspension in water and chlorhydric acid (ratio 1:2), double rink, and oxidation with potassium chlodide (K2Cr2O7). Soil depth was measured through a sounding by an auger at each site. Stoniness ratio (which is the relative proportion of stones on the soil surface) was determined by visual observations with five classes: < 5%, 5–35%, 35–65%, 65–95%, and > 95%. A digital elevation model (DEM) was generated for the Lebanese area from topographic sheet maps at a scale of 1:20,000 with elevation contour intervals of 10 m (DGA, 1963). The established Triangular Irregular Network (TIN) was then converted to a grid of 25-m pixel resolution. This resolution was chosen to match the planimetric and altimetric accuracies. Four terrain attributes were then derived from the constructed DEM using specific ArcView software algorithms: slope gradient (angle), slope aspect, slope curvature, and drainage networks. The infl uence of drainage was given to the buffer zone up to a distance of 50 m from the closest drainage line (Saha et al., 2002). Thus, five classes were determined in the Lebanese study area, ranging from less than 50 m and more than 200 m. The land cover/use parameter was estimated through visual interpretation of high resolution IKONOS imageries (1 m) acquired in October 2008. Fifty-eight land cover/use classes were plotted according to CORINE/ENICOR (Coordination des Informations sur l’ENvironnement/ENV. IN.COR.) Land Cover methodology (level 4), belonging to five major categories: (1) natural vegetation cover, (2) agricultural lands, (3) bare lands, (4) water bodies, and (5) human practices. The class of human practices is refl ected by discontinuous and continuous urban and industrial areas and road networks (with vehiclerelated activities). For that, a buffer zone of 50 m around cities/boundaries and roads was selected, and five classes were distinguished for each (i.e., nearness to cities and proximity to roads) ranging from less than 50 m to more than 200 m from the road. The concentration of copper may also result from burning of waste in the environment. The infl uence of waste areas on Cu accumulation can reach several meters to several kilometers from the point source depending on the industry involved, and it is not easy to determine the distance affected. Here, 50 m, 100 m, 150 m, 200 m, and more than 200 m were selected as the buffer distance around the waste areas.
While in the Danish case study, nine primary (elevation, slope angle, slope aspect, plan curvature, profile curvature, tangent curvature, fl ow direction, fl ow accumulation, and specific catchment area) and one secondary (steady-state topographic wetness index) topographic parameters were generated from Digital Elevation Models (DEMs) acquired using airborne LIDAR (Light Detection and Ranging) systems. The latter seem effective and reliable means of terrain data collection in relatively large areas with cloudy weather conditions (Baltsavias, 1999; Brian et al., 2007; Schmitt et al., 2007; Liu, 2008). The established triangular irregular network (TIN) was converted using a TOPOGRID algorithm to an ArcGIS grid of 1.6-m pixel resolution. This resolution was chosen to match the planimetric and altimetric accuracies of LIDAR systems. In order to increase the efficiency in terms of storage and manipulation, and to acquire homogeneity and standardization with used ancillary maps, the constructed highresolution DEM was coarsened in this study to 25-m resolution. The produced elevation surface (DEM) would still contain several spurious elements, usually classified either as sinks or peaks (one or two cells below or above the local surface). The errors vary between 0.1 m and 4.7 m in a typical 25 m DEM (Tarboton et al., 1991). Although many authors agree that sinks and peaks may actually represent the true nature of topography (Chorowicz et al., 1992), they may act as local barriers that trap water fl ow and cause a major problem for drainage network extraction. To avoid this problem and before performing any hydrologic analysis, sinks in the DEM were identified and eliminated using TerraStream software (Danner et al., 2007). The topographic predictor parameters were used along with existing digital data collected from other sources (soil type, geological substrate and landscape type) to explain organic/mineral field measurements in hydromorphic landscapes of the chosen Danish area.
Decision-tree analysis of Cu/SOC distribution
The field survey data were split into two files, one compiling 80% of the field samples (160 Lebanese sites and 1233 Danish sites) used in the modelling process, and another one comprising 20% used in the validation phase (40 Lebanese sites and 308 Danish sites). All mentioned predictor environmental parameters were overlaid with the field samples point-theme-layer. This overlaying has permitted defining for each of the field samples the related parametric classes, that the field samples lie spatially into.
Different sets of un-pruned Lebanese regression-tree models (214) and Danish classification tree-models (186) were explored on the collected field data. In the Lebanese case, the trees were constructed using all of the environmental parameters, (ii) all soil parameters only, and (iii) selected pairs of parameters. While in the Danish case, the trees were developed using (i) all of the environmental parameters, (ii) the primary morphological/ hydrological parameters, (iii) selected pairs of parameters, and (iv) excluding each parameter at one time from the potential pool of predictor parameters.
Once the trees have been developed, they encode a set of decision rules that define the range of conditions (values of environmental parameters) best used to predict each Cu value/SOC class. The process is recursive, growing from the root node (complete data set) to the terminal nodes in a dentritic fashion (Friedl et al., 1997). The trees created are usually very large with multiple terminal nodes, meaning that the models are intimately fitted on the training data (Lagacherie et al., 1995). Each terminal node is assigned the label of the majority class (Bou Kheir et al., 2010). Splits or rules, defining how to partition the data, are selected based on information statistics that measure, how well the split decreases impurity (heterogeneity or variance) within the resulting subsets (Breiman, 2001). The number of splits to be evaluated is equal to 2(k-1) -1, where k is the number of categorical classes of predictor parameters (Loh and Shih, 1997). We considered differences in the value of a continuous variable up to 1% of the whole range, which is equivalent to ten thousand classes (Loh and Shih, 1997).
The algorithm used for evaluating the quality of the constructed trees is the Gini splitting method, which is considered as the default method (Breiman, 2001). The Gini coefficient is used to measure the degree of inequality of a variable in terms of frequency distribution. It ranges between 0 (perfect equality) and 1 (perfect inequality). The Gini mean difference (GMD) is defined as the mean of the difference between each observation and every other observation (Breiman, 2001) (Eq. 1):
![]()
where X is cumulative percentage (or fractions) and their respective values ( j and k) and N is the number of elements (observations).
Pruning the constructed trees is necessary to prevent the models from being overfit to the sample data, and to reduce tree complexity. We used cost-complexity pruning with an independent data set (a pruning data set) to produce a plot of training error rate versus tree size (Safavian and Norvig, 1991). The cost complexity pruning method guarantees to find the best (with respect to misclassification cost) pruned tree of a specific size (number of terminal nodes) of an initial un-pruned decision tree (Breiman, 2001; Bui et al., 2006).
Construction and validation of the Cu concentrations/SOC maps
Using the preferred Lebanese regressiontree model (having the highest predictive power, and the lowest number of terminal nodes and predictor parameters as well) and the favored Danish classificationtree, predictive maps of Cu concentrations and organic/inorganic landscapes were produced under a GIS environment through the application of the prediction tree rules. These maps were validated (using MSEs, error matrices, etc.) based on field surveys using the independent datasets.
Results and discussion
Tree-model evaluation
The Lebanese regression tree-model based on soil pH and surrounding the waste areas showed the highest predictive power, classifying 77% of the data correctly, and pruned to twelve terminal nodes. This model is easy to understand and fast to use for making predictions (given the fact that the surrounding of waste areas can be easily and quickly constructed whenever satellite imageries are available, which is the case in most countries).
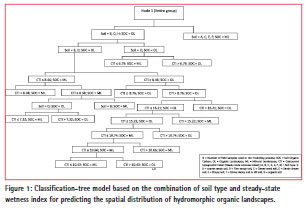
The Danish classification-tree model (Fig. 1) based on soil type and steadystate topographic wetness index (CTI) showed the highest predictive power, classifying 68% of the data correctly and pruned to fourteen terminal nodes. The CTI proved to have a significant contribution to the estimation of hydromorphic organic landscapes since it is a predictor of zones of soil saturation, and organic carbon often accumulates in lowland (concave) soils for two reasons: (1) on steep slopes, dry soil conditions prevail due to more rapid removal of water causing an important decrease in soil organic carbon, and (2) concave slopes can concentrate more water and sediments indicating the potential accumulation of a large quantity of soil organic carbon (SOC).
Map production and validation
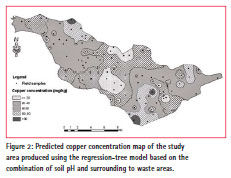
The predictive concentration map of copper (Fig. 2), at a 1:50,000 cartographic scale, was produced using the results of the preferred regression-tree model (based on soil pH and surrounding to waste areas). In this map, class 3 (with a Cu concentration ranging between 40 and 60 mg kg-1) covers the largest area (44%) being dispersed in the studied region. This indicates a widespread higher risk of contamination, if no remedial measures are applied. Classes 4 (high contamination) and 5 (very high contamination) occur in 15% of the area, but they have a far larger impact, since they are distributed as patches in densely populated areas. The predicted Cu values were verified against test data, and the mean squared error was low (being equal to 0.28). The overall accuracy of the predictive quantitative copper (Cu) map produced using this tree-model (at 1:50,000 scale) was estimated to be ca. 80%.
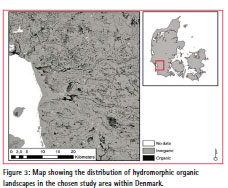
The produced predictive map of organic/ inorganic landscapes (Fig. 3) at 1:50,000 cartographic scale using the classification tree-model based on the combination of soil type and steady-state wetness index, indicates that 7.5% of the wetlands in the Danish study area correspond to organic landscapes, and 92.5% to mineral (inorganic) landscapes. The confusion matrix between the measured organic/ mineral soil occurence’ classes and the modelled ones indicates a good overall accuracy of ca. 75%. This accuracy value is different from the explained variance of the preferred classification-tree model (68%), since it is dedicated to validate all adopted approaches combining the integration of soil survey collection, geomorphometrical analysis and decision-tree modeling.
Advantages of the constructed Cu/SOC decision-tree models
Many aspects of GIS decision-trees make them appealing models to use in predictive environmental pollution/climate change mapping. It is clear that the built trees performed significantly the prediction of Cu concentrations/SOC classes, and supplied some additional advantages like the speed and objectivity of the results. These Cu/SOC decision-trees are useful for integrating and determining the exact weights of a wide variety of predictor environmental parameters (both nominal and continuous). They can be extrapolated to other areas and countries (like Saudi Arabia) if the functional capacities of GIS are used, because they allow the integration of several parametric maps (e.g., parent material, soil type, slope gradient, etc.) for producing a landscape unit map, on which Cu/SOC measurements can be determined.
The preferred regression-tree model (with the highest predictive capacity – 77% and the lowest number of terminal nodes) has defined a map of copper concentration with five classes for a region situated in the northern part of Lebanon (195 km2). Such a map is unavailable in Lebanon, as well as in many other countries. It represents the result of modelling from environmental characteristics, and can meet the scientific needs of researchers and decision-makers for exploring land management scenarios. The concept of regression-tree modelling can also be tested for other heavy metals (e.g., lead, cadmium, nickel, etc.), if their concentrations in mg kg-1 are measured. Because the availability of digital environmental parameters to serve as predictor variables in predictive heavy metals models (including copper) will vary from one location to another, the flexibility of regression-trees is very attractive.
Limitations of the proposed Cu/ SOC decision-tree models
The proposed decision-tree methodology can only be used in situations, where environmental parametric maps and field/ laboratory measurements of heavy metals/ SOC values exist, and the resulting predictions will only have significance in areas composed of similar landscape. The analysis of the explained variance for the built decision tree-models suggests their possible improvement using enhanced scale/ resolution of environmental parameters, or other parameters yielding a finer detail and subtle relationships in Cu/SOC distribution and accumulation such as soil structure, soil compactness, soil permeability, slope length, etc. The use of more advanced topographic DEM indices such as the quasidynamic wetness index, stream power index or others as extracted from remote sensing data (e.g., Normalized Difference Wetness Index, Soil-Adjusted Vegetation Index, etc.) may contribute to explaining also additional variance of the built Cu/SOC decision-trees.
Although the chosen scale (1:50,000) seems to be sufficient for estimating the Cu concentrations/SOC classes to consider strategies for land protection, the produced predictive maps can be improved for more localized contamination /climate change assessment, if more detailed datasets are available, including higher resolution satellite imageries and DEMs, as well as more detailed parameter layers, that serve for producing the landscape unit map among which field measurements were conducted. The fact that some of the investigated environmental parameters appear critical in tree-model formation for this dataset can be advantage in decision-tree analysis. Some authors have criticized the tendency of decision-tree models to produce stepped prediction surface (Gessler et al., 1995). Such a situation can result from mixing predictor variables with different scales and/or data types, or can be the result of individual variable splitting rules defined by the model. Mixing different environmental parameters can result in decreasing or increasing the error rates, and for this reason 214 regression-trees and 186 classification-trees were constructed in this study to derive the critical Cu/SOCinfl uencing parameters in the overall treemodelling (in terms of predictability), that have to be included in the regression/ classification-tree analysis for predicting Cu concentrations/SOC classes.
Conclusions
The constructed regression/classificationtree models enabled, for the first time, mapping of predicted Cu concentrations/ SOC classes in Lebanon and Denmark at a scale of 1:50,000, based on environmental characteristics (e.g., parent material, soil type, slope gradient, land cover/ use, etc.). The decision-tree analysis also provides insight into the environmental parameters that are most responsible for driving Cu/SOC content in soils. In our study, soil pH and surrounding the waste areas were the main parameters associated with high accumulation of soil Cu. Soil type and steady-state topographic wetness index – proved to be the most important variables for predicting SOC (indicator of climate change), indicating that complex or secondary topographic variables show stronger relationships to organic/mineral soil occurrence than primary topographic attributes.
Applying the preferred decision-tree models (with the high predictive capacity and lowest number of nodes) is relatively simple and practical, and may be used in other countries. It is certainly of significant interest to local governments and municipalities. It will serve several development projects concerned with improving the environmental conditions, and the quality of living. Its immediate benefit would be for decision-makers and planning managers, as it does not require a lot of effort while investigating land degradation, especially environmental deterioration and community vulnerability.
Continuing analysis of this environmental database will consist of comparing decision-tree modelling approach with other sophisticated techniques (e.g., fuzzy logic, artificial neural networks, stepwise regression, trend surface analysis, regularized smooth spline, etc.) for explaining the heavy metals’/SOC’ spatial variation. Future work will also seek to gather additional environmental data, so we can examine whether or not other environmental parameters (with finer scales/resolutions) can predict the distribution of Cu concentrations/SOC classes with greater precision and reliability. This is an area rich with implications for possible future research involving prevention, protection and mitigation of contaminated areas by heavy metals.
References
Baltsavias, E.P., 1999. A comparison between photogrammetry and laser scanning, PRS, 54(2–3), 83–94.
Breiman, L., 2001. Decision-tree forests. Machine Learning, 45(1), 5–32.
Bou Kheir, R., Girard, M.-C., Khawlie, M., 2004. Use of a structural classification OASIS for the mapping of landscape units in a representative region of Lebanon. Canadian Journal of Remote Sensing, 30(4), 617–630 (in French).
Bou Kheir, R., Chorowicz, J., Abdallah, C., Dhont, D., 2008a. Soil and bedrocks distribution estimated from gully form and frequency: a GIS-based decision-tree model for Lebanon. Geomorphology, 93, 482–492.
Bou Kheir, R., Abdallah, C., Runnstrom, M., Martensson, U., 2008b. Designing erosion management plans in Lebanon using remote sensing, GIS and decision-tree modeling. Landscape and urban planning, 88, 54-63.
Bou Kheir, R., Bøcher, P.K., Greve, M.B., Greve, M.H., 2010. The application of GIS based decisiontree models for generating the spatial distribution of hydromorphic organic landscapes in relation to digital terrain data. Hydrology and Earth System Sciences, 14(6), 847-857.
Brian, E., Roth, K., Clint Slatton, M., Cohen, J., 2007. On the potential for high-resolution lidar to improve rainfall interception estimates in forest ecosystems. Front Ecological Environment, 5(8), 421–428.
Bui, T.H., Zwieu, J., Poel, M., Nijholt, A., 2006. Toward affective dialogue modeling using partially observable markov decision processes, Proceedings of workshop emotion and computing, 29th Annual German Conference on Artificial Intelligence, edited by: Reichardt, D., Levi, P., and Meyer, J. C., Bremen, Germany, 47–50, June 2006.
Chorowicz, J., Ichoku, C., Riazanoff, S., Kim, Y.J., Cervelle, B., 1992. A combined algorithm for automated drainage network extraction. Water Resources, 28(5), 1293–1302.
Danner, A., Yi, K., Mølhave, Th., Agarwal, P.K., Arge, L., Mitasova, H., 2007. TerraStream: from elevation data to watershed hierarchies. Proceedings of the 15th International Symposium on Advances in Geographic Information Systems (ACM GIS).
DGA, 1963. Topographic maps at a scale 1:20.000. Direction of Geographic Affairs, Republic of Lebanon.
De Temmerman, L., Vanongeval, L.B., Hoenig, M., 2003. Heavy metal content of arable soil in Northern Belgium. Water, Air and Soil Pollution, 148, 61-76.
Dauwe, T., Janssens, E., Eens, M., 2006. Effects of heavy metal exposure on the condition and health of adult great tits (Parus major). Environmental Pollution, 140(1), 71-78.
Dobos, E., Micheli, E., Baumgardner, M. F., Biechl, L., Helt, T., 2000. Use of combined digital elevation model and satellite radiometric data for regional soil mapping. Geoderma, 97, 367-391.
Dubertret, L., 1945. Geological Maps of Lebanon at 1:50.000 Scale. Ministry of Public Affairs, Republic of Lebanon.
Friedl, M.A., Brodley, C.E., 1997. Decisiontree classification of land cover from remotely sensed data. Remote Sensing of the Environment, 61, 399–409.
Friedl, M.A., Brodley, C.E., Strahler, A.H., 1999. Maximizing land cover classification accuracies produced by decision trees at continental to global scales. IEEE Geosciences Remote, 37, 969–977.
Facchinelli, A., Sacchi, E., Mallen, L., 2001. Multivariate statistical and GISbased approach to identify heavy metal sources in soils. Environmental Pollution, 114, 313–324.
Gèze, B., 1956. Soil map of Lebanon at a scale of 1:200.000, Explicative Note. Republic of Lebanon. Ministry of Agriculture, Beirut, Lebanon. Gessler, P.E., Moore, I.D., McKenzie, N.J., Ryan, P.J., 1995. Soil landscape modeling and spatial prediction of soil attributes. International Journal of Geographic Information Systems, 9, 421-432.
Gessler, P.E., Chadwick, O.A., Chamran, F., Althouse, L.D., Holmes, K.W., 2000. Modelling soil-landscape and ecosystem properties using terrain attributes. Soil Science Society of American Journal, 64, 2046–2056.
Hengl, T., 2009. A practical guide to geostatistical mapping. 2nd Edt., University of Amsterdam, 291p, http:// spatial-analyst.net/book/GstatIntro. Huang, X., Jensen, J.R., 1997. A machine-learning approach to automated knowledge-base building for remote sensing image analysis with GIS data. Photog. Eng. & Remot. Sens., 63, 1185-1194.
Huang, M., Zhou, S., Sun, B., Zhao, Q., 2008. Heavy metals in wheat grain: assessment of potential health risk for inhabitants in Kunshan, China. Science of the Total Environment, 405(1-3), 54-61.
IPCC, 2000. Land-use, land-use change, and forestry, in: Land-use, landuse change, and forestry, edited by: Watson, R. T., Noble, I. R., Bolin, B., Ravindranath, N. H., Verardo, D. J., and Dokken, D. J., A special report to the Intergovernmental Panel on Climate Change (IPCC), Cambridge University Press, Cambridge, UK, 1–51. Kandrika, S., 2008.
Land use/land cover classification of Orissa using multitemporal IRS-P6 awifs data: a decision tree approach. International Journal of Applied Earth Observation and Geoinformation, 10(2), 186-193. Kumar Sharma, S., Madhoolika, A., Fiona, M., 2008. Heavy metal (Cu, Zn, Cd and Pb) contamination of vegetables in urban India: A case study in Varanasi. Environmental Pollution, 154 (2), 254-263.
Lagacherie, P., Legros, J.P., Burrough, P.A., 1995. A soil survey procedure using the knowledge of soil pattern established on a previously mapped reference area. Geoderma, 65, 283–301.
Lewis, S., Donkin, M.E., Depledge, M.H., 2001. Hsp70 expression in Enteromorpha intestinalis (Chlorophyta) exposed to environmental stressors. Aquatic Toxicology, 51, 277-291.
Lin, Y.P., Teng, T.P., Chang, T.K., 2002. Multivariate analysis of soil heavy metal pollution and landscape pattern in Changhua County in Taiwan. Landscape and Urban Planning, 62, 19–35.
Liu, X., 2008. Airborne LiDAR for DEM generation: some critical issues. Progress of Physical Geography, 32(1), 31–49. Loh, W.Y., Shih, Y.S., 1997.
Split selection methods for classification trees. Stat Sinica, 7, 815–840. Manzoor, S., Munir, H.S., Shaheen, N., Khalique, A., Jaffar, M., 2006. Multivariate analysis of trace metals in textile effl uents in relation to soil and groundwater. Journal of Hazardous Materials, A137, 31–37.
McKenzie, N.J., Ryan, P.J., 1999. Spatial prediction of soil properties using environmental correlation. Geoderma, 89, 67–94.
Michaelsen, J., Schimel, D.S., Friedl, M.A., Davis, F.W., Dubayah, R.C., 1994. Regression-tree analysis of satellite and terrain data to guide vegetation sampling and surveys. Journal of Vegetation Science, 5, 673–686.
Moore, I.D., Gessler, P.E., Nielsen, G.A., Peterson, G.A., 1993. Soil attribute prediction using terrain analysis. Soil Science Society of America Journal, 57, 443–452.
Remon, E., Bouchardon, J.L., Cornier, B., Guy, B., Leclerc, J.C., Faure, O., 2005. Soil characteristics, heavy metal availability and vegetation recovery at a former metallurgical landfill: Implications in risk assessment and site restoration. Environmental Pollut.ion, 137(2), 316-323.
Safavian, S.J., Norvig, P., 1991. A survey of tree classifier methodology. IEEE T. Syst. Man. Ct. A, 21, 660–674.
Saha, A.K., Gupta, R.P., Arora, M.K., 2002. GIS-based landslide hazard zonation in the Bhagirathi (Ganga) valley, Himalayas. International Journal of Remote Sensing, 23(2), 357–369.
Scull, P., Franklin, J., Chadwick, O.A., 2005. The application of classification tree analysis to soil type prediction in a desert landscape. Ecological Modeling, 181, 1–15. Schmitt, N.P., Rehm, W.F., Pistner, T., Zeller, P., Diehl, H., Nave, P., 2007. The AWIATOR airborne LIDAR turbulence sensor. Aerospace Sci. Technol., 11(7–8), 546–552.
Tarboton, D.G., Bras, R.L., Rodriguez- Iturbe, I., 1991. On the extraction of channel networks from digital elevation data. Hydrological Processes, 5, 81–100. Zheng, N., Wang, Q., Zhang, X., Zheng, D., Zhang, Z., Zhang, S., 2007, Population health risk due to dietary intake of heavy metals in the industrial area of Huludao City, China. Science of the Total Environment, 15(1-3), 96-104.
Zhang, H.H., Chen, J.J., Zhu, L., Li, F.B., Wu, Z.F., Yu, W.M., Liu, J.M., 2011. Spatial patterns and variation of soil cadmium in Guangdong Province, China. J. Geochem. Explor., 109, 86-91.
Zhou, Z.Y., Xu, H.W., Wang, M.J., 2003. Soil organic matter mapping based on classification-tree modeling. Acta Pedo. Sin., 40, 801-808.
The paper was presented at 9th National GIS Symposiun in Saudi Arabia at Damman during April 28-30, 2014.


 (8 votes, average: 1.50 out of 5)


Leave your response!