| Policy | |
Geo-information tools, governance, and wicked policy problems
An alternative view of geo-information tools as problem recognizers, as problem analysts and advocates, as mediators, and as problem solvers is more appropriate |
 |
|
 |
|
What you see depends on where you stand
The emblematic intergovernmental Group of Earth Observations (GEO) sees food, water and energy security, natural hazards, pandemics of infectious diseases, sustainability of key services, poverty, and climate change as societal challenges [1]. In response, GEO is developing an infrastructure of earth observing systems, hardware, and software tools to connect the demand for geo-information with the supply of vast data about the Earth. At the same time, think tanks like the Overseas Development Institute (ODI) observe the complexity and unpredictability of global economic, social, and political developments and develop guidelines to plan and strategize against the odds [2]. We regard the abovementioned societal challenges as wicked policy problems [3]—involving multiple or unknown causes, anticipated and unanticipated effects, and high levels of disagreement among governance stakeholders concerning the nature (and even the existence) of a problem and the appropriateness of solutions. In this Special Issue, we attempt to take the pulse of how we, as geo-information scientists, tackle wicked problems in the global North and South.
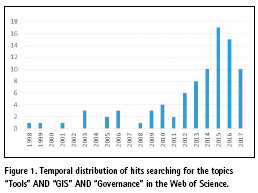
To get a sense of the number of published articles on the key themes of the Special Issue, we searched the Web of Science for “Tools” AND “GIS” AND “Governance”. Figure 1 shows the distribution of the 87 hits. Searching for Methods or Concepts, instead of Tools, brings about 62 and 23 hits, respectively, with a similar distribution. The upward trend in the number of articles in the last few years testifies to a growing interest in the problem and suggests an emergent integration of the “technical” and “social” research clusters in GIScience, which were operating in isolation in the past [4].
In the past, “technical” research referred to geo-information technology (geo-IT) as revolutionary. Geo-IT would make it easy to identify who owns geo-information, whether it is fit for the purpose at hand, and who can access and integrate it with other information and how. Researchers argued that accessible and integrated data lead to cost savings in the short term, improved service delivery, and more effective policymaking in the medium term, as well as macroeconomic benefits, such as greater competitiveness and innovation, job creation, new firms, and increased Gross Domestic Product (GDP) and tax returns— in other words, better governance—in the long term. The perceived challenge was for independent, verifiable, and repeatable research to provide hard (as opposed to anecdotal) evidence of the positive short-, medium-, and longterm macroeconomic impacts of geo-IT and spatial data infrastructures (SDI). The “social” research sensitized us to contextual issues of importance to geo-IT and SDI implementation, e.g., the need for sustained political support, for legislative backing, for building and maintaining trust, for a level playing field and clear rules, and the need for involving the private sector to help define rules and spot opportunities. The perceived challenge was how to improve institutional arrangements and human capacity so that global innovations in geo-information technology could disappear into the woodwork and become “infrastructure” in specific social contexts. However, prescribing the ideal context of geo-IT implementation only helped to point out “where to go” but not “what actually happens” on the way to the destination [5].
During the same time, public administration scholars were warning against unidirectional causal relations between IT and public administration and spoke about “implications” instead of causal consequences [6]. They argued that autonomous political, legal, economic, and professional developments in and around public administration, and changes in ideas and ideals, are as important to the effects of IT applications on public administration as the technological developments themselves. Moreover, empirical studies in the public sector were indicating that the capacities to collect, store, aggregate, analyze, and present digital data rationalized policy-making processes, but also impinged on their democratic quality. As for the role of information in public policy-making, Van de Donk and Snellen [6] suggested that ideology and interests have always had higher emotional loadings than information for public policy actors:
“The real world of information processing in the domain of public policy making [is] characterised by several types of information (manipulated statistics, high quality research, gossip, editorial comments, evaluation reports, corridor analysis); information pathologies (faulty receptors, failures in communication, information overload, systematic biases) and information politics (manipulation, non-registration, withholding, biased presentation, adding other information, timing, leaking and so on). When looking with an information processing perspective on policy making, it is not surprising at all that one comes up with such a metaphor as a “garbage can”” (p. 391).
This view may be too pessimistic. If we consider policy-making as a series of steps in a policy cycle [7] it is clear that geoinformation tools have played significant roles in some of the policy cycle steps, e.g., in problem recognition, policy monitoring, and policy enforcement [8]. For instance, space imagery influenced problem recognition and agenda setting for the environment. In An Inconvenient Truth, Al Gore describes how a single image of the earth from space, taken 50 years ago by a crewmember of the Apollo 8 mission, “exploded into the consciousness of mankind. In fact, within two years of this picture being taken, the modern environmental movement was born. The Clean Air Act, the Clean Water Act, the Natural Environmental Policy Act, and the first Earth Day all came about within a few years of this picture being seen for the first time.” Geographic Information Systems (GIS) and Remote Sensing (RS) contribute to policy monitoring, when strategic actors do not shy away from political confrontation, as, for example, the monitoring of deforestation policy in the Brazilian Amazon has shown [9]. Courts of law use remote sensing as evidence in policy enforcement when crimes take place over longer periods of time, when legal disputes relate to objects identifiable from space, when data interpretation by nontechnical experts is possible, and when data authenticity and reliability are certain [10].
Political scientists point out that only when the problem is well structured or tame can policy be considered the product of an orderly sequence of steps in a policy cycle (see, e.g., Stone [11]; Sabatier [12]). However, when the problem is moderately structured or wicked, looking at policymaking as steps in a policy cycle and at geo-information tools as collectors, processors, and disseminators of data is not productive. In this case, we need a different conceptual framework for policymaking and for geo-information tools.
Where do we stand?
Defining a vague term like governance is like trying to nail a pudding to the wall [13]. Yet, vagueness may be the source of the term’s popularity, so much so that Pollitt and Hupe [14] refer to governance as a “magic concept”. Because magic concepts have a large breadth of scope, they give rise to multiple, overlapping, sometimes conflicting definitions. However, definitions can only fulfil explanatory functions if specified systematically for specific purposes [14]. Definitions of governance can be normative or descriptive.
On the normative side, the most popular is “good governance”, a notion that generated such a large catalogue of virtuous characteristics over time that its identity is uncertain. Thus, two decades ago, the foremost attributes for good governance were effectiveness, accountability, transparency, and the rule of law. Currently, the list of recommended qualities of good governance includes “equity, participation, inclusiveness, democracy, widespread service delivery, sound regulation, decentralization, an open trade regime, respect for human rights, gender and racial equality, a good investment climate, sustainable energy use, citizen security, job creation, and a variety of other ends” (p. 17, [15]). Specifying governance as “good governance” serves as a potent myth, a shared frame of reference that enables individuals and organizations to deal with contradictions in everyday life that can never be fully resolved [16]. As such, myths are neither true nor false, but either living or dead [17]. What is of interest is what myths represent, and how myths may or may not contribute to established bases of meaning and experience. Instead of “good governance”, Merilee Grindle has been advocating for two decades for “good enough governance” as a platform for critically questioning the long menu of institutional changes and capacitybuilding initiatives deemed important or essential [18,19]. In a recent article, titled Good Governance, R.I.P., she finally declared “good governance” dead [15].
Descriptive definitions of governance separate the performance of governance agents (the means) from the aspirations (goals) of their principals. For instance, Fukuyama (p. 350, [20]) describes “governance as a government’s ability to make and enforce rules, and to deliver services, regardless of whether that government is democratic or not.” By excluding democracy from the definition, Fukuyama rejects the orthodoxy that democracy and good governance are mutually supportive. Instead, he argues that the “democracy–good governance” link is more of a theory than an empirically demonstrated fact, and that we cannot empirically demonstrate the connection if we define one to include the other. Similarly, De Herdt and De Sardan (p. 4, [21]) describe governance as “an emergent pattern or order of a social system, arising out of complex negotiations and exchanges between “intermediate” social actors, groups, forces, organizations, public and semi-public institutions in which state organizations are only one—and not necessarily the most significant—amongst many others seeking to steer or manage these relations.” Choosing this descriptive focus allows them to analyze public authority as the product of a social process.
In this Special Issue, we also define governance descriptively—as the attempts of stakeholders (social actors, groups, organizations, public, and semipublic institutions) to structure policy problems [22]. Thus, we conflate “governance” with a constructivist view of policymaking as “problem structuring” and use Hoppe’s typology to distinguish four idealtypes of policy problems (see Table 1).
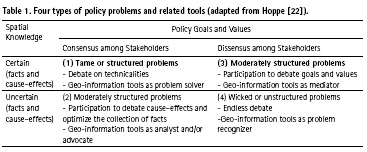
At the heart of the typology is the opposed pair of structured (or tame) versus unstructured (or wicked) problems. Problems are structured or tame (box 1) when stakeholders have far-reaching agreement on norms and values, and are certain about the factual and cause– effect knowledge needed to solve them. In contrast, unstructured or wicked problems (box 4) are hotly debated political issues where ethical disagreement and divisiveness in stakeholders’ preferences perseveres, while factual and cause– effect knowledge is uncertain. Because stakeholders attempt to solve ‘new’ problems by mixing solutions to ‘old’ problems, they are inclined to quickly move a wicked problem into a more structured direction that is more familiar to them and more compatible with existing standard operating procedures. Moderately structured problems appear in two variants—with consensus (box 2) or with dissensus (box 3) regarding stakeholders’ goals and values. This definition of governance casts a different light on the uses of geo-information tools depending on how stakeholders frame the policy problem: as a problem recognizer for unstructured problems, as problem analyst and advocate or mediator for moderately structured problems and as problem solver for structured problems (see Table 1). A few indicative examples are in order.
Geo-information tools as problem recognizer: The best-documented example is the detection of the ozone hole by way of remote sensing (RS) [8]. Concern about the detrimental effect of chlorofluorocarbons (CFCs) on the ozone layer stimulated the US Congress to commission NASA to develop the Total Ozone Mapping Spectrometer (TOMS) sensor to monitor the state of the ozone layer. The TOMS sensor was launched in 1978 on-board the NIMBUS satellite and did not report any anomalies until 1986. At that time, NASA confirmed, after re-analysis of the TOMS data, that the ozone hole had been growing since 1978. In response to these findings, the 1987 Montreal Protocol prescribed a 50% reduction, and four years later, a complete ban on the use of CFCs.
Geo-information tools as analyst and/ or advocate: The classical example is John Snow’s proto-GIS in 1854 that clustered cholera deaths of people accessing water from the Broad Street well in London [23]. Snow’s quantitative analysis, combined with Reverend Henry Whitehead’s extensive local knowledge of the community, provided strong evidence in support of his theory of cholera as a water-borne disease. Moreover, his analysis served as an advocacy tool that ultimately led to the endorsement of his theory by local officials. The latter concluded unanimously that the “striking disproportionate mortality in the “cholera area” … was in some manner attributable to the use of impure water of the well in Broad Street” (p. 182). The pump’s handle was removed soon after and the epidemic was contained.
Geo-information tools as mediator: An illuminating example of geo-information tools as mediator between conflicting interests is the Ogiek Peoples Ancestral Atlas, which included their hitherto excluded voices in contests about land. The Ogiek Indigenous People in the Mau Forest in Kenya planned the Atlas to define their ancestral territories within the Mau Forest Complex, and secure their rights and interests against the inflow of migrants. Prior to the Ancestral Atlas, the community had constructed a Participatory 3D Model of the territories. The model reinforced the bonds among the 25 Ogiek clans and their sense of belonging to a single cultural entity, with a unique cultural identity and indigenous knowledge system, instead of belonging to scattered clans [24]. The Ancestral Atlas depicted the tacit spatial knowledge of a semiliterate indigenous community, accumulated over generations in intimate interactions between the community and their natural environment.
Geo-information tools as problem solver: Finally, geo-information tools can provide the means to solve highly complex but still tame problems—i.e., when the spatial facts are or can be easily available from remote sensing, censuses, and field observation, the cause–effect links are relatively well understood and stakeholders agree on values and policy goals. Numerous examples of such uses figure in standard RS/GIS textbooks (e.g., Tolpekin and Stein [25]).
In addition to the problem typology, Hoppe [22] discusses how governance stakeholders tend to move from box 4 to box 1, depending on the way of social organizing—either individualist, or hierarchist, or egalitarian—they value most [26]. The three ways of social organizing correspond to the market, hierarchy, or network social coordination, respectively [27]. Each way is supported by (and, in turn, supports) a “cultural bias”; that is, a compatible pattern of perceiving, justifying, and reasoning about nature, human nature, justice, risk, blame, leadership, and governance. For instance, hierarchists tend to frame wicked problems as structured and prefer to move to box 1 sooner rather than later. Egalitarians view wicked problems from the perspective of fairness and are inclined to move to box 3, while individualists attempt to exploit any bit of usable knowledge before moving to box 1. The question remains as to how several stakeholders with a mix of inclinations (individualist, or hierarchist, or egalitarian) manage to move out of box 4 together? They must either reach some sort of congruence that has elements of most ways of social organizing—i.e., a hybrid way of social organizing—or they must shun the participation of “troublemakers”. For instance, Chandran et al. [28] discuss how the hierarchist UN Secretariat of the Convention on International Trade in Endangered Species (CITES) questioned the use of a GIS-based tool developed by the United Nations University, because the tool accorded an excessively important role to egalitarian NGOs (the “troublemakers”), and successfully excluded them from the debate.
In sum, defining governance as the structuring of wicked policy problems requires us to rethink the role of geoinformation tools in governance. At the same time, the use of geoinformation tools in problem structuring can reveal the degree of hybridity of social organizing, according to [26], or of social coordination, according to Bouckaert, Peters, and Verhoest [27].
Policy problems and geoinformation tools
Contributors to the Special Issue cover a spectrum of policy problems, from renewable energy, to climate change and bioenergy, to rural water supply and, finally, the coordination of spatial data infrastructures, which underpin efforts to address societal challenges [4]. The geo-information tools they develop and use in their analyses depend on how they frame the policy problem at hand.
Renewable energy is a priority for European countries and cities. Many of them have developed ambitious targets for greenhouse gas reduction; some of them, such as cities in the Netherlands, even aim to become carbon-neutral within the next 20 to 35 years [29,30]. However, the implementation of renewable energy systems such as wind turbines or solar farms in The Netherlands has been particularly slow compared with in other European countries. Devine [31] sees two main reasons for this: (a) limited institutional capacities of local decision-makers with respect to the implementation of renewable energy policies; and (b) strong opposition from local communities and individual citizens towards the implementation of large-scale renewable energy projects. Additional economical, institutional, and political factors may play a role [32]. For the city of Enschede, in The Netherlands, Flacke and de Boer [33] framed the problem as moderately structured with goal dissensus; the knowledge that a combination of wind turbines and solar farms can generate more renewable energy is certain, while local stakeholders may value things like aesthetics (the visual impact of turbines in the landscape) more than the government’s ambitious targets. The authors developed an interactive planning support tool, named COLLAGE, and deployed it in workshop settings, involving stakeholders in the participatory mapping of wind turbines and solar panels in Enschede. They show that the COLLAGE tool helps to increase citizen awareness for renewable energy, triggers social learning about renewable energy, supports improved engagement and participation of the public, and thereby aids local energy governance. The authors show that engaging with local stakeholders and communities early in the planning phase can lower public dissensus and increase the viability, legitimacy, and local relevance of renewable energy strategies. COLLAGE is a good example of a geoinformation tool as mediator between groups of stakeholders with diverging goals and values (box 3, Table 1).
Climate change raises equity issues, not only between continents and countries but also between regions, cities, and residents [34,35]. In this century of urbanization, where most people live in cities, the question necessarily turns to who is or will be affected in cities and how. Not only impacts, but also mitigation and adaptation policies are subject to political economy evaluations, with important questions being who can decide to implement adaptation and mitigation and where, to whom, and how it is applied. Lowincome residents are among the most vulnerable groups to climate change in urban areas, particularly regarding heat stress. However, their perceptions about heat and the impacts they face often go undocumented, and are seldom considered in decision-making processes delivering adaptation. Matmir, et al. [36] evaluate the perceptions of New York City residents concerning past impacts as well as the future need for adaptation to heat waves. Employing online interviews, the authors compare the heat impacts of different income groups and simulate adaptation scenarios. By using online interviews and applying Fuzzy Cognitive Mapping, the authors aim not only to calculate socially useful adaptation options, but also to give low-income groups a voice in the climate change adaptation planning process. The combination of online interviews and Fuzzy Cognitive Mapping is yet another example of a geo-information tool as mediator that includes previously unheard citizens in the policy-making process and reveals consensus or dissensus among income groups (box 3, Table 1).
Bioenergy generation is high on the European political agenda for the circular economy. Bioenergy refers to the reuse of biomass as an excellent raw material for the production of wood pellets for heating. In 2009, the overall supply of biomass in the Danube region (excluding non-EU countries where data was not available) was estimated at 1136.2 petajoules (PJ) with an agricultural contribution of 23%. Lisjak, et al. [37] frame bioenergy generation in the Danube region as a moderately structured problem with knowledge uncertainty. They assume that bioenergy stakeholders—a network of national experts representing each country in the Danube region who act as ’ambassadors’ of open data, biomass producers (owners of vineyards and orchards), and biomass utilizers—are convinced of the role of biomass reuse as a common good.
The knowledge uncertainty here refers to the lack of spatial facts, e.g., the location of available biomass (piles of branches) and their estimated volume. To produce the lacking spatial facts and close the data gap, the authors developed a smartphone-based geo-information tool: the ‘Waste2Fuel’ app. An owner of a vineyard or an orchard, standing close to the location of a pile of branches, and armed with the ‘Waste2Fuel’ app, can select ‘Add biomass site’, open a data form with fields to input a short description, a contact number, and the estimated volume of the pile, and enter the data. The biomass utilizer will receive this information on her smartphone and organize a pick-up. This kind of geoinformation tool is the essence of Citizen Science, “a complement, and even substitute, to data from such traditional sources… Individuals are no longer passive users of data generated by a designated institution on their behalf. On the contrary, they play a far more direct role in the creation and utilisation of content.” [37] Citizen Science comes to the rescue when facts are not readily available and citizens are willing to collect them and share them to minimize the uncertainty in factual spatial knowledge [38]. The Waste2Fuel tool and Citizen Science in general are applicable when the collection of discrete facts is the main challenge (box 2, Table 1).
Rural water supply in Tanzania is a wicked policy problem that persists since the country’s liberation from colonial rule. Currently, nearly half of rural water points are not functional and about 20% of newly constructed water points become nonfunctional within one year. Rural citizens—the largest part of a population of 44 million people—soon return to traditional, unimproved water sources and endanger their health and well-being. The problem’s wickedness is manifest in the lack of spatial facts regarding rural water points and the persistent lack of agreement at different levels of government on how to tackle the problem. In the first of three contributions on rural water supply policy-making in Tanzania, Verplanke and Georgiadou [39] discuss how the Ministry of Water bracketed out the disagreement among different levels of government on how to tackle rural water supply and assumed that the problem was one of data collection only. The Ministry developed the Water Point Mapping System (WPMS) database to support the monitoring of all water points, and improve policy-making and water supply services in rural areas.
The focus on the massive data collection for the WPMS database effectively moved the rural water supply problem from box 4 directly to box 2 (Table 1). The authors attributed some of the errors in the database to the bracketing-out of stakeholder disagreement and the discretionary nature of water point mapping. Katomero et al. [40] discuss how the bracketed-out disagreements later reappeared as three pervasive governance tensions, and moved the problem back to box 4. The first tension is between formal government standards and informal practices used by district water engineers and villagers to classify water points. The second tension is between the new and old administrative hierarchies at the district level. The third tension is between new and existing communication channels at the reporting and receiving ends of information. Finally, Lemmens et al. [41] discuss a mobile phone-based software tool, developed to serve as a boundary object— an object with different meanings and serving different purposes—for different stakeholders debating a wicked problem.
The tool helped the researchers to elicit conflicting views of stakeholders over a period of 4 years, and, in the process, assisted them in continuously redesigning the tool. They describe the current architecture of the tool’s frontend (the SEMA app) and backend and discuss how the perceptions and use patterns of stakeholders over time affected the tool design and resolved the tension over what to report (by decreasing the discretion of reporters) and who should report (by constraining the reporting “crowd”). As such, the tool acted as a problem recognizer in the context of a wicked policy problem (box 4, Table 1).
The remaining two contributions invert the perspective of the Special Issue in an innovative fashion. Instead of studying how geo-information tools are used in policymaking, the authors discuss what the use of geo-information tools reveals about the hybridity of policy-making, governance, and SDI governance in particular. This kind of research has a family resemblance with previous studies by Anand [42] and Richter [43]. For example, Anand [42] analyses the formal and informal practices in municipal water supply in Mumbai in order to reveal the social production of “hydraulic citizenship”, a form of belonging to the city enabled by claims residents make to the city’s water infrastructure. Richter (2014) studies formal and informal ways of recording information on land ownership in Indian cities in order to reveal the blurred governance space between urban administration and urban society. Sjoukema et al. [44] examine the governance history of the SDIs in The Netherlands and in Flanders (Belgium), using the evolution of large-scale base maps as SDI proxies and, effectively, as geo-information tools. Their longitudinal study shows that SDI governance has been adaptive, that governance models (individualist, hierarchist, or egalitarian) did not hold up very long, as they were either not meeting their goals, were not satisfying all stakeholders, or were not in alignment with new visions and ideas. They argue that adaptive governance with a broader mix of individualist, hierarchist, or egalitarian policy instruments can better respond to changes. Chantillon et al. [45] focus empirically on Belgium to understand what kinds of social coordination (market, hierarchist, and network) are used for geospatial e-services and data in various regions. They show that Flanders combines hierarchy with network (egalitarian) governance, whereas the Brussels administration prefers a hierarchist way of working.
The transposition of the Infrastructure for Spatial Information in the European Community (INSPIRE) Directive stimulated a turn towards a more networkoriented (individualist) governance in the Walloon and the Brussels Capital Regions. They conclude that the current status of social coordination is a weak form of network governance.
Conclusions
We have shown that the mainstream view of geo-information tools as contributing to collection, analysis, and dissemination of data may not be so productive when we deal with wicked policy problems. The contributions to the Special Issue show that an alternative view of geo-information tools as problem recognizers, as problem analysts and advocates, as mediators, and as problem solvers is more appropriate, mainly for three reasons: First, the framing of the policy problem (as tame, moderately structured, or wicked) by the researchers themselves becomes more transparent, and increases the researchers’ reflexivity. Second, geo-information tools can now be seen as an integral part of a social context, and as interventions in larger political systems, infused with dissensus on policy goals and values, as well as uncertainty regarding spatial knowledge (spatial facts and cause–effect links). Last, but not least, this view enables us to invert the lens and study not only how geo-information tools are used in policymaking and governance, but also what the use of geo-information tools in a certain social context reveals about the hybrid nature of policy-making, governance, and SDI governance in particular.
Author Contributions: The authors jointly conceptualized the contributions to the Special Issue, analyzed them and wrote the paper.
Conflicts of Interest: The authors declare no conflict of interest.
References
1. Group on Earth Observations (GEO). Geo Strategic Plan 2016– 2025: Implementing Geoss; Group on Earth Observations (GEO): Geneva, Switzerland, 2016.
2. Jones, H. Taking Responsibility for Complexity: How Implementation Can Achieve Results in the Face of Complex Problems; Oversees Development Institute (ODI): London, UK, 2011.
3. Rittel, H.W.J.; Webber, M.M. Dilemmas in a general theory of planning. Policy Sci. 1973, 4, 155–169.
4. Nedovic-Budic, Z.; Crompvoets, J.; Georgiadou, Y. Spatial Data Infrastructures in Context: North and South; CRC Press: Boca Raton, FL, USA, 2011.
5. Georgiadou, Y.; Rodriquez- Pabón, O.; Lance, K.T. Spatial data infrastructure SDI and e-governance: A quest for appropriate evaluation approaches. URISA J. 2006, 18, 43–55.
6. Van de Donk, W.B.H.J.; Snellen, I.T.M. Towards a theory of public administration in an information age? In Public Administration in an Information Age; Snellen, I.T.M., Van de Donk, W.B.H.J., Eds.; Elsevier: Amsterdam, The Netherlands, 1988.
7. Esty, D.C. Environmental protection in the information age. N.Y. Univ. Law Rev. 2004, 79, 115–211.
8. De Leeuw, J.; Georgiadou, Y.; Kerle, N.; De Gier, A.; Inoue, Y.; Ferwerda, J.; Smies, M.; Narantuya, D. The function of remote sensing in support of environmental policy. Remote Sens. 2010, 2, 1731.
9. Rajão, R.; Georgiadou, Y. Blame games in the amazon: Environmental crises and the emergence of a transparency regime in Brazil. Glob. Environ. Politics 2014, 14, 97–115.
10. Purdy, R.; Leung, D. Evidence from Earth Observation: Emerging Legal Issues; Martinus Nijhoff Publishers: Leiden, The Netherlands, 2013; Volume 7, p. 465.
11. Stone, D. Policy Paradox: The Art of Political Decision Making; Revised Edition; W. W. Norton & Company: New York, NY, USA, 2002.
12. Sabatier, P.A. Theories of the Policy Process; Westview Press: Boulder, CO, USA, 2007.
13. Bovaird, T.; Löffler, E. Evaluating the quality of public governance: Indicators, models and methodologies. Int. Rev. Adm. Sci. 2003, 69, 313–328.
14. Pollitt, C.; Hupe, P. Talking about government. Public Manag. Rev. 2011, 13, 641–658.
15. Grindle, M.S. Good governance, R.I.P.: A critique and an alternative. Governance 2017, 30, 17–22.
16. March, J.G.; Olsen, J.P. Rediscovering Institutions; The Free Press: New York, NY, USA, 1989.
17. Mosco, V. The Digital Sublime: Myth, Power and Cyberspace; The MIT Press: Cambridge, MA, USA, 2004.
18. Grindle, M.S. Good enough governance: Poverty reduction and reform in developing countries. Governance 2004, 17, 525–548.
19. Grindle, M.S. Good enough governance revisited. Dev. Policy Rev. 2007, 25, 533–574.
20. Fukuyama, F. What is governance? Governance 2013, 26, 347–368.
21. De Herdt, T.; De Sardan, J.- P.O. Real Governance and Practical Norms in Sub-Saharan Africa: The Game of the Rules; Routledge: London, UK, 2015.
22. Hoppe, R. The Governance of Problems; Policy Press: Bristol, UK, 2010.
23. Johnson, S. The Ghost Map: The Story of London’s Most Terrifying Epidemic, and How It Changed Science, Cities and the Modern World; Riverhead Books, Penguin Group USA: New York, NY, USA; London, UK, 2006.
24. Rambaldi, G.; Muchemi, J.; Crawhall, N.; Monaci, L. Through the eyes of hunter-gatherers: Participatory 3d modelling among ogiek indigenous peoples in Kenya. Inf. Dev. 2007, 23, 113–128.
25. Tolpekin, V.; Stein, A. The Core of GIScience: A Systems- Based Approach; University of Twente, Faculty of Geo- Information Science and Earth Observation (ITC): Enschede, The Netherlands, 2012; p. 524.
26. Douglas, M.; Wildavsky, A.B. Risk and Culture: An Essay on the Selection of Technical and Environmental Dangers; University of California Press: Berkeley, CA, USA, 1983.
27. Bouckaert, G.; Peters, B.G.; Verhoest, K. Resources, mechanisms and instruments for coordination. In The Coordination of Public Sector Organizations—Shifting Patterns of Public Management, 1st edition; Palgrave Macmillan: Basingstoke, UK, 2010; pp. 34–50.
28. Chandran, R.; Hoppe, R.; de Vries, W.T.; Georgiadou, Y. Conflicting policy beliefs and informational complexities in designing a transboundary enforcement monitoring system. J. Clean. Prod. 2015, 105, 447–460.
29. Reckien, D.; Flacke, J.; Dawson, R.J.; Heidrich, O.; Olazabal, M.; Foley, A.; Hamann, J.J.-P.; Orru, H.; Salvia, M.; De Gregorio Hurtado, S.; et al. Climate change response in Europe: What’s the reality? Analysis of adaptation and mitigation plans from 200 urban areas in 11 countries. Clim. Chang. 2014, 122, 331–340.
30. Heidrich, O.; Reckien, D.; Olazabal, M.; Foley, A.; Salvia, M.; de Gregorio Hurtado, S.; Orru, H.; Flacke, J.; Geneletti, D.; Pietrapertosa, F.; et al. National climate policies across Europe and their impacts on cities strategies. J. Environ. Manag. 2016, 168, 36–45.
31. Devine, W.P. Renewable Energy and the Public: From Nimby to Participation; Earthscan: Milton Park, UK, 2011.
32. Sovacool, B.K.; Lakshmi Ratan, P. Conceptualizing the acceptance of wind and solar electricity. Renew. Sustain. Energy Rev. 2012, 16, 5268–5279.
33. Flacke, J.; de Boer, C. An interactive planning support tool for addressing social acceptance of renewable energy projects in the Netherlands. ISPRS Int. J. Geo-Inf. 2017, 6, 313.
34. Reckien, D.; Creutzig, F.; Fernandez, B.; Lwasa, S.; Tovar-Restrepo, M.; Mcevoy, D.; Satterthwaite, D. Climate change, equity and the sustainable development goals: An urban perspective. Environ. Urban. 2017, 29, 159–182.
35. Reckien, D.; Lwasa, S; Satterthwaite, D.; McEvoy, D.; Creutzig, F.; Montgomery, M.; Schensul, D.; Balk, D. Khan, I. Equity, environmental justice, and urban climate change. In Climate Change and Cities: Second Assessment Report of the Urban Climate Change Research Network; Rosenzweig, C., Solecki, W., Romero-Lankao, P., Mehrotra, S., Dhakal, S., Ali Ibrahim, S., Eds.; Cambridge University Press: Cambridge, UK; New York, NY, USA, 2018.
36. Matmir, S.; Reckien, D.; Flacke, J. What do new Yorkers think about impacts and adaptation to heat waves? An evaluation tool to incorporate perception of low-income groups into heat wave adaptation scenarios in New York City. ISPRS Int. J. Geo-Inf. 2017, 6, 229.
37. Lisjak, J.; Schade, S.; Kotsev, A. Closing data gaps with citizen science? Findings from the Danube region. ISPRS Int. J. Geo-Inf. 2017, 6, 277.
38. Kusumo, A.N.L.; Reckien, D.; Verplanke, J. Utilising volunteered geographic information to assess resident’s flood evacuation shelters. Case study: Jakarta. Appl. Geogr. 2017, 88, 174–185.
39. Verplanke, J.; Georgiadou, Y. Wicked water points: The quest for an error free national water point database. ISPRS Int. J. Geo-Inf. 2017, 6, 244.
40. Katomero, J.; Georgiadou, Y.; Lungo, J.; Hoppe, R. Tensions in rural water governance: The elusive functioning of rural water points in Tanzania. ISPRS Int. J. Geo-Inf. 2017, 6, 266.
41. Lemmens, R.; Lungo, J.; Georgiadou, Y.; Verplanke, J. Monitoring rural water points in Tanzania with mobile phones: The evolution of the SEMA app. ISPRS Int. J. Geo-Inf. 2017, 6, 316.
42. Anand, N. Pressure: The Politechnics of water supply in Mumbai. Cult. Anthropol. 2011, 26, 542–564.
43. Richter, C. Digital Transformations in Indian Cities: Between Paper List and GIS Map; University of Twente, Faculty of Geo- Information Science and Earth Observation (ITC): Enschede, The Netherlands, 2014.
44. Sjoukema, J.-W.; Bregt, A.; Crompvoets, J. Evolving spatial data infrastructures and the role of adaptive governance. ISPRS Int. J. Geo-Inf. 2017, 6, 254.
45. Chantillon, M.; Crompvoets, J.; Peristeras, V. The governance landscape of geospatial e-services—The Belgian case. ISPRS Int. J. Geo-Inf. 2017, 6, 282.
© 2018 by the authors. The paper was published in International Journal of Geo Information, January 2018, 7, 21.


 (2 votes, average: 1.50 out of 5)


Leave your response!