| GNSS - New | |
Galileo Green Lane
An app to optimize the border crossing time during the Covid-19 crisis |
 |
|
 |
|
 |
|
 |
|
 |
|
 |
|
 |
|
 |
|
1. Introduction
In the first phase of the Covid-19 crisis, many countries of the European Union (EU) introduced severe measures limiting the free movement of persons and goods across borders. The objective of these measures was the contention of the spreading of the virus and the impact this would have on public health. The entry bans at the internal land borders and the restrictions on drivers entering in some Member States (MSs) affected land-based services, and in particular road services, which represent 75% of freight transport. Indeed, such measures caused an increase in the border crossing time which, at certain internal EU borders, was longer than 24 hours, even for medical supplies (1).
With the purpose to allow efficient movement of essential goods, the European Commission (EC) has required MSs to identify relevant border-crossing points on the trans-European transport network (TEN-T). These ‘green lane’ border crossing points shall be open to all freight vehicles. The Commission also recommended that the crossing time in any internal border, including all the necessary checks and health screening, should not take more than 15 minutes (1). The creation of the green lane border network has contributed to guarantee the supply chain, which is of crucial importance for the functioning of the EU’s internal market and its effective response to the public health crisis.
To provide a prompt response and help manage this crisis, the EU GNSS Agency (GSA) launched an ad-hoc R&D project to support the development and dissemination of an Android app, called Galileo Green Lane (GGL), aimed to monitor the border crossing times and queues length at the TEN-T border crossing points. Specifically, the tool allows to monitor the movement of freight vehicles on the road and record the crossings times at the borders, exploiting Global Navigation Satellite System (GNSS)-based navigation and in particular, Galileo.
A GSA project consortium composed of three companies, FoxCom, SixFold, and Spacetec Partners, oversaw the design, development and dissemination of the app. The Joint Research Centre (JRC) of the EC supported the consortium during the deployment and validation phases. This article describes the app and showcases its practical usage from April to July 2020.
The paper is structured as follows: Section 2 provides an overview of the app, Section 3 describes the geo-fencing algorithm adopted by the app, Section 4 describes how the GNSS raw data provided by the phone were used for an initial assessment of the app, Section 5 provides details on the app pilot phase, Section 6 analyses some of the data recorded by the app server and Section 7 provides some conclusions.
2. Galileo Green Lane mobile app overview
The GGL mobile app has two main purposes.
The first purpose is to collect relevant data about the traffic situation and queue time at selected border crossing points (in both directions). There are two ways of collecting these data.
1. Border officials take data records about the overall situation and queue time at border crossing points. These records consist of information about the expected queue time, comments from the official about the situation, and a photo of the current situation at the border crossing.
2. A geo-fencing algorithm (described in Section 3) automatically estimates queue time by drivers with the GGL app driving through the border crossing point.
These data are sent to the server for further processing.
The second purpose of GGL is to inform drivers (users of application) about the situation at all TEN-T border crossing points. A driver can access a map of Europe in the app, where all TEN-T border crossing points are displayed. Each border crossing point has information about the expected queue time in both directions. This enables the driver to select the optimal route.
There are two groups of GGL users. Truck drivers, who use the GGL app to get information about the current situation at border crossing points, and border officials, who use the GGL app to report on the situation at their border crossing. These data get combined and forwarded to the servers of Sixfold for further processing and visualisation.
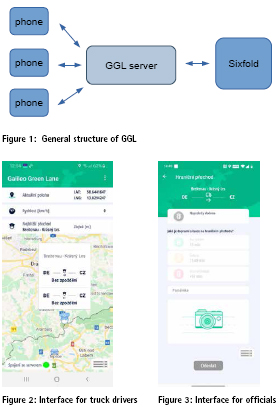
Figure 1 describes the general structure of GGL. There are three main parts.
• The mobile application running on phones which is used by officials to collect data or by truck drivers to select the optimal route and log driver geo-fenced data.
• The GGL server which stores and provides data from phones and data about the situation at TEN-T border crossing points.
• The Sixfold server which calculates and provides delays on bordercrossing points, and then processes that data for further visualisation. Data acquired on phones (records from officials and geo-fencing data) are saved on the GGL server (localization coordinates are only used for processing within the geo-fencing algorithm and are deleted after 7 days). These data are sent to Sixfold to process and calculate the overall delays at the border crossing points. These delays are sent back to the GGL server (every 15 minutes) and then distributed back to the phones. The delays at border crossing points are presented on the map view to users (drivers).
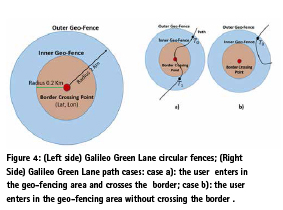
Figure 2 shows the Map view screen. Driver coordinates, speed and nearest border crossing point are shown at the top of the screen. The rest of the screen shows the actual position of the driver (car object) and the position of the nearest border crossing. The user is able to scroll around the map to see other border crossing points. By tapping the crossing itself, information about the current queue times in both directions will appear.
Figure 3 shows the screen for border officials. The official can switch the direction of crossing to indicate the flow of traffic. Below this information, three buttons describe the traffic situation, whether it is Green (traffic < 15 mins), Yellow (15 mins < traffic < 60 mins) or Red (60+ mins). The official has to select one of them to make a new record. The official can then optionally add a comment or take a photo of the situation. The entire record is sent to server by pressing the Send button.
The mobile app consists of a map view screen for the truck driver, a screen for border officials, a settings screen to set default app parameters, a help screen and an about screen.
3. Galileo Green Lane geofencing algorithm
As introduced in Section 2, the GGL estimation of the queue time at each border is based on the definition of a geo-fencing area around the border. The term geo-fence refers to a virtual perimeter built around a geographic area or point. Currently, most geofencing applications are used to send notifications/warnings when area boundaries are not respected. Indeed, geo-fencing techniques enable monitoring of areas surrounded by a virtual fence, while the monitoring process allows the automatic detections when tracked mobile objects enter or exit these areas. In general, the main problem is the determination of the inclusion of the user location into the fence. Determining the inclusion of a point in a polygon, the geo-fencing perimeter, is a geometric problem that can be used using different methods, as detailed, for example in (2),(3),(4),(5).
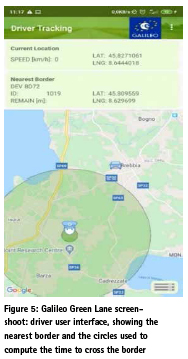
In the GGL case, the geo-fencing algorithm, that is the core of app, is based on the circular method, namely the fences are built using two concentric circumferences, as shown in Figure 4 (Left side). The inner geofence has a radius of 0.2 km while the external one has a radius of 2 km.
The geo-fencing algorithm allows the computation of the border crossing time by first defining the start and end of the geo-fencing path. It marks the start of the path as soon the user enters in the outer circle, while it marks the path end in the two following cases represented in Figure 4 (Right side)
1. When the user leaves the inner circle after having entered in it in Figure 4
2. When the user leaves the outer circle without entering in the inner circle in Figure 4 (case b)
In the first case the border is marked as crossed, while in the second case the border results uncrossed. Along the path, the user positioning data are recorded every 5 seconds. The time necessary to cross the border is estimated using Eq 1. The parameter is computed as the difference of the time at the start point of the path ( in the right side of Figure 4) and the time at the end of the path ( in the right side of Figure 5).
BTC = T1– T0 (1)
This parameter is fundamental to evaluate the implementation of the EC guidelines. In addition, this temporal indicator provides information on the presence of a queue at the border. The BCT is impacted by the identification of the two time instants T1 and T0. An erroneous estimate of T0, too far from the outer border, could cause an underestimate of the BCT creating a miss detection of possible queues. On the other hand, the erroneous evaluation of T1, too far from the edge of the inner fence, could lead to an overestimation of the BCT, creating a false alert. These issues are mitigated using the contribution of the officials at the border and using a consistency check on the path. The latter consists in checking that the path length is not too big/small with the purpose to avoid the path length overestimation/ underestimation and make the algorithm robust. In Figure 5, a GGL screenshot displays the nearest border and the external and inner circles defined by the geo-fencing algorithm, as discussed above.
4. Testing the Galileo Green Lane app using GNSS raw data
Before the start of the official pilot test phase launched on the 23rd of April 2020, several dynamic tests were carried out to assess the performance and robustness of the app.
The tests were carried out by exploiting three different Android smartphones with the Galileo Green Lane app enabled, namely a Xiaomi Mi9, a Xiaomi MiA1 and a Samsung S8. The test vehicles with the smartphones on board transited in proximity of different EU border crossing points.
In some cases, the vehicles crossed the borders while for some tests they performed a turn without crossing it. In this way it was possible to test if the app could correctly detect the border crossing event without ambiguity.
The above Android smartphones were also enabled to collect raw GNSS measurement through one of the several applications currently available for this purpose, namely Geo++ (6).
This application allows logging raw GNSS data and to access GNSS navigation messages, carrier, code measurements and other information. Then the measurements were post-processed using an online raw measurement processor implementing Single Point Positioning (SPP) (7) to obtain a positioning solution with a 1 Hz data rate.
The reference solution generated using the raw GNSS data has a higher frequency with respect to the position data used by the Galileo Green Lane Mobile application, that are collected every 5 seconds, namely with a frequency rate of 0.2 Hz.
After processing the GNSS raw data, the time tagged positions of the phone were extracted and used as input to the geofencing algorithm adopted by the app.
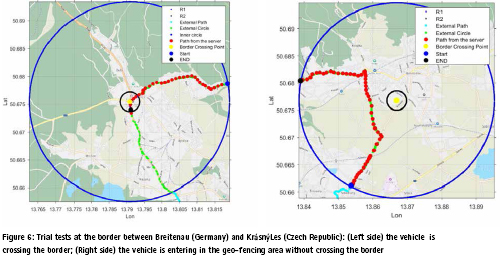
As sample case and to showcase the operation mode of the geo-fencing algorithm, the results of two tests performed at the border between Germany and Czech Republic are reported in Figure 6. On the left side the results of a test with a vehicle crossing the border is shown, while on the right side the case of a vehicle entering in the geo-fencing area without crossing the border is reported. The last test was performed to assess the robustness of the algorithm in recognizing the border crossing event in case of ambiguous situations.
The paths estimated by the app, and stored on the backup server, are overlapped to the reference path identified by using the higher rate data.
As mentioned in Section 2, the external and inner geo-fencing circles have a ray of 2 km and 0.2km and in Figure 6 they are indicated in blue and black, respectively. The reference path, estimated from the GNSS raw data, is indicated in green when the user is inside the external geo-fencing circle (and outside the inner circle) while it becomes blue when the user is inside the inner circle. The start and end path points identified by the geo-fencing algorithm are also marked. Finally, the border crossing point is represented in yellow.
From Figure 6 we can observe the good agreement between the reference trajectory and the results provided by the app, which is in red and labelled as “Path from the server”
The high date rate were used also to check the user position with respect to the geo-fencing area. For this purpose a flag indicated as “State” is provided after processing the high rate data. The latter can assume the following values
• State = 3 (the user is outside the geo-fencing area)
• State = 2 (the user is inside the external geofencing circle but outside the inner circle)
• State = 1 (the user is inside the inner circle)
In the upper part of Figure 7 the state variable is plotted for the last case corresponding to the uncrossed border point while in the lower part the distance of the user from the border crossing point is shown. We can see that the variable is first equal to 3, when the user is outside the geo-fencing area and then it becomes equal to 2 when the track enters into the external circle and indeed the distance of the user from the border is below 2 km. Afterward, the variable is again equal to 3 indicating that the user left the external geofencing circle without entering in the inner circle and indeed the distance of the user from the border is above 2km. This confirms the result provided by the app indicating that the border has not been crossed.
5. Pilot phase
In preparation for an EU-wide release in May, a pilot testing period was initiated with Hungary and the Czech Republic. Both countries piloted the solution for a 15-day period, with Hungary testing at 3 borders (with Austria, Romania, and Slovakia), and the Czech Republic testing at 6 borders (with Austria, Germany, Poland, and Slovakia). Additionally, the truck driver app was tested with drivers at several border points.
The pilot testing lasted for 15 days in both countries, and during this pilot phase, border authorities were expected to:
• Report on the border situation every 30 minutes
• Instruct officials on duty to use the application and report on the borders
• Ensure the safety of the smartphone device
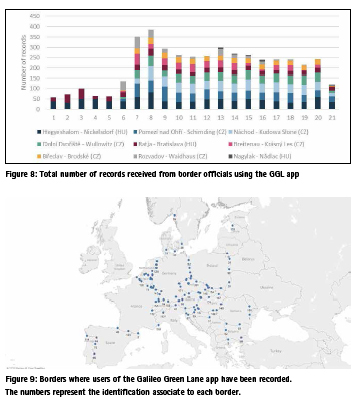
During the pilot, a total of 4,031 records were received from the Czech and Hungarian border officials. The total number of record received from border official using the GGL app is shown in Figure 8 for the different borders.
On the truck driver side, 517 geofencing records were received from 164 drivers crossing 79 border points spanning 26 countries: Austria, Belgium, Bulgaria, Croatia, Czech Republic, Denmark, France, Germany, Greece, Hungary, Italy, Lithuania, Luxembourg, Netherlands, Norway, Moldova, Poland, Portugal, Romania, Serbia, Spain, Slovakia, Slovenia, Sweden, Switzerland, and Turkey

6. Analysis of the Galileo Green Lane server’s data
From the beginning of the pilot test phase, the GGL backup server stored the data of all users exploiting the app at the different borders on a weekly basis. Specifically, the server stored a file with all recorded geo-fencing paths, the associated border, the path length and the time necessary to complete the path as estimated by the app. After every week, the data were removed for privacy reasons.
Therefore, the weekly data available on the server represented a fundamental resource to monitor the performance of the app and identify any issue in a timely fashion.
Moreover, the data provided by the GGL server has also been exploited to analyse the traffic flow at the different borders and the users exploiting the app for 13 weeks, starting from the 19th of April to 22nd of July 2020. The borders where the app was used are shown along with the identification numbers associated to each border. Identification numbers larger than 1000 indicate test border crossing points. From Figure 9 we can observe the widespread diffusion of the app all over Europe.
The number of app users has been evaluated by counting the sum of the different phone identification codes provided by the server and corresponding to paths with border crossing. A map with circles of size changing according to the number of users is reported in Figure 10. The map has been created considering the aggregated data of the period under analysis, allows visualising the borders where the number of users was higher for the period under analysis. In particular, we can see that two borders crossing points between Spain and France show the biggest number of users on the entire period of observation. They are first the border between Hendaye and Irún/Behobia and then the one between Le Perthus and La Jonquera, indicated in Figure 10 with the id 49 and 2, respectively.
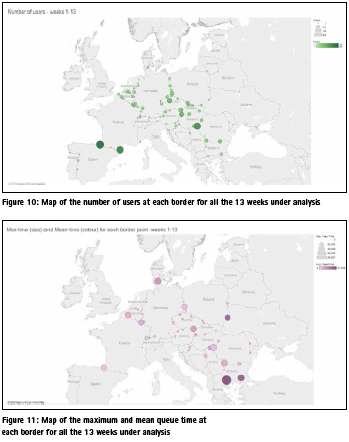
As expected, in general, for all borders, the number of users was bigger during the first seven weeks, namely until the second week of June. This is likely due to the fact that in the second half of June in many EU countries the Covid crisis situation improved and the measures restrictive for the circulation of people and goods were relaxed. As results of the general improvement, the app users decreased.
For all weeks, also the mean and maximum queue time at each border have been evaluated. The statistics can be visualized on the map in Figure 10 where the max queue time is represented by the size of the circle while the mean time is represented by the colour intensity. From the map, we can see that there are borders where the average queue time is above 15 minutes, they are, for example, the borders between Bulgaria and Greece/Turkey, indicated in Figure 11 by the id 5 and 56, respectively. This is also the case for the border between Poland and Ukraine marked with the id 29. At these borders even if the number of users is not higher than the one of other borders, the mean queue time is higher. This could be caused by more time-consuming check procedures applied at these borders.
7. Conclusions
The Galileo Green Lane app, presented in this article, represents an important tool to manage the traffic at the TEN-T borders during the coronavirus crisis. Indeed, the results presented prove that this app has successfully monitored the crossing times and queues length at the green lane crossing points. It has also shown to provide border officials and transporters with real time update on the status of the traffic at the border crossing points, allowing them to identify the borders under higher load and thus find alternative routes. Last but not least, the app enabled users to see the overall EU border situation in real-time and contribute to the online status by reporting the traffic at their border at regular intervals.
References
1 European Commission “Communication from the Commission on the implementation of the Green Lanes under the Guidelines for border management measures to protect health and ensure the availability of goods and essential services”, C(2020) 1897 final, Bruxelles 23 March 2020
2 Mia N. Stevens_ and Brandon T. Coloey and Ella M. Atkins, Platform-Independent Geofencing for Low Altitude UAS Operation. 15th AIAA Aviation Technology, Integration, and Operations Conference
3 Sarah D’Souza, Abe Ishihara, Ben Nikaido and Hashmatullah Hasseeb, Feasibility of Varying Geo-Fence around an Unmanned Aircraft Operation based on Vehicle Performance and Wind. 2016 IEEE/AIAA 35th Digital Avionics Systems Conference (DASC)
4 Shimrat, M. (1962). Algorithm 112: position of point relative to polygon. Communications of the ACM, 5(8), 434.
5 Anderson, K. (1976). Simple algorithm for positioning a point close to a boundary. Jour. Math. Geology, 8(1), 105–106.
6 Logging Of GNSS Raw Data On Android”, Geo++ website, available at http://www.geopp.de/loggingof- gnss-raw-data-on-android
7 Rokobun site available at https:// www.rokubun.cat/gnss-cloud/


 (No Ratings Yet)


Leave your response!