|
Fakhereh Alidoost
|
M.Sc. Student, Remote Sensing Department,
|
Faculty of Geodesy and Geomatics,
|
K.N.Toosi University of Technology,Tehran, Iran,
|
f.alidoost@sina.kntu.ac.ir
|
|
|
M. Reza Mobasheri
|
Associate Professor, Remote Sensing Department,
|
Faculty of Geodesy and Geomatics,
|
K.N.Toosi University of Technology,Tehran, Iran,
|
mobasheri@kntu.ac.ir
|
|
|
A. A. Abkar
|
Associate Professor, Remote Sensing Department,
|
Faculty of Geodesy and Geomatics,
|
K.N.Toosi University of Technology,Tehran, Iran,
|
abkar@kntu.ac.ir
|
|
Abstract
One of the physical quantities that could be acquired from remote sensing data is surface
reflectance in different regions of electromagnetic reflected spectrum. Almost all the urban
pixels imaged by low/medium spatial resolution sensor systems represent a composite
radiance field emanating from several distinct features with different reflectance within the
sensor’s field of view.Several factors such as existence of mixed pixels, non-Lambertian
behavior of urban areas and material aging, complicate urban environments rather than
other environments.An approach for describing urban environments is using unmixing
models. One of the most common unmixing models is linear spectral mixture analysis in
which the mixed pixel’s reflectance is a linear combination of the reflectance and fractions
correspondingto land cover types within the pixel.In this paper, spectral reflectance of
urban classes is determined using spatial unmixing model. To this end, spatial information
from IKONOS panchromatic image and spectral information from IKONOS multispectral
image was employed. Spatial resolutions of these images are 1m and 4m and the numbers
of bands are 1 and 4, respectively. The validity of the proposed method was substantiated
through comparison of IKONOS original image to the reconstructed image. The
experimental results lead to root mean square error (RMSE), relative error (R_Error) and
normalized cross correlation (NCC) of 0.013, 2.76% and 0.76, respectively.
Key words
: Reflectance, Urban, SMA, Spatial resolution, Spectral resolution.
Introduction
Human land use activities have significantly contributed to the ecological degradation of
our planet (Zurita Milla, Guillen-Climent, & Clevers). In this context, accurate and up-todate,
land use and land cover information is essential to quantify the real magnitude of
these changes and their potential impact on our future welfare(Zurita Milla, Guillen-
Climent, & Clevers). Common problems in detailed and accurate urban area remote
sensing results typically consisting of built up structures (buildings, transportation areas),
various vegetation covers (e.g. parks, gardens, agricultural areas), bare soil zones and
water bodies. There are several important questions which are related to the spectral
properties of urban materials such as: how do those materials differ in their spectral
response; what are the most suitable spectral bands for mapping urban land cover; what
are spectral limitations of current high spatial resolution remote sensor systems in terms of
mapping urban land cover, how fusing different data could be used for improving
classification accuracy and urban spectral reflectance modeling, etc.Due to high spatial
variability of urban structure with spectrally heterogeneous materials close to each other,
mixed pixels are still common in images of such areas. Other factors more complicate
urban environments, including non-Lambertian behavior of urban materials that leads to
high within-class spectral variability and material aging, which causes spectral changes.
There are many factors introduced in the literature that demonstrate the importance of
determination of urban reflectance spectral characteristics for urban materials, detailed
characterization for impervious surface mapping or urban vegetation monitoring, urban
material quality assessments, traffic effects on urban reflectance, growing needs for a
suitable and optimum method for urban modeling,change detection and developing
methods to quantify the amount of change, determination of aged and worn urban
surfaces. In order to accurately characterize this complex spatial environment, specific
spatial and spectral sensor characteristics and improved image analysis techniques are
required(Herold & Scepan, 2002).High resolution remote sensing data are of special
interest for a variety of applications related to urban planning and management.
The purpose of this study is to propose and test a methodology which employs the linear
mixing model to produce the spectral reflectance using IKONOS multispectraland
panchromatic imagery in urban environments.
Reflectance determination approaches
Reflectance of a target can be measured in three ways: in the laboratory, in the field, or
from an elevated platform such as a sensor. Total reflectance is the ratio of the reflected
radiant flux to the incident flux. This quantity can be determined in the laboratory for a
small sample of the target using a spectrophotometer. Spectral reflectance of natural
surfaces can be measured in the field by using a radiometer. Using sensor measurements,
there are additional complications like atmospheric scattering and absorption
effects(Bowker & Davis, 1985).
Planetary reflectance (ρi) is sometimes used with earth imagery to reduce the image-toimage
illumination differences by normalizing for solar irradiance(Taylor, 2005).
Planetary reflectance is defined as(Taylor, 2005),

where,
ρ i = Unitless planetary reflectance,
L i = Radiance for spectral band i at the sensor’s aperture (W/m2/μm/sr),
d= Earth-Sun distance in astronomical units,
Esun i = Mean solar exoatmospheric irradiances (W/m2/μm),
Sθ = Solar zenith angle.
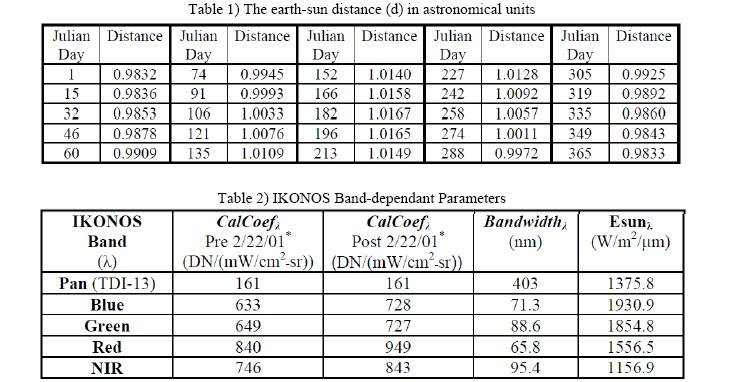
Li can be obtained in the correct units from the IKONOS image product by converting
from digital values (DNi) using the equation (2)(Taylor, 2005),

where,
CalCoef i = Radiometric calibration coefficient [DN/(mW/cm2-sr)]
Bandwidthi= Bandwidth of spectral band i (nm)
Both CalCoefi and Bandwidthi for the IKONOS bands are given in Table 2(Taylor, 2005).
The earth-sun distance (d) in astronomical units can be obtained from any nautical
handbook or interpolated from the values listed in Table 1(Taylor, 2005).
Methodology
3.1. Mixed pixel and Spectral mixture analysis
One of the major parameters in characterization of urban reflectance is the spatial
resolution of the sensor. Due to higher spatial variability of phenomena in urban areas
compared to sensor resolution, there are mixed pixels in low-medium spatial resolution
sensor imagery. Mixed pixels represent a composite radiance field emanating from several
distinct features with different reflectance within the sensor’s field of view.
Multisensor Multiresolution Technique (MMT) can be applied to unmix low-resolution
images using the information about their pixel composition from co-registered highresolution
images(Zhukov, Oertel, Lanzl, & Reinhackel, 1999).
SMA is based on the observations that in many situations, radiances from surfaces with
different ‘‘endmember’’ reflectance mix linearly within the IFOV(Small, 2003). SMA can
be given by:

R (λ) is the observed radiance; E (λ) is the spectrum corresponding to the ith endmember,
n is the number of endmembers and f is the endmember fraction in the mixed pixel.
The objective of some urban researches is to determine the reflectance spectrum of the
classes in each mixed pixel using spectral mixture analysis. Figure 1 shows the flowchart
of these approaches.
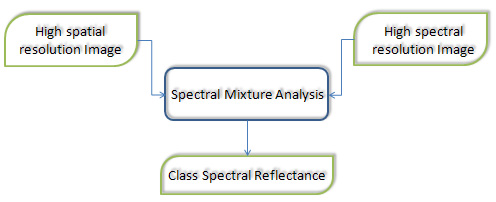
Fig.1. Determination of class spectral reflectance in each mixed pixel using SMA.
SMA equations for one band and several image pixels can be given by



In recent years, (Zhukov, Oertel, Lanzl, & Reinhackel, 1999), (Zurita-Milla, Kaiser,
Clevers, & Schneider, 2009), (Mezned & abdeljaoued, 2009), (F. Haertel & Edemir
Shimabukuro, 2005), (Zeng, E. Schaepman, & Wu, 2007) and(Busetto, Meroni, &
Colombo, 2008) used this method for determining class spectra. Subtle analysis reveals
that there are a few of these researches which have focused on urban environments using
this method applied to very high spatial resolution images (e.g. IKONOS, QuickBird,
Geoeye).
The MMT is based on classifying the high spatial resolution imageand retrieving signals
of the low spatial resolution image for the classes recognized in the high-resolution data.
From this point of view, the high-resolution image are conventionally called the
classifying instrument (CI), while the lower-resolution image are called the measuring
instrument (MI)(Zhukov, Oertel, Lanzl, & Reinhackel, 1999).
The algorithm includes the following operations:
1) Definition of class fractions.
2) Window-based unmixing of the MI-pixels for determination of class spectra.
3) Reconstruction of the MI pixels.
4) Validation.
Determination of class fractions
The CI image was classified into ten clusters using the K-Means algorithm. In the new
way, the fractions related to each MI pixel are calculated via area of each polygon related
each class in one mixed pixel through equation (6).

where,
fi=fraction for i-th class,
Determination of class spectra
The inverted linear spectral mixture analysis is used to retrieve class spectra. Employing a
5 by 5 pixels moving window, the weighted constrained least square is used for deriving
the class spectra. Weights are computed using spectral similarity and Euclidean distance in
each window. Afterwards, each class spectra are derived from unmixing results via Kmeans
clustering algorithm.

Reconstructing of urban reflectance
If the classes’ spectra and fractions of one mixed pixel are available, it is possible to
reconstruct the spectra of that mixed pixel through the linear spectral mixture equation.
Validation
The mixed pixels that were not employed in determination of class spectra were used for
validation. The validity of the proposed method was substantiated through comparison of
original mixed pixel to the reconstructed mixed pixel.
The quantitative assessment was conducted applying the standard root-mean-square-error
(RMSE) distortion metric and relative error (R_Error), using 4 bands for each
reconstructed MI pixel (equation (8), (9) and (10)). Finally, we computed the mean
RMSE, mean R_Error and mean NCC for the whole reconstructed MI image.


Study area
The test area is located in the Qods city, in the south west of Tehran, Iran. An IKONOS
MS and Pandata with 4m and 1m spatial resolution were available over this area (fig.2).
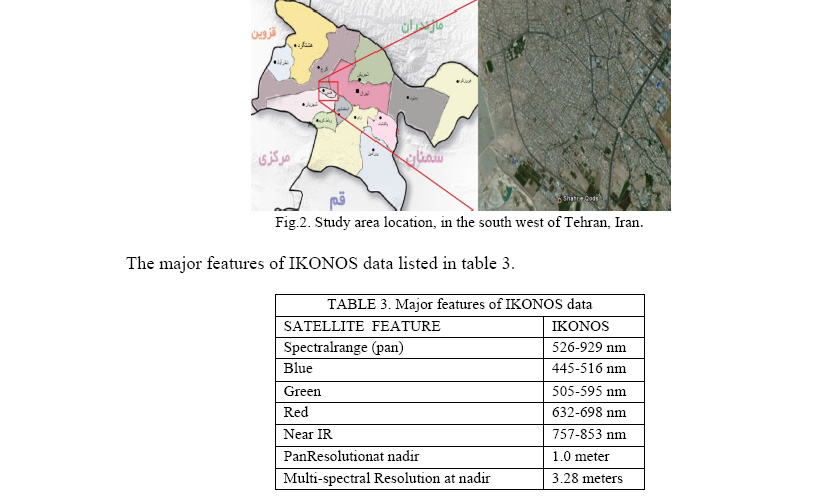
Fig.2. Study area location, in the south west of Tehran, Iran.
Results
In this study, a subset of 30*30 pixels was selected and divided into two parts (fig.3).
Determination of class spectra was achieved by inverted linear spectral mixture in part I.
Part II was used for validation.
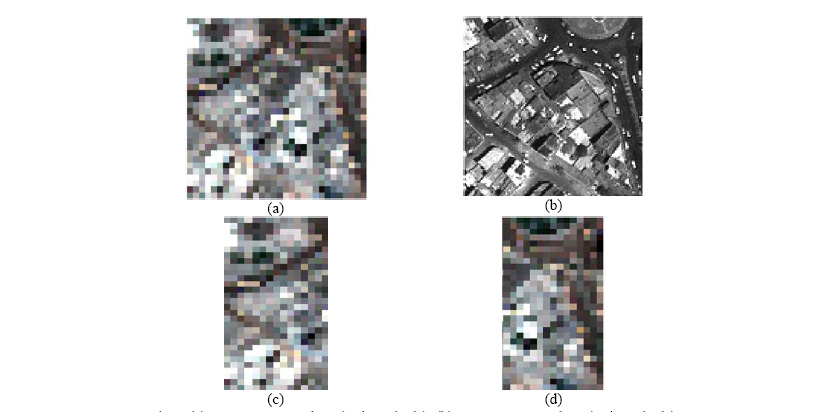
Fig.3. (a) IKONOS MS subset (30*30 pixels). (b) IKONOS Pan subset (30*30 pixels).
(c) IKONOS MS subset I (15*30 pixels). (d) IKONOS MS subset II (15*30 pixels)
The original spectral reflectance image and reconstructed spectral reflectance image for
the part II using the surface spectral reflectance obtained form part I are shown in Fig.4.

Fig .4. (a) Originalimage. (b) Reconstructed image
Table 4 presents the minimum, maximum and mean of RMSE, Relative Error and mean of
NCC between reconstructed values of the spectral reflectance using all 450 IKONOS
pixels.The mean RMSE of the image was 0.013, and the mean Relative Error was 2.76%
indicating a good overall estimation.
Distributions of errors in the reconstructed image are depicted in fig.5.The lighter gray
tones indicate higher error within the 4-m pixel, whereas the darker gray tones indicate
lower error.It can be seen infig.5, the maximum errors are occurred in the edge pixels,
because MMT has been appliedusing moving window.

Fig.5. (a) RMSE scatter image.(b) R_Error scatter image.
Conclusions
In this paper, a new approach to estimate the spectral reflectance of the land cover in urban
environments has been proposed. Producing surface spectral reflectance in 4 meters spatial
resolution image data was successfully implemented and tested.Tests were performed
using IKONOS image data. The assessment of the estimated values for the spectral
reflectance was evaluated by comparing the original mixed pixel to the reconstructed one.
Although this methodology was tested using IKONOS MS and Pan data, it can be applied
to any two sets of image data.
Output of this approach can be used to identify land covers, developing a spectral library of
urban material, investigating the effect of urban air pollution on remote sensing data,
exploring the parameters affecting urban reflectance changes and energy flows.
Limitations of this approachare the number of classes and their separability, unmixing
capability and window size.
References
Bowker, D. E., & Davis, R. E. (1985). Spectral Reflectances of Natural Targets for Use in
Remote Sensing Studies. NASA Reference Publication 1139.
Busetto, L., Meroni, M., & Colombo, R. (2008). Combining medium and coarse spatial
resolution satellite data to improve the estimation of sub-pixel NDVI time series. Remote
Sensing of Environment 112 , 118–131.
F. Haertel, V., & Edemir Shimabukuro, Y. (2005). Spectral Linear Mixing Model in Low
Spatial Resolution Image Data. IEEE TRANSACTIONS ON GEOSCIENCE AND
REMOTE SENSING , 2555-2562.
Herold, M., & Scepan, J. (2002). Object-oriented mapping and analysis of urban land
use/cover using IKONOS data. 22nd EARSEL Symposium “Geoinformation for Europeanwide
integration. Prague.
Mezned, N., & abdeljaoued, s. (2009). Unmixing Based Landsat ETM+ and ASTER
Image Fusion For Hybrid Multispectral Image Analysis. Advances In Geoscience and
Remote Sensing , 407-418.
Small, c. (2003). High spatial resolution spectral mixture analysis of urban reflectance.
Remote Sensing of Environment 88 , 170–186.
Taylor, M. (2005). KONOS Radiometric Calibration and Performance after 5 Years on
Orbit. Proceedings of CALCON 2005 Conference. Logan, Utah.
Zeng, Y., E. Schaepman, M., & Wu, B. (2007). USING LINEAR SPECTRAL
UNMIXING OF HIGH SPATIAL RESOLUTION AND HYPERSPECTRAL DATA
FOR GEOMETRIC-OPTICAL MODELLING.
Zhukov, B., Oertel, D., Lanzl, F., & Reinhackel, G. (1999). Unmixing-Based Multisensor
Multiresolution Image Fusion. IEEE TRANSACTIONS ON GEOSCIENCE AND REMOTE
SENSING , 1212-1226.
Zurita Milla, R., Guillen-Climent, M., & Clevers, J. UNMIXING-BASED LANDSAT
AND MERIS IMAGE FUSION FOR LAND COVER MAPPING OVER THE
NETHERLANDS. Commission VII, WG VII/6.
Zurita-Milla, R., Kaiser, G., Clevers, J., & Schneider, W. (2009). Downscaling time series
of MERIS full resolution data to monitor vegetation seasonal dynamics. Remote Sensing
of Environment 113 , 1874–1885. |


 (No Ratings Yet)



Leave your response!