| Navigation | |
Egocentric leisure boat navigation in a smartphone based Augmented Reality application
In this study, we tested a smartphone based safety app for leisure mariners. The app worked in two modes: the “turned off” phone would give an alarm in the navigator’s pocket 30 seconds before the boat “grounded” (entered into dangerous waters) |
 |
|
 |
|
The number of people killed in pleasure craft accidents in Norway has been relatively stable for the last 10 years ranging between 38 and 24. In 2015 the number was 37 and in 2016, 27 (Berntsen, 2017). The reduction in deaths by 2016 could be the result of the mandatory requirement to use a life jacket in small boats less than 8 meters by May 2015. The majority of these accidents happened in confined coastal waters among the around 50 000 islands along the Norwegian coast. Around 20 percent of these accidents with a deathly outcome were caused by groundings (Berntsen, 2017). The presented statistics on deadly accidents hides a much larger amount of accidents where nobody was killed but which still involved hull damage. The Norwegian Society for Sea Rescue in august 2017 published statistics on the number of groundings in the county of Ostfold (south-east of Oslo). 223 leisure boats had to be towed off rocks in Norway by the Sea Rescue Society between January and August 2017 (Norwegian Society for Sea Rescue, 2017). A survey by a Norwegian insurance company revealed that 40 % of leisure mariners in a county in middle Norway could not read a nautical chart (Hitra-Froya, 2016).
Background
In 2008 the main author participated in a conference about safety of leisure crafts in Oslo. During a session a representative of a Norwegian pleasure craft organisation said something in the line of “what boat people want is not complicated chart machines, but a simple black box in the pocket which sounds an alarm 30 seconds before they run aground”. There was much laughter and nobody really took it seriously. However, this remark lingered in the background in the continued work on ways of making navigation methods, more intuitive, more robust to stress, inexperience and lack of training, both for amateurs and professionals. Much of the work concentrated on what we call cognitive off-loading.
Cognitive off-loading
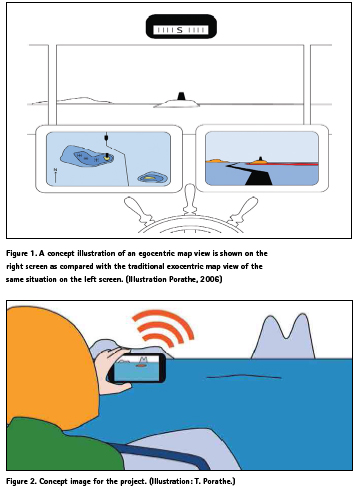
We humans view and act in our awake life from the egocentric perspective of our eyes. Maps, however, are depicted from an exocentric birds-eye perspective. Navigation is much about translating own position and intended course from the map perspective to the real world. The projection change that needs to be done on the fly in the head are called mental rotation and are both error prune and cognitively demanding (Porathe, 2006). One way of facilitating navigation would be to let the map system conduct this change in projection, presenting the map in an immediately useful egocentric 3D-view (see Fig. 1).
Porathe (2006) showed that the wayshowing task of navigation was more effective (higher speed and less errors) using egocentric view maps. At the same time, the traditional exocentric perspective was better for e.g. route planning and tasks requiring overview.
3D and Augmented Reality maps
The original suggestion by Porathe (2006) was to add new information to the map data base (terrain elevation, conspicuous buildings, etc.) and then allow the map system to seamlessly change between egocentric and orthographic exocentric views according to the users needs. However another way of achieving a simplified egocentric view would be to add chart information in an augmented reality (AR) layer on top of the camera image in an ordinary smart phone available by almost every people today. Augmented Reality (AR) or Mixed Reality (MR) are when computer generated imagery, georeferenced or not, are placed on top of a real world view in e.g. head-up or head-mounted displays, but also in cameras and touch pads.
Method
In October 2016 the SikkerKurs-project started with a budget of 1.5 million Norwegian crowns financed by the Norwegian Coastal Administration (Kystverket) and Geomatics NORWAY AS. The purpose was to develop an AR application for ordinary smartphones to increase safety and possibly decrease the number of groundings by leisure boats in Norwegian waters. The project was a proof-of-concept demonstrator, coordinated by Geomatics Norway AS. The design was done by professor Thomas Porathe from the Norwegian University of Science and Technology (NTNU) in Trondheim and technical implementation was conducted by Combitech AB in Linkoping, Sweden. Other partners in the project was the Norwegian Hydrographic Office (Kartverket) and the Norwegian Maritime Authority (Sjofartsdirektoratet). It was decided that the project would use the Human-Centred Design process (HCD) in ISO 9241 (ISO, 2015) and IMO’s guideline on HCD (IMO, 2015).
The human-centred design process
The point of HCD is to ensure userdriven development and a good usability by including the end users early in the process and keep them involved during the whole design. This is done in an iterative process with four steps: 1) Understand the context of use by field studies and interviews with the users, 2) specify the user and organizational requirements, 3) produce a design solution, this will be the prototype and 4) evaluate the design against requirements. Here the prototype is tested on the end users. The findings are then brought into a new iteration of the design process resulting in a new, improved prototype. The process is the iterated until the application meets the requirements.
Test area
Before a user group could be recruited, a location had to be decided. One way would be to look for an area with much leisure boat traffic. However, the availability of detailed, bathymetry and chart data was a precondition. The Hydrographic Office offered an area in Sore Sunnmore, a district south of Aalesund on the Norwegian west coast which had been declassified and could be used. A central municipality in this area was Ulsteinvik, which was to become the centre of the project.
Recruiting a user group
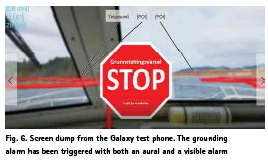
We needed to come in contact with local leisure boat mariners to recruit the user group. A mail was sent out to 30 pleasure craft clubs in the district telling about the project and asking about participation in development and testing of the application. The concept image in Figure 2 was included to illustrate the idea.
Only six boaters responded, all male, all relatively experienced and with an age of 60+. Although we had hoped for a larger user group with mixed ages, gender and experience, this was the user group we had to start with.
Understand the context of use and user requirements
A first focus group meeting was held in Ulsteinvik in January 2017. The users were interviewed about their experience with leisure craft navigation and the proposed concept with using a smartphone as a mean of preventing groundings was discussed. The group concluded that idea was very interesting and that there was a need for a safety devise alarming if the boat was approaching unsafe depths. The group agreed on a prioritized list with different possible features:
Alarm
The phone should sound an alarm a configurable time before the boat went aground. The application should be atomically started in the background when a boater steps into his boat, so that he or she does not forget to start the application. The time should be short so that the number of false alarms in narrow archipelagos would not be annoying and thus making boaters turn off the alarm (which often is the case with the lookahead- sector in professional shipping).
The default setting was agreed to 30 seconds, and the procedure of the boater should be to immediately stop the boat on alarm. The alarm should be silenced by picking up the phone and clicking the warning icon shown. The alarm should also be silenced by slowing down to a configurable maximum speed (default 3 knots) to allow boats to make landfalls or approach a jetty without getting an alarm.
NoGo areas
When the phone is picked up and the alarm silenced, the screen should show “NoGo Areas” in red over layered on the camera image. These NoGo areas are the polygon inside a configurable depth curve. Default should be the 3 meters curve, but ideally, any depth could be picked passed on the current draft of the boat, plus a safety margin. Ideally, the depth should also be compensated for the current tidal situation based on tide tables or real-time tide gauges. The user should be able to see these NoGo areas all around by pointing the smartphone camera.

Landmark names
Conspicuous landmarks around the boat should be named by overlaying text on the camera image. Examples of such conspicuous landmarks could be names of islands, shoals, beacons and mountaintops (the area is very mountainous). Much time is spent onboard a small craft trying to find buoys and beacons. An overlaid pointer should show their position to aid visual search. To avoid cluttering the names and pointers could be toggled on and off by tilting the camera (slightly up turns text on and vice versa).
Air draught
An alarm similar to the grounding alarm could be configured for sailing boats with a mast height that is higher that the span of bridges and power lines.
Fairways and planned routes
Official fairways should be shown as a “carpet” rolled out on the water in the camera image. Also, individual routes planned in a chart program and imported into the phone might be shown. This feature must be able to be turned on and off to avoid cluttering. This requirement was later dropped for the tested prototype due to time constraints.
Technical prototype development
After the meeting with the user group the discussions started about the technical implementation and what could be achievable within the time and budget available. Of the five prioritized solutions suggested by the user group the first four was selected for development.
The android platform
We decided to make the test implementation on the Android platform because Combitech had earlier experience from this platform, had available equipment and the relative ease with which test implementations could be distributed without passing thought e.g. the AppStore (for the iOS), thus giving us a quicker development cycle.
NoGo areas and alarm execution
Part of an Electronic Nautical Chart (ENC) was imported into a database in the phone’s memory. From the ENC only the polygons making up the area with a water depth of less than three meters at chart datum was kept. These polygons made up the “NoGo Area” that was used to alarm the navigator for grounding. Ideally, we would have NoGo polygons for every centimetre, which could be turned on and off depending on the set draught of the boat and the tidal situation. However, this would require large memory storage or a constant online connection so we decided to have just one NoGo depth: 3 meters for the test. The Norwegian Hydrographic Office delivered the necessary depth curve on a high-resolution horizontal grid of 1 meter. The internal map would consist of this area of water depths between 3 meters and the beach line.
The timed alarm function was implemented using a vector extending from the present position in the direction of the current course. The length of the vector was dependent on the speed and the alarm time set. In the default setting the alarm was set to be triggered 30 seconds before the boat “grounded” (passed over the boarder of the 3 meters NoGo area). With 10 knots the length of the vector would be (10 knots * (1852 metres / 3600 seconds) * 30 seconds) =154 meters. The length and direction of the course-speed vector was calculated from recent GPS positions. The precision was dependant on the position rate the phone could muster, which in general was one position per secound or less. The alarm would be triggered when a course-speed vector intersected with a NoGo area polygon.
The air draught alarm was treated the same way using the same course speed vector intersecting a safety rectangle extending 15 meters on both sides of bridges and power lines. The set mast height would then be compared against the maximum air draught allowed as stated as an attribute to the safety rectangle. In the test area there was only one power line and no bridges.
The augmented reality layer
The NoGo area polygon map were to be shown on top of camera image at the correct position. The polygons should apparently be “floating” on the surface of the water. In order to do this the map had to be georeferenced and projected using a virtual camera positioned in the virtual space as the real camera was in the real space. This projection is a standard VR operation conducted in real-time taking the virtual cameras height over the water (pre-set to 2 meters), direction (from the phones compass) and field of view (pre-set to match the device’s camera) as in-parameters. In order to keep computation time low and not to clutter the display a maximum visibility of the NoGo areas was set initially to 2000 meters by the means of a clipping plane.
The course-speed vector was also made visible and projected into the camera view; white when not in alarm mode but switching to red when an intersection had taken place and the alarm was triggered. It was then red as long as it was intersecting with the NoGo polygons. This visualising the alarm state, also when the aural alarm was silenced. The initial intersection point was shown by an arrow.
The stability and precision of the GPS positions and the compass heading from the internal phone sensors was an area of concern. The course-speed vector triggering the alarm was created by extrapolating present course and speed into the future. Low-pass filters were applied to these values to avoid large jumps due to unstable GPS fixes. This was done to reduce the risk of false collision alarms. The point of view in the polygon map was also dependant on the GPS based present position, but the direction of the camera (which was independent from the coursespeed vector of the boat) was relying on a compass direction from the phones internal magnetic compass. We had little experience of the precision of these two sensors, which might also be dependent on local conditions in the area for the test. However to anticipate possible problems with the compass we made it possible to shut down this sensor and use the course speed vector as direction for the virtual camera in the augmented reality layer, assuming that the camera was fixed in a forward looking manner (e.g. on the windscreen).
The only text based information we considered we had time and resources to implement was the pointers for navigational marks. The position of all buoys and marks in the test area was collected in a list. We did not succeed in populating the list with all the marker names in time, why these markers in the tests prototype mostly showed “POI” for point of interest.
Results and discussion
The first iteration of the prototype was tested during a technical test in Ulsteinvik with two from the user group on 8 May 2016. The full user test was conducted a month later on 14 June.
Technical test
For the technical test in May a reasonable difficult, 5.8 nautical miles long track was dawn in an electronic nautical chart (see Figure 3). This track could be negotiated in a little more than an hour at a moderate speed of 5 knots speed (not to take any risks should the prototype prove unreliable).
For the test, we used a 7-meter long leisure boat owned by one of the users. He had also very good local knowledge, which would be a safety barrier against unintentional grounding should the prototype fail. The boat was also equipped with a stationary chart plotter which was used as a reference system (see Figure 4).
The prototype software was tested on two phones, one Samsung Galaxy S7 and one Lenovo Phab 2 Pro. We found no differences in behaviour between the two phones tested and the test prototype worked to the largest extent as expected. Some problems with fluctuating AR layer is described below.
User test
The final user test was held in Ulsteinvik the 14 June 2017. The same test track as in May was used and all six of the original users was present on the 15 meters long M/S Legona used during these tests. The boat made the passage in about 5 knots speed in just over a hour and the prototype was tested on the two phone types mentioned above. Below are the results of this user test.
Alarm execution
When the course-speed vector intersected the alarm was triggered, both while the phone was turned off in the pocket, or (as in Figures 5 and 6) when the phone was used to actively monitor the water ahead of the boat. By touching the stop sign, the alarm is acknowledged and silenced and the stop sign disappeared. However, the vector remain red as long as it was intersecting a NoGo area. This feature worked perfectly as designed and the comments from all the users were very positive.
NoGo areas
The augmented reality layer was projected over the camera image based on a virtual camera positioned by latitude and longitude from the phones GPS sensor and the virtual cameras direction was based on input from the phones internal magnetic compass. Both these sensors had fluctuations as opposed to the camera image which of course moved only when the phone moved. This resulted in smaller or lager fluctuations of the AR layer over the camera image. The AR layer with the NoGo areas, coursespeed vector and POI pointers would float or jump in the image, mostly in the horizontal plane. These fluctuations would be more or less bad depending on the factors like if the camera was being panned by the user, and/or magnetic disturbances in the boat or in the area. The sensitivity to magnetic disturbances is illustrated by this example: One phone tested had a leather cover that could be closed over the screen with a magnetic lock. This lock jammed the compass causing the AR layer become unreliable.
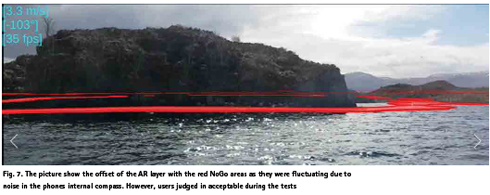
The fluctuating AR layer was the one disappointment in an otherwise successful test. Ideally, the layer with its added information should be steady and “glued” to the camera image, as it now where it jumped or sailed some 5-10 degrees to either side of its intended position. However, the user group though it was still within reasonable limits because the beach line of islands in the camera image and in the NoGo areas was usually easy to detect and pair together so that the fluctuations became like a visual expression for some kind of uncertainty. In Figure 7 an offset to the right and slightly up can be seen. The beach line of the island and the front beach line in the inner hole of the red NoGo areas match. Note also that we got the NoGo areas behind the island visible as an artefact. They could theoretically be clipped by an invisible 3D-model of the terrain in some future version where we could also show this virtual terrain during darkness and fog.
However, the most important thing was that the triggering of the grounding alarm function was not affected by the fluctuations due to the magnetic compass. The alarm computation was done entirely in the map layer using the relatively more stable GPS position.
Survey
After the test voyage and a short debriefing, the six users answered some questions in a small survey. The first question was whether they thought that the tested prototype could have any favourable effect on boat navigation. On a scale from 0-100, where 0 was “no favourable effect” and 100 “large favourable effect” they where asked to indicate their answer with a cross. The mean result of all six users was 83. Close to “large favourable effect”.
The second question dealt with the usability of the prototype application. On the same type of scale from 0-100, where 0 was “simple to use” and 100 was “difficult to use”, they were asked to mark their answer with a cross. The mean result from the six users was 13, clearly on the “simple to use side”.
They were also asked to comment on the prototype and asked if they missed any functions. Three answered “no”; one gave no answer; and the remaining two made these comments: “The matching between the AR layer and the camera image could be better”, “AIS data could be added”, “Some adjustments and it will be fine”, “Get it out as soon as you can, new versions can come later.”
During a concurrent TV interview one of the user commented on the alarm function: “I am often out sailing in my boat and when tacking we often want to use the water between the islands as much as possible, and then often go close to land. If we could get an alarm by a busser in the pocket instead of having to constantly look on our navigator screen, that would be great.”
The users were also asked about the likelihood that they would use such an app if it was 1) free, 2) costed the equivalent of £2.5 and 3) £25. On the same scale from 0-100 the answered that the likelihood was 1) 95, 2) 94 and 3) 82. Which translates to a high willingness to pay a reasonable amount for such a safety app.
Conclusion
In this study, we tested a simple, smartphone based safety application for leisure boaters. Leisure boaters often has a limited knowledge of navigation according to accident statistics and the application was designed to be easy to use and understand without prior navigation knowledge. It worked in two ways: 1) In a “turned off” mode in the pocket the phone would give an alarm 30 seconds before the boat entered into “dangerous waters” (depth less than 3 meters).
The boat owner was then expected to immediately stop the boat. 2) Picking up the phone, the owner could look through the application’s camera view and see red “NoGo Area” polygons overlaid on the camera image. By looking around he or she could then detect navigable water and continue the voyage.
The application contained a high-resolution map of the 3 meter depth curve extracted from a nautical chart. This map was then projected on the camera image “egocentric view” of the surroundings, thus bypassing the potentially cumbersome mental rotations a human navigator has to do when comparing a traditional exocentric map with the world around. This will facilitate use by unexperienced boaters.
The application was tested on small group of six Norwegian, all male, all experienced, leisure craft mariners. The size and configuration of the test group limits the generalizability of the results, but the group was highly positive to the tested prototype, which encourages us to continue this work.
Future work includes adding some limited features asked for by the user group while still maintaining a simple and easy to use app. The most prominent new feature will be the ability to import a pre-planned route from a nautical chart application (or an official route from the Coastal Administration) and show this route in the AR layer overlaid in the camera image, thus not only showing dangers to navigation but also offer way-showing.
Financial support. This work was supported by the Norwegian Coastal Administration (Kystverket) and Geomatics Norway AS.
Conflicts of interests. None
Ethical standards. The authors assert that all procedures contributing to this work comply with the ethical standards of the relevant national and institutional committees on human experimentation and with the Helsinki Declaration of 1975, as revised in 2008.”
References
Berntsen, V. (2017). Dødsulykker Fritidsfartøy. The 2017 Leisure Boat Conference. Sjøfartsdirektoratet, https://www.sjofartsdir.no/ globalassets/sjofartsdirektoratet/ fartoy-og-sjofolk—dokumenter/ fritidsbatkonferansen/2017/04_vegarberntsen_ ulykkestall-i-aret-somhar- gatt.pdf?t=1508936419997. Accessed 9 November 2017.
Hitra-Froya (2016). http://www.hitrafroya. no/nyheter/2016/07/30/Nygrunnst% C3%B8ting-i-dag-13110445. ece. Accessed 9 November 2017.
IMO, International Maritime Organization. (2015). Guideline on Software Quality Assurance and Human-Centred Design for e-Navigation. MSC.1/Circ.1512.
ISO, International Organization for Standardization (2015). https:// www.iso.org/standard/52075.html Accessed 26 October 2017.
Norwegian Maritime Authority, Sjøfartsdirektoratet (2017). Notat: Fritidsbåtstatistikk 2016. Arkiv 2017/8141-1.
Norwegian Society for Sea Rescue. (2017). Østfoldinger går oftest på grunn. https://www.ntbinfo. no/pressemelding/ostfoldingergar- oftest-pa-grunn?publisherI d=89422&releaseId=15715694 Accessed 25 October 2017.
Porathe, T. (2006). 3-D Nautical Charts and Safe Navigation. Dissertation. Malardalen University Press. http:// www.diva-portal.org/smash/get/ diva2:120506/FULLTEXT01. pdfAn Accessed 25 October 2017. Accessed 9 November 2017.
Presented at the Royal Institute of Navigation’s International Navigation Conference 2017, 27-30 November 2017 in Brighton, U.K. An extended version is published in the Journal of Navigation, 71 (6), Nov. 2018.


 (3 votes, average: 4.67 out of 5)


Leave your response!