| Surveying | |
Detection of pest infestation area by visible bands vegetation indices
This study investigates the ability of different vegetation indices in detection of pest infestation area from UAV-RGB images |
 |
|
 |
|
Paddy is the third largest crop planted in Malaysia after oil palm and rubber. According to Paddy Statistics of Malaysia 2014 reported by Malaysian Department of Agriculture, nearly 679 239 hectares of land planted with paddy in Malaysia. There are certain agencies responsible for every cultivation area. These agencies manage the area from every aspect such as irrigation scheme, seeds selection, facilities development, pest and disease management, etc. Much research and attempts have been done in order to get an optimum yield and high quality of paddy in Malaysia, and efforts are ongoing.
However, due to the fact that almost every part of the plant can be consumed by pests at every stages of its growth, paddy field always being a target for various pests. This might reduce the quality and quantity of the yield. While pest control is one of the most critical operations in agriculture, farmers usually practice the traditional method of regular schedule based spraying even without any presence of pest in the field.
These chemicals kill useful insects which eradicate pests in crops (Johnny et al, 2014). In addition to that, chemicals are one of the main costs in agriculture activity. Regular spraying of pesticides might increase the cost of operation, including the cost of running the machinery and labor.
The idea of using remote sensing to determine pest infestation is to help detect the exact locationof infested areas. Rather than regular spraying, applying the pesticide at the right time, in the right spot with an optimum amount necessary to control the pest is another option that needs to be consider. To identify the type of pest infestation and determine the most effective and efficient way to control them is important. By using images taken from space, the exact spots of infestation can be detected. There are quite a number of researches done by using different means of remote sensing data and analysis.
However, the challenge is to use the most suitable means that convenient to the users from every aspect such as cost, area of field and availability of technology is important.Research on processing and analysing vegetation and spectral indices are widely done by using Near Infrared band and has useful results. However, installing near infrared sensor on UAV sensing is not so cost effective for small scale analysis.
This study investigates the ability of eight different vegetation indices in detection of Brown Plant Hopper’s infestation area from UAV-RGB images.Four common visible bands vegetation indices were used and another four indices used are developed from manipulation and enhancement from the common indices.
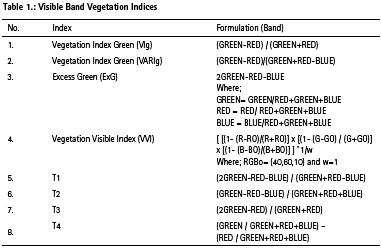
The indices used are Vegetation Index Green (VIg), Vegetation Index Green (VARIg), Excess Green (ExG), Vegetation Visible Index (VVI), T1, T2, T3, and T4 where all of them are based on greenness where green area would yield higher index value than others. Thus, areas that have been injured by BPH will have lower index value than the areas not infested due to the hopper burn.
Materials and methods
UAV-RGB images
A field trip was done to fly the UAV at the study area and RGB images taken. A hexacopter UAV and Mission Planner Software was used for the work. Images were in Tagged Image File Format (TIFF) with a correct coordinate of the location as they have been georeferenced by the Department of Agriculture Kuala Lumpur.
Table data acquisitions is shown in Table 1. The pest infestation areas in the images were confirmed by an officer from the Department of Agricultural Kuala Lumpur.
Study site
There are three different UAV images. The first study site is at a paddy field in Kampung Sungai Leman, Sekinchan. This area is located in Selangor and placed under Tanjung Karang irrigation Scheme area in Selangor. The other two images were obtained from Plant Biosecurity Division of Department of Agriculture, Kuala Lumpur. One of these images was acquired at FELCRA Kerian in Perak state and another one at Parit Haji Ali, Perak. There is only one lot for both sites in Sekinchan and Parit Haji Ali respectively, while there are 14 lots involved in the FELCRA study plot
All of these three sites practice similar activity that is paddy cultivation. Paddy was cultivated on these sites due to the suitability of the soil, weather, facilities and irrigation system.
UAV image pre-processing
Some basic pre-processing techniques were done for this study including mosaicking,georeferencing and clipping. All the steps of building an orthoimage from UAV images are processed by using AgisoftPhotoScan Professional and saved in the format of TIFF.Georeferencing the image enable in determination of exact location of the image. The image was georeferenced by using Georeference function in QGIS by inserting reference coordinate to four different points of the image. The projection use for the image is WGS 1984 UTM 47 N.The orthoimage not only covered the area of study but also some other features. As this study focus on paddy, the image clipping is needed to ensure the vegetation indices calculated for only the paddy feature in the study area is calculated. Calculating the whole image would affect the calculation as vegetation indices calculated based on average area.
The images were clipped by using Raster Clip function in QGIS.
Application of Vegetation Indices
The indices used visible bands (Blue, Green, and Red) as the orthoimage is in visible bands. Four common indices were used while another four indices are computed especially for this study to test and compare the performance and capability. All the listed Vegetation Indies with formulation used in this study are listed in Table 1. The equations of each index are different hence, the computed result should be different as the reflectance value for each bands is different. As all indices used are based on greenness, the main concept is to eliminate other reflectance values from Green reflectance. The same concept is used for the four Testing Indices. These indices formulated by manipulation and enhancement of the common indices. T1 is an index inspired by ExG with manipulation of normalization equation while T2 was inspired by VARIg index with addition of Blue reflectance value to be subtracted from Green and to be added for normalization equation.
T3 and T4 indices both inspired from VIg index. The index computations were done by using Raster Calculation tool in QGIS. This tool basically calculates the single value of indices by running the formulation and convert multiband raster to single band vegetation indices.
Image analysis
The image produced were analysed visually and statistically. From visual, the colour contrast of the images was compared for all index images. Analysis was done by computing statistical data of every single band vegetation indices raster. The min, max, mean and standard deviation of each raster were tabulated and graph of statistical distribution was plotted. The values were then compared in order to conclude the stability, performance and capability of the index in the detection of infestation area by brown plant hopper.
Result and discussion
Visual comparisons of vegetation indices images
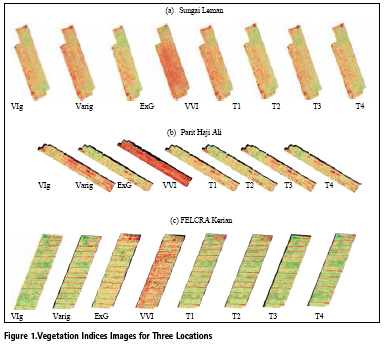
The vegetation indices have been computed on three different images with different locations and sizes. The algorithm converted multiband raster image into a single band raster image. The results are in colour gradient that emphasise the value of index where greener area has bigger index values and vice versa as shown in Figure 1 (a),(b), and (c).
By visualizing the output, it can be concluded that some indices were able to show greenness by showing obvious colour contrast while some were not. The original images were in monochrome where the gradient is from black to white. Images shows colour gradient from green to red where dark green shows high index value and red is for low index value. When paddy is infested by pest, the plant will usually die or suffer some distortion. The leaves will not be as green as the healthy and noninfested plant and in most serious cases the leaves will be in brown, red or white colour. This is where these indices are practical as the infested area will have low index value as they have lower green reflectance value. The images where compared to the original RGB images to validate the exact location of the infested areas.
From the four common indices, the images that produc most colour contrast are the VIg index. This index was able to shows green area more than the others. However, the infested area does not really contra in the images by VIg compared to the images produce by ExG index. ExG index was able to shows the infested area more clearly than the other indices. The formula of ExG where the green band reflectance intensity is doubled before subtracting the other bands reflectance intensity values is the factor of the results.
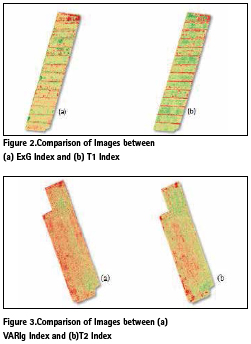
From the testing indices, T1,T2, T3, and T4, index that produce the most contrast image in termsof greenness index T1 while the index that was able to show the most contrast in terms of infested area was index T2. T1 is the manipulation of ExG index’s formula by changing the normalization equation. Figure 2 shows the comparison between images of ExG index and T1 index at FELCRA Kerian. It can be seen in the Figure 2 the images of ExG and T1 index is about the same, only in T1 the greenness are greater contrast.
T2 index is the manipulation of VARIg index. Instead of only subtracting Red intensity values from Green values, the Blue band intensity values was also subtracted. Figure 3 shows the comparison between images of T2 index and VARIg index at Sungai Leman. From the figure, T2 index image shows more contrast in greenness and infested area compared to VARIg index image.
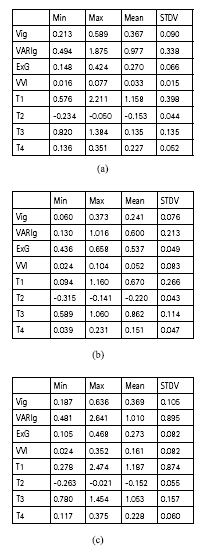
Image analysis
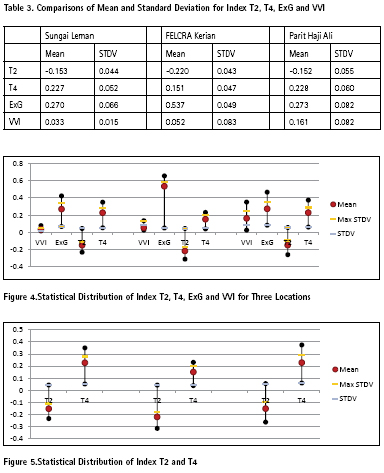
The statistical distribution of the images varies not only when compared to different vegetation indices but also varies when comparing the same indices for different locations (Table 2).
For Sungai Leman, the three indices that have the smallest standard deviation are VVI, T2 and T4 indices with the range of 0.015-0.052 which is the closest to 0 and also a very small mean different. Small standard deviation shows that the data points are very close to the mean value or the expected value. It’s different for data from FELCRA Kerian and Parit Haji Ali Vegetation Indices images. The indices that have the lowest standard deviation are T2, T4 and ExG with the range of 0.043 – 0.082.
Indicies T2, T4, ExG and VVI shows the smallest mean differences and standard deviations when compared to the others. The indices mean and standard deviations were compared in Table 3. The difference in means and standard deviations for T2 index is the smallest when compared with the other three indices. Another index that has a difference in mean and standard deviation values less than 0.1 is T4 index. Figure 4 shows the distribution comparison between the four indices within these study areas. The distribution of indices T2 and T4 seems more stable than the other two indices. The maximum and minimum values are almost the same for all three locations.
 s
s
T2 and T4 indices show most stability and reliability as they have the smallest value in standard deviation and smallest difference of mean values. By comparing statistical distribution for the three locations, the stability of the indices can be seen (Figure 5). Even though both indices show stability, T4 is more stable and reliable in the detection of Brown Plant Hopper infestation area in paddy fields in the study areas in Malaysia.
Conclusion
Indices T2 and T4 were able to show the infestation area clearly by producing images that have more colour contrast. A comparison between T2 and T4 indices showed both indices to have stability. However, T4 is more reliable due to smaller value of standard deviation. The research contributes the new index T4 to aid detection of paddy infestation using RGB images. This work will benefit the paddy cultivation industry.
Acknowledgement
The authors would like to thank to Plant Biosecurity Division Department of Agriculture, Kuala Lumpur for their willingness to share their data that helped in successful completion of this research. MOSTI Science Fund Research grant 06- 01-04-SF2371 is duly acknowledged.
References
Bokusheva, R., Kogan, F., Vitkovskaya, I., Conradt, S., &Batyrbayeva, M. (2016). Satellite-based vegetation health indices as a criteria for insuring against drought-related yield losses. Agricultural and Forest Meteorology, 220, 200–206. https://doi. org/10.1016/j.agrformet.2015.12.066
Dyck, V. A., Misra, B. C., Alam, S., Chen, C. N., Hsieh, C. Y., &Rejesus, R. S. (1979). Ecology of the brown planthopper in the tropics. International Rice Research Institute: Brown Planthopper: Threat to Rice Production in Asia., 61–98.
Hunt, E. R., Doraiswamy, P. C., McMurtrey, J. E., Daughtry, C. S. T., Perry, E. M., &Akhmedov, B. (2012). A visible band index for remote sensing leaf chlorophyll content at the Canopy scale. International Journal of Applied Earth Observation and Geoinformation, 21(1), 103–112. https://doi. org/10.1016/j.jag.2012.07.020
Motohka, T., Nasahara, K. N., Oguma, H., &Tsuchida, S. (2010). Applicability of Green-Red Vegetation Index for remote sensing of vegetation phenology. Remote Sensing, 2(10), 2369–2387. https://doi. org/10.3390/rs2102369
Mróz, M., &Sobieraj, A. (2004). Comparison of several vegetation indices calculated on the basis of a seasonal SPOT XS time series, and their suitability for land cover and agricultural crop identification. Technical Sciences, 7(7), 39–66. https://doi. org/10.1080/10106040608542399
Ponti, M. P. (2013). Segmentation of low-cost remote sensing images combining vegetation indices and mean shift. IEEE Geoscience and Remote Sensing Letters, 10(1), 67–70. https://doi.org/10.1109/ LGRS.2012.2193113
Rabatel, G., Gorretta, N., Labb, S., Rabatel, G., Gorretta, N., &Labb, S. (2011). Getting NDVI spectral bands from a single standard RGB digital camera : a methodological approach e To cite this version : Getting NDVI Spectral Bands from a Single Standard RGB Digital Camera : 14th Conference of the Spanish Association for Artificial Intelligence, 333–342. Retrieved from https://hal.archivesouvertes. fr/hal-00648439/document
Red, N. (2006). List of Vegetation Spectral Indices References Baret , F ., G . Guyot , and D . Major .1989 . TSAVI : a vegetation index which minimizes soil brightness effects on LAI and APAR estimation . 12 th Canadian Symposium on Remote Sensing and IGARSS ’ 90 , p . Remote Sensing of Environment, 1994–1996.
Reid, A. M., Chapman, W. K., Prescott, C. E., &Nijland, W. (2016). Using excess greenness and green chromatic coordinate colour indices from aerial images to assess lodgepole pine vigour, mortality and disease occurrence. Forest Ecology and Management, 374, 146–153. https://doi. org/10.1016/j.foreco.2016.05.006
Viña, A., Gitelson, A. A., Nguy- Robertson, A. L., &Peng, Y. (2011). Comparison of different vegetation indices for the remote assessment of green leaf area index of crops. Remote Sensing of Environment, 115(12), 3468–3478. https://doi. org/10.1016/j.rse.2011.08.010
Xu, Y., Ou, J., He, H., Zhang, X., & Mills, J. (2016). Mosaicking of Unmanned Aerial Vehicle imagery in the absence of camera poses. Remote Sensing, 8(3). https:// doi.org/10.3390/rs8030204
Yahyanejad, S. (2013). Orthorectified Mosaicking of Images from Small-scale Unmanned Aerial Vehicles DISSERTATION, (March 2013), 88.
Zheng, Y. L., Xu, L., Wu, J. C., Liu, J. L., &DuanMu, H. L. (2007). Time of occurrence of hopperburn symptom on rice following root and leaf cutting and fertilizer application with brown planthopper, Nilaparvatalugens (st??l) infestation. Crop Protection, 26(2), 66–72. https://doi. org/10.1016/j.cropro.2006.04.001
Li, P., Jiang, L., & Feng, Z. (2013). Cross-comparison of vegetation indices derived from landsat-7 enhanced thematic mapper plus (ETM+) and landsat-8 operational land imager (OLI) sensors. Remote Sensing, 6(1), 310–329. https:// doi.org/10.3390/rs6010310
The paper was presented at Asian Conference on Remote Sensing, Delhi, India October 23-27, 2017


 (No Ratings Yet)


Leave your response!