| Positioning | |
Crowd monitoring through WiFi Data
A methodology has been developed and tested using real data. The data were collected during the JRC Open Day 2016 by 20 WiFi access points deployed on the Ispra site |
 |
|
 |
|
 |
|
 |
|
The capability to monitor the gathering of crowds in restricted geographic areas is a key enabler for the development of safety and security measures. The knowledge of the people flows within streets, squares, neighbourhoods and buildings could help preventing critical concentrations in bottlenecks, supporting the deployment of emergency services staff and developing services for smart cities [1]. Besides, for common places of gathering such as parks or stadiums, this information would improve the positioning of commercial and customer targeted services.
There are various methods to estimate the number of presences in a given area:
1. physical counting in strategic points;
2. Jacob’s method based on the size of the area where the event is organized ( 2-4 peoples for squared meter) [2];
3. employment of automated systems.
To date, most of the crowd monitoring techniques rely on camera networks, satellite images, or mobile phones data [3]. The first two approaches are relatively expensive, require complex image processing [4] and are limited to daylight and visibility operations; while, the third method requires data from telecom providers and faces strong privacy constraints which limit its application [5].
In this paper, an approach based on WiFi data is proposed: stations belonging to a network collect WiFi-related data of mobile devices. A pilot has been recently developed by Transportation for London (TfL), which is currently limited on the collection of WiFi data [6], exploring main privacy issues.
Whenever the WiFi connectivity of a mobile device is active, the device periodically broadcasts probe requests to associate to a network. The probe request is a frame used to request information to the Access Point (AP); the request includes, among other information, the Media Access Control (MAC) address, which is a unique identifier of the device. All these records can be seen as a footprint: despite the owner of the footprint is unknown, by counting the different footprints one can estimate how many people passed by. In this way, mobile devices can be counted without encroaching on the privacy of their owners. A more detailed discussion about the privacy can be found in [7]. In those terms, the crowd monitoring seems quite simple. Yet a positioning algorithm, preceded by an ad hoc data cleaning, is required.
The approach introduced [7] was tested in occasion of the Open Day 2016 at the Joint Research Centre (JRC) Ispra site, in Italy [8]. During the event, 20 WiFi APs, spread within the perimeter of the site, recorded the presence of mobile devices; the collected data allowed the estimate of the number of visitors and their flow. The unique data set allows the validation of the results, which usually is a weak point of the big-data analysis. Specifically, the estimated number of visitors is compared to the data provided by the security service; whereas, the flow monitoring is validated through the schedule of the event.
The JRC open day experiment
The JRC Open Day 2016 in Ispra took place on Saturday the 28th of May. The event attracted about 8000 visitors. Thanks to its large area (167 hectares) and its restricted-access nature (only one controlled access for visitors), the event represented a unique test bench for the validation of the proposed crowd monitoring method.
Figure 1 shows the positions of the 20 devices within the site. Three main areas are identified with a different colour of the APs: the entrance (blue), the central part (yellow) and the exit (red). Among the blue stations, numbers 10 and 11 were positioned at the visitors’ entrance, whereas station 12 was placed in the proximity of the access reserved to volunteers. Device 16, in the upper-right part of the map, was positioned at the secondary entrance, which was active only for few hours and reserved to volunteers entrance. All the APs where activated before the opening of the event; some of them were previously activated and then positioned, as it can be seen from the results presented in section 4. The APs continuously recorded data during the entire event. Only few of them failed working during the day, without affecting the final result of the experiment.
Algorithm description
In this section, the algorithm developed to monitor people flow is described. The algorithm is divided in two phases namely Cleaning and Localization. The two phases are described in the following sections.

Cleaning procedure
If a WiFi network is deployed over a specific area, as in the 2016 JRC open day, the number of user in the area can be estimated as the number of unique MAC address connected to the network. However, such estimate can be a challenge because it is affected by three main problems: the presence of random generated MAC address [9], the inclusion of people that are not attending the event but are in the proximity of the APs and the inclusion of static devices (printers, PCs etc.). In order to mitigate such effects, two criteria to identify a “real user” are applied (see eq. 1). The first criterion is based on the minimum number of records (in our case 3) associated to a specific MAC address; this criterion allows the exclusion of random generated MAC address which are used by some manufacturers to verify the availability of WiFi networks; After this check such devices connect to the network using the real MAC. The second criterion considers the minimum number of stations where a specific user is recorded (the threshold used was 3, according to the topology of the deployed network); this criterion allows the exclusion of people seen only by a limited number of stations and also excludes static devices which are connected to a limited number of APs.
Localization In order to estimate the distribution of the people on the site, the location of the real users is required; the localization is attempted using an algorithm based on the centroid principle. The classical centroid algorithm computes the position of the user as the mean of the station coordinates at which the user is simultaneously connected. In our case, there was a limited overlapping of the station coverage, hence the classical centroid converges to the proximity solution. To overcome this limitation a modified Weighted Centroid (WeC) approach has been implemented. The position of the user is computed as the mean of the station coordinates at which the user is connected in a specified time interval (eq. 2) weighted by the Receiver Signal
Results
In this section, the main results are summarized: at first, the estimated number of presence is provided, then the distribution of presence during the event is computed. Moreover, statistics on the number of users recorded are provided; the concentration of people is disaggregated by stations and time.
The estimated number of users without applying any cleaning was some 50000, which is reduced to 7143 after the application of the criteria described in section 3.1. This number underestimates by some 6% the presences on the site, since the security office reported 7623 accesses during the entire event. Such a reasonable discrepancy can be attributed to the presence of children without any device and of users with WiFi connection turned off.
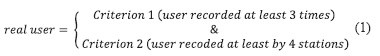
The number of real users disaggregated by hours is shown in Figure 2; from the figure it can be noted that the number of users slowly raised between 6:00 and 8:00, when only volunteers were allowed to enter. Then, between 9:00 and 12:00, there is a fast growth of the number of visitors which is compatible with the actual event schedule. In fact, in spite the opening was scheduled for 10:00, the security office decided for an early opening of the site at 9:00, facilitating the inflow of the people. Between 12:00 and 16:00, the number of people on site remained almost constant, registering only a small increase between 14:00 and 15:00, which is also confirmed by the security report. Finally, after 16:00, the total number of visitors started rapidly to decrease, confirming the fact that people were leaving when the closure of the event (scheduled at 17:30) was approaching.
In Figure 3, the estimated number of people entering the site using the proposed approach is compared with respect the number of people registered by the security service at the main gate. From the figure it appears that the number of people registered by the security (blue area) is similar to the estimate obtained using the proposed methodology (red area). Only in the first hour a significant difference can be appreciated, this phenomenon is probably due to the fact that between 8:00 and 9:00 only volunteers were allowed to enter the site and they were not registered by the security service. The maximum number of people entering the site was 57 form the official statistics of the security office ant it occurs at 10:00 approximately; whereas the proposed methodology estimated that the maximum number of people entering the site was 59 a bit before 11:00.
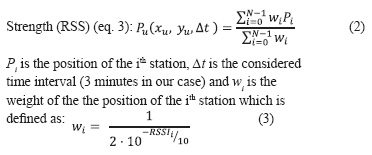
In order to analyze the distribution of the people on the site during the event, the total number of users recorded by each station is shown in Figure 4. From the figure, it can be noted how the minimum value (47 users) was registered by the AP located in the proximity of the secondary gate reserved to volunteers’ entrance, which remained open only for few hours. On the contrary, the highest number of users (i.e. 3949) was recorded by the station in the center of the site, which was located in the proximity of a bus stop. Moreover, the number of users recorded by close stations is very similar; for example, the difference between the number of users registered by two APs located on two side of the same block (stations 15 and 24) was only four.
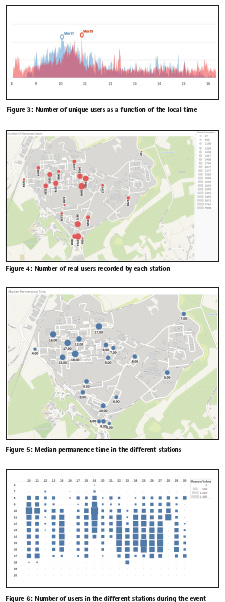
The median time spent by the users in each station is shown in Figure 5. The permanence time in the proximity of the entrance can be considered the time waiting to enter the site; it can be noted that volunteers (4 minutes) were faster in accessing the site than the general public (8 minutes). The time spent by the visitors in the proximity of the main exhibitions (stations 23, 25, 26, 27 and 29) ranges between 13 and 18 minutes.
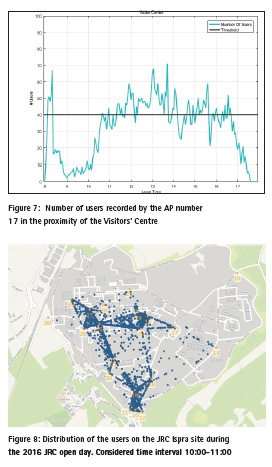
The number of real users, breakdown by hours and stations, is represented by the size of the squares in Figure 6. APs number 12, 16 and 19 were the only recording users before the opening of the site. Station 12 and 16 were in the proximity of the two gates reserved for the access of the volunteers, whereas AP 19 was located in the proximity of an exhibition which was installed very early in the morning. Station 10 and 11, located in the proximity of the visitor entrance, have a very similar behavior: the number of users increase in the first hours, then it decreases in the afternoon, to increase again around 17:00, when the event was officially closed and the gate was opened to allow the exits of volunteers. Finally, it can be noted that station 28 stopped working after 11:00.
In order to further demonstrate the effectiveness of the proposed approach, the flow of people in stands opened to a closed-number of participants (only 40 at time) is considered. Different groups of people entered he Visitors’ Centre (station 17) every 30-minutes, from 11:00 to 17:00. The time trend of the estimated number of users recorded by the AP in the proximity of the Visitors’ Centre is shown in Figure 7. The high consistency between the estimated number of real users and the schedule of the event clearly emerges. The peak at 8:30 correspond to the installation phase, when the staff was setting up the exhibition.
Finally, the distribution of the people on the site between 10:00 and 11:00 (after the official opening of the event) is shown in Figure 8. From the figure, the following conclusions can be deduced: the maximum concentration of people is recorded in the proximity of the main gate (stations 10, 11 and 12); a considerable number of users were already in the central part of the site, probably because of the early opening at 9:00; only few users were in the proximity of the exit area (between stations 26, 29 and 30); no presences were detected in proximity of station 16.
Conclusions
The research pointed out the feasibility of crowd monitoring through WiFi positioning. The huge amount of data gathered during the JRC Open Day 2016 by 20 WiFi access points deployed within the Ispra site were cleaned and processed to analyse people flow and estimate the number of participants to the event. The cleaning procedure allowed the identification of actual users among all the registered MAC addresses. Such cleaning was divided into two steps: exclusion of random generated MAC addresses (iOS based systems, etc.); exclusion of MAC addresses recorded only by a limited number of stations (people detected by the perimeter stations that did not entered the site and static devices). The data processing is basically a positioning procedure carried out through a modified WeC approach that exploits the RSS as waiting factor.
 s
s
The results of the experiment were compared with the report from the security service and with the actual schedule of the event, showing evident consistency. Although the data analysis was carried out off-line, the proposed method clearly adapts to a quasi-real time application, since only a small time interval is required for data cleaning and processing. Hence it fully fits needs of the deployment of emergency services staff and of the developing services for smart cities.
References
[1] P. Bellini, D. Cenni, P. Nesi, I. Paoli “Wi-Fi based city users’ behaviour analysis for smart city”, Journal of Visual Languages & Computing, Volume 42, 2017, pp 31-45.
[2] H. Jacobs “To count a crowd” 1967, Columbia Journalism Review, Volume 6, pp 36-40.
[3] Y. Yuan, “Crowd Monitoring Using Mobile Phones,” 2014 Sixth International Conference on Intelligent Human-Machine Systems and Cybernetics, Hangzhou, 2014, pp. 261-264.
[4] A.N. Marana, S.A. Velastin, L.F. Costa and R.A. Lotufo, “Estimation of crowd density using image processing”, IET Conference Proceedings, 1997, p. 11.
[5] European Commission, “EU Directive 95/46/ec – The Data Protection Directive,” tech. rep., European Commission, 2016.
[6] Transport for London (TfL) “WiFi data collection pilot” https://tfl.gov.uk/corporate/privacy-and-cookies/wifi-data-collection-pilot
[7] A. Alessandrini, C. Gioia, F. Sermi, I. Sofos, D. Tarchi and M. Vespe, “WiFi positioning and Big Data to monitor flows of people on a wide scale,” 2017 European Navigation Conference (ENC), Lausanne, 2017, pp. 322-328.
[8] https://ec.europa.eu/jrc/sites/jrcsh/files/jrc-ispra-openday-2016-map-programme_en.pdf
[9] M. Vanhoef, C. Matte, M Cunche, L.S. Cardoso and F. Piessens “Why MAC Address Randomization is not Enough: An Analysis of Wi-Fi Network Discovery Mechanisms” ACM Asia Conference on Computer and Communications Security, (ASIACCS 2016), 2016 China.


 (1 votes, average: 4.00 out of 5)


Leave your response!