| GIS | |
COVID-19 – Geo-spatial big data analysis
The impact of latitude on population mortality for countries situated at latitudes between 64°N and 35°S |
 |
|
 |
|
 |
|
The outbreak of the Covid-19 emerged from Wuhan, Hubei province of China, spread geo-spatially in more than 210 countries cau sing more than 25.416 million people of the global population infected and 0.851 million deaths (as on 30 August 2020), which is still exponentially spreading in geo-spatiotemporal way to the new geographical locations. The spread of covid-19 outbreak has seriously attacking societies at their core posing the human crisis, which is more than a global health crisis threatening the human health and life of the people. This unprecedented situation challenges to control the severity of the outbreak by creating a unique health response system to suppress the transmission of the virus to end the pandemic. There are marked variations in the spectrum of daily new cases of covid-19 between different countries that lie below latitudes 64°N, which resulted into six different stages of the spectrum of outbreak such as complete recoverable stage, recoverable stage, safe stage, stabilizing stage, critical stage and beyond the critical stage based on spatial big data analysis. People do not receive sufficient sunlight to retain adequate vitamin D levels during winter in countries situated at the latitude beyond 35°N. Vitamin D is important in preventing the cytokine storm and subsequent acute respiratory distress syndrome that is commonly the cause of mortality, suggesting the need to establish the correlation between vitamin D and the severity of the covid-19 outbreak. The global spreading of covid-19 caused marked variations in population mortality between different countries situated at different latitudes. This stressed the importance of geo-spatial big data analysis for determining the effect of latitude on population mortality from covid-19 and its variability for understanding the severity of the outbreak. In this paper, geo-spatial big data analysis has been carried out for determining the impact of latitude and the role of vitamin-D on population mortality for 52 countries situated between the latitude 64°N and 35°S, based on population mortality data from 15 April to 30 August 2020. This paper explains the variability factor of population mortality from 03 May to 30 August 2020 with respect to population mortality on 15 April 2020 for 52 countries situated between the latitude 64°N and 35°S for determining the severity of the covid-19 outbreak.
This study shows relatively lower population mortality for countries situated between the latitude 38°N and 35°S, whereas, countries that lie beyond 38°N shows relatively very high population mortality, confirming good correlation for different countries due to multiple peaks of population mortality observed. Further, this study shows relatively significant variability factor of population mortality for countries situated between the latitude 38°N and 35°S, whereas, countries situated beyond the latitude 38°N shows non-significant variability factor of population mortality. This paper explains very significant variability factor of population mortality observed for countries such as India, South Africa, Peru, Columbia, Mexico, Brazil, Saudi Arabia, Kuwait, Egypt, Russia and Ukraine from 03 May to 30 August 2020, whereas non-significant variability factor observed for countries such as Argentina, Indonesia, Singapore, Malaysia, Thailand, Philippines, Hong-Kong, Taiwan, Israel, Japan, Iran and South Korea.
Introduction
The outbreak of the 2019 novel coronavirus disease (Covid-19) spread geo-spatially in more than 210 countries of the globe causing more than 25.416 million people of the global population infected and 0.851 million deaths ( as on 30 August 2020). The exponential increase in spreading of corona virus spectrum in spatiotemporal way to the new geographical locations has seriously threatened the human health and life of the people as well as posed the challenges for countries to control the severity of the outbreak (BBC,2020; Coronavirus, 2020). This unprecedented situation challenges to control the severity of the outbreak by creating a unique health response system to suppress the transmission of the virus to end the pandemic. The spatial spreading of coronavirus spectrum due to large-scale migration from Hubei province of China caused the outbreak in the southeast Asian region covering the latitude between 38°N to 6°S. The first case of coronavirus was reported in Thailand on 13 January 2020, which was followed by South Korea on 20 January 2020, and Vietnam and Taiwan on 22 January 2020 prior to reach Hong Kong and Singapore on 23 January 2020.
Malaysia reported the first coronavirus case on 25 January 2020, which further geo-spatially spread to Philippines on 30 January 2020 prior to reach Indian Sub-continent on 31 January 2020. National lockdowns were imposed by the respective governments of the southeast Asian countries as measures to control the severity of the spectrum of the outbreak. The Hong Kong, Vietnamese and South Korean governments imposed national lockdowns as measures to control the exponential rise of the spectrum of coronavirus from 8, 13 and 20 February 2020 respectively, after 16, 22 and 31 days of the first reported coronavirus case. The governments of Singapore, Malaysia, Philippines, Thailand, Taiwan and India imposed these measures from 6, 13, 15, 20, 24 and 25 March 2020 respectively, whereas, the Indonesian government imposed a national lockdown from 15 March 2020 (BBC,2020).
In Panarese and Shahini (2020), higher population mortality from coronavirus observed in northern latitude exhibiting the population mortality with decreasing north south gradient based on mortality data of 02 April 2020. In Rhodes et al. (2020), population mortality from coronavirus between different countries situated at latitudes below 64°N showed marked variations with relatively low population mortality at latitudes below 35°N based on mortality data of 15 April 2020, which supports vitamin D as a factor determining severity of the outbreak. Spatial big data analysis on population mortality carried out for 28 countries including southeast Asian region based on population mortality data from 15 April to 08 June 2020 shows relatively lower population mortality for countries situated at latitudes between 38°N and 35°S. Further, the temporal variability factor of population mortality for 28 countries situated at latitude south of 60°N of the hemisphere supports the significant variability factor as determine factor for the severity of the outbreak ( Verma et al., 2020).
In this paper, geo-spatial big data analysis has been carried out for determining the impact of latitude and the role of vitamin-D on population mortality for 52 countries situated between the latitude 64°N and 35°S, based on population mortality data from 15 April to 30 August 2020. This paper explains the variability factor of population mortality from 03 May to 30 August 2020 with respect to population mortality on 15 April 2020 for 52 countries situated between the latitude 64°N and 35°S for determining the severity of the covid-19 outbreak. This study shows relatively lower population mortality for countries situated between the latitude 38°N and 35°S, confirming good correlation for different countries due to multiple peaks of population mortality observed at the same latitude. Further, this study shows relatively significant variability factor of population mortality for countries situated between the latitude 38°N and 35°S. This paper explains very significant variability factor of population mortality observed for countries such as India, South Africa, Peru, Columbia, Mexico, Brazil, Saudi Arabia, Kuwait, Egypt, Russia and Ukraine from 03 May to 30 August 2020.
Covid-19 spectrum in southeast Asian region
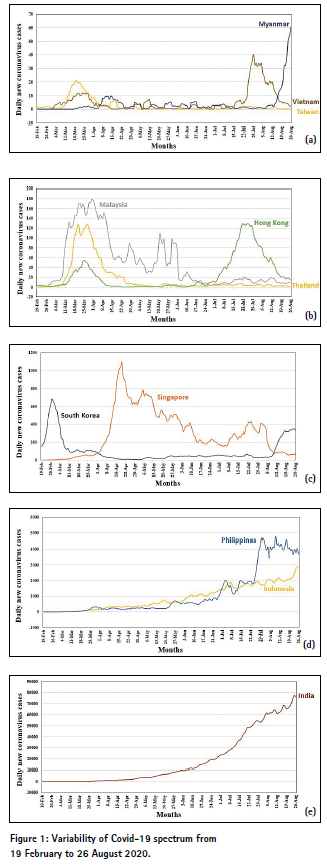
Figure 1 depicts the variation of the spectrum of 5 days moving average of daily new coronavirus cases from 19 Februaray to 30 August 2020 for 11 countries of the southeast Asian region such as Myanmar, Vietnam, Taiwan, Hong Kong, Thailand, South Korea, Singapore, Phillipines, Indonesia and India. The spectrum of coronavirus outbreak increased expoentially to reach the first peak of the spectrum prior to decesase exponentially to attain the stablity and further increased exponentially to reach the second peak of the outbreak prior to decresase non-liearly to reach complete recoverable stage for Vitenam, Hong Kong, Malaysia, South Korea and Singapore, whereas the spectrum of coronavirus outbreak reached the first peak prior to decrease exponentally to reach complete recoverable stage for Thailand and Taiwan. Further, the spectrum of coronavirus outbreak increased to reach stabilising stage to attain the first peak of the spectrum in August 2020 for Phillipines, Indonesia and India, whereas the spectrum of Myanmar exponentially increased during August 2020 after controlling the outbreak from March 2020 onwards.
Impact of latitude on population mortality
In Panarese and Shahini (2020), higher population mortality from coronavirus observed in northern latitude with highest in Italy and exhibiting the population mortality with decreasing north south gradient based on mortality data of 02 April 2020 for 108 countries. Northern latitudes are associated with vitamin D deficiency for higher population mortality due to low ultraviolet exposure in the northern countries.
When population mortality plotted against the latitude for 130 countries based on mortality data of 15 April 2020 by Rhodes et al. (2020), showed marked variation in mortality between different countries that lie below the latitude of 64°N of the hemisphere. People do not receive adequate sunlight to maintain vitamin D levels during winter in countries situated beyond the latitude of 35°N. All countries that lie below the latitude of 35°N showed relatively low population mortality due to availability of adequate sunlight to maintain vitamin D levels with the correlation coefficient of 0.53 between mortality and latitudes (Rhodes et al., 2020). Further, the potential impact of immune-modulating therapies and importance of nutrition particularly vitamin D is highlighted, which is important in regulating and suppressing the inflammatory cytokine response of respiratory epithelial cells as well as preventing the cytokine storms and subsequent Acute Respiratory Distress Syndrome (ARDS) that is commonly the cause of mortality from coronavirus (Panarese and Shahini, 2020; Rhodes et al., 2020). In Verma et al. (2020), relatively low population mortality from coronavirus is observed for countries situated at latitudes between 38°N and 35°S based on population mortality data for 28 countries from 15 April, 26 April, 3 May, 13 May, 22 May and 08 June 2020.
Higher correlations is observed for the impact of latitudes on population mortality due to continuance of multiple peaks of increased population mortality for countries at the same latitudes, as observed by Panarese and Shahini (2020) and Rhodes et al. (2020). Spatial big data analysis of the variability factor of population mortality from 15 April to 8 June 2020 for 28 countries shows that the variability factor of population mortality depends on the spectrum of daily new cases as well as quality healthcare infrastructure, which acts as determining factor for the severity of the coronavirus outbreak.
Population Mortality for the Southeast Asian Region
Figure 2 (a) depicts the variation of population mortality from Covid-19 for 11 countries of the Southeast Asian region that lie between latitudes 38°N and 6°S based on population mortality data from 15 April to 30 August 2020. There are significant variation in population mortality for India, Hong Kong, Philippines, Indonesia and Singapore, whereas South Korea, Taiwan, Vietnam, Myanmar, Thailand and Malaysia showed non-significant variations in population mortality. Further, Figure 2 (b) shows the variation of variability factor of population mortality from 13 May to 15 August 2020 with respect to population mortality on 15 April 2020. It shows maximum variations of variability factor of population mortality for India in the southeast Asian region, whereas other countries of the southeast Asian region shows non-significant variations in variability factor. The spectrum of daily new covid-19 cases depicted in Figure 2 (c) shows very significant exponential increase for India, causing significant variability of population mortality to determines the maximum severity.
Population mortality and its temporal variability
Figure 3 depicts the marked variations of population mortality (deaths per million population) for countries that lies south of the latitude below 64°N based on population mortality data from 15 April to 30 August 2020. It shows relatively low population mortality for countries situated at latitudes between 38° N and 6° S, whereas countries that lies beyond the latitude 38°N and below the latitude 6° S shows relatively higher population mortality, which confirms to the observations of low population mortality between the latitudes 35°N and 35°S based on population mortality data of 15 April 2020 ( Panarese & Shahini, 2020; Rhodes et al., 2020) and population mortality data from 15 April to 6 June 2020 ( Verma et al., 2020). Further, it shows the continuity of the higher peaks of population mortality for countries situated at the same latitudes below 64°N based on the population mortality of 15 April, 26 April, 3 May, 13 May, 22 May, 6 June, 20 June, 10 July, 30 July, 15 August and 30 August 2020, which shows higher correlation between population mortality and latitudes for countries. Further, the impact of latitudes on population mortality is confirmed to follow relatively higher mortality for countries due to low ultraviolet exposure at northern latitudes beyond 35°N as well as supports vitamin D as factor for determining the population mortality.
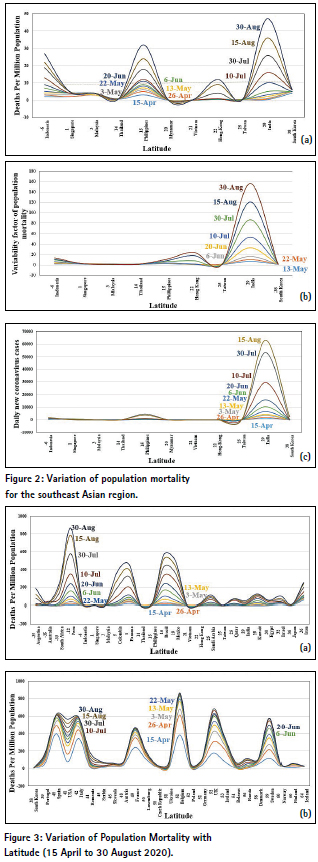
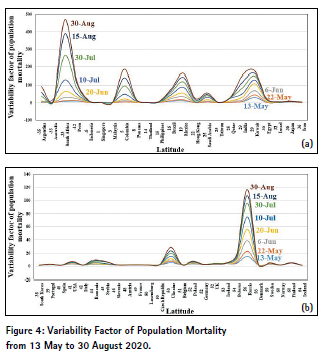
Figure 4(a) depicts the significant increase of temporal variability factor of population mortality from 13 May to 30 August 2020 for countries that lies below the latitude 38°N with respect to population mortality of 15 April 2020, whereas, nonsignificant increase of temporal variability factor of population mortality observed during the same period as depicted in Figure 4(b) for most of the countries situated at the latitudes beyond 38°N, excluding Russia and Ukraine showing significant variability factor of population mortality more than 115 and 30 respectively. Figure 4 (a) shows the significant increase of variability factor more than 100 for many countries situated below the latitude 38°N such as South Africa, Peru, Columbia, Panama, Brazil, Mexico, India, Kuwait and Egypt, whereas non-significant increase of variability factor observed for countries such as Argentina, Australia, Indonesia, Singapore, Malaysia, Thailand, Philippines, Hong-Kong, Saudi Arabia, Taiwan, Qatar, Israel, Japan, Iran and South Korea. Further, it is observed that most of the countries that lie above the latitude 38°N shows the non-significant increase of variability factor of population mortality less than 20 from 13 May to 30 August 2020. This justifies that the increase of significant temporal variability factor of population mortality does not depend on latitudes of the countries as relatively lower population mortality observed below the latitude 38°N, but depends on increase of the spectrum of daily new covid-19 cases and healthcare infrastructure of the country as depicted in Figure 2 for the southeast Asian region. This highlights the importance of variability factor of population mortality as determining factor for the severity or vulnerability of covid-19 outbreak.
Conclusion
This present study of spatial big data analysis of population mortality have been carried out for countries that lie between the latitudes 64°N and 35° S based on population mortality data from 15 April to 30 August 2020, which provides variability factor for determining severity of the outbreak. Further, this study shows that the coronavirus spectrum of daily new cases attained first and second peak of the spectrum for Vietnam, Hong Kong, Malaysia, South Korea and Singapore to reach recoverable stage, whereas Thailand and Taiwan attained complete recoverable stage after attaining the first peak of the spectrum during March 2020. Further, Philippines, Indonesia and India are still stabilising to reach the first peak of the spectrum of the outbreak, whereas the non-linear exponential increase observed for Myanmar. The analysis of the impact of latitude on population mortality from coronavirus from 15 April to 30 August 2020 shows relatively low population mortality in the southeast Asian region and other countries that lie below the latitude 38°N (Panarese & Shahini, 2020; Rhodes et al., 2020; Verma et al., 2020). The temporal variability factor of population mortality from 13 May to 30 August 2020 for countries situated at different latitudes below 64°N acts as determining factor for estimating the severity of the coronavirus outbreak for the country, rather than considering only population mortality, such as South Africa, Peru, Columbia, Panama, Brazil, Mexico, India, Kuwait, Egypt, Ukraine and Russia. The impact of latitude on the variability factor of population mortality is not observed in determining the severity of the outbreak for countries that lie below the latitude 64°N. The analysis of population mortality and its variability factor from 15 April to 30 August 2020, confirms the highest level of the severity of the outbreak for India, whereas other countries such as South Korea, Hong Kong, Taiwan, Malaysia, Thailand, Vietnam and Singapore, successfully controlled the spectrum to the recoverable stage of the outbreak.
References
BBC, 2020.Coronavirus: The world in lockdown in maps & charts/ Source: Oxford Covid-19 Government Response Tracker /BBC Research. Available online at: https:// www. bbc.com/news/world-52103747 (Last access date: 10 July 2020).
Coronavirus, 2020. Global Covid-19 Data for All Countries. Available online at: https://www. worldmeters.info/coronavirus (Last access date: 10 July 2020).
Jonathan, M.R., Sreedar, S., Eamon, L.& Rose, A.K., 2020. Low population mortality from COVID-19 in countries south of latitude 35 degree north supports vitamin D as a factor determining severity. Aliment. Pharm. Therap. Vol. 51, pp 1438-1439.
Panarese A. & Shahini E., 2020. Covid-19 and vitamin D. Aliment. Pharm. Therap. Vol.51, pp 993-995.
Verma, A.K., Verma, A., Verma A., 2020. Coronavirus Spatial Big Data Predictive Analysis for the Southeast Asian Region. Defence S & T Technical Bulletin, Ministry of Defence, Malaysia. Vol.12 (2), pp 344- 366.
The paper was presented at Asian Conference on Remote Sensing (ACRS) 2020, 9-11 November 2020, Deqing, China


 (No Ratings Yet)


Leave your response!