| Surveying | |
Comparative study on Cadastral Surveying using Total Station and High Resolution Satellite Image
This study proposes the comparative study of Cadastral boundary Surveying and mapping using Total Station and Satellite Imageries in Nepal |
 |
|
 |
|
 |
|
 |
|
 |
|
Recent technological advancements have shown that even RTK GPS and satellite imageries with high resolution can also be used for the cadastral surveying. Cadastral mapping using GPS Technologies and High Resolution Satellite Imagery are increasingly renowned in many developing countries of the world, substituting the traditional graphical Surveying method. The accuracies between the cadastral data obtained by RTK GPS technology are comparable with those acquired by conventional EDM/Total Station surveying for most cadastral purposes (Wan et al., 1999). The emerging new satellite technologies have brought revolutionary changes in the field of GIS-based Cadastral mapping system facilitating high resolution satellite images of 0.5 m (GeoEye-1) or even 0.34 m (GeoEye-2) spatial resolution. Creation and updating of cadastral maps, multifunctional cadastral data as land value maps and descriptions of study area in an economical manner are some of the potential use of HRSI in Cadastral works (Nisanci and Yomrahoglu, 2002). Study shows that HRSI such as QuickBird and IKONOS imagery are accurate enough for mapping purpose up to scale 1:5000 (Büyüksalih and Jacobsen, 2005). It is possible to achieve an accuracy of +/- 2 meters using 1 m resolution satellite imagery and GPS controls (Cay et al.)
Background
The cadastral mapping of the entire Nepal, completed in 1996 using graphical plane table surveying technique, was mainly carried out for the fiscal/revenue purposes. Due to urbanization and population growth, the value of land is increasing rapidly and those graphical cadastral maps are not adequate to reflect the real field situation in the urban areas. Due to the scale constraint, the cadastral maps prepared by graphical cadastral surveying method does not satisfy the land owners as they are asking for the accuracy of centimeter of land in the front face of their land parcel. The maps are in very ruin condition due to the continuously used and improper documentation. Even the land owners are asking for the recording and documentation of 3D real estate objects. Also, Survey Department has supported FIG’s Cadastre Vision 2014. Considering these facts, SD has prepared its Logical Framework Plan (10 years from fiscal year 2005/2006) and one of the outputs after ten year will be the replacement of traditional technology with digital cadastral system for effective service delivery in cadastral related organizations in Nepal (Survey Department, 2006). Cadastral Survey Branch under Survey Department has introduced digital technology for data acquisition in Banepa Municipality as a piloting. After the success of this technology in piloting phase, the Program has been continued in other urban areas and improvements are going on. The traditional plane tabling method has been replaced by modern numerical cadastral surveying method using total station instruments and the cadastral database has been developed in fully digital environment. But the pace of surveying activities is very slow and it seems impossible to achieve the progress as per LFP.
With continual research and development remote sensing (satellite image), techniques and systems developed have become more reliable, cheaper and more productive making satellite image more attractive for a range of surveying solutions. The question then arises that if satellite image is offering high quality data, can this technology be accurate and viable enough to compete with Total Station methods? Can this technology be used for boundary surveys, most notably boundary definitions and redefinitions? This case study is oriented to answer these questions.
Objectives
This project has centered its research on the comparative study of parcel boundary delineation from total station and High Resolution satellite imagery. The main purpose of the case study survey is to investigate the use of High Resolution satellite imagery for boundary survey in the context of cadastral mapping in Nepal.
Study Area
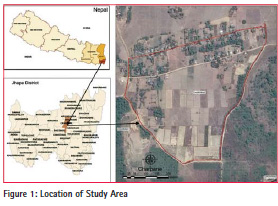
The location of the study area in Figure 1 is Charpane village which is located in the Birtamode Municipality – 4, Jhapa former charpane VDC – 8. It lies in the Eastern region of Nepal over the Terai belt. The village has almost flat terrain and because of the fertile soil, the land is mostly used for agriculture, effecting the urbanization to be minimal in the study area. The extent of study area spans from 26° 35’ 31.10”N to 26° 35’ 50.76” N and 87° 57’ 8.16”E to 87° 57’ 31.05”E. Charpane village area consists of agricultural parcels predominantly while the settlements are meagerly distributed.
Datasets
3 sets of data were used for the study above viz., 3rd order Control points, Total Station survey data and GeoEye HRSI. Third order Control points were obtained from Geodetic Survey Division, Survey Department, Government of Nepal. Cadastral Survey data acquired by Total station were obtained from Surveying- Mapping Section of Survey Office Chandragadi, Jhapa. A total of 102 parcels covering an area of 20.50 hectares of flat land were considered for the comparison and analysis. GeoEye Satellite Image of resolution 0.5m acquired on 14th March 2014 was used for the study. The image was, radiometrically as well as geometrically corrected and obtained from Topographical Survey Division, Survey Department, Government of Nepal.
Methodology
The methodology used in this study is shown in Figure 2 Initially, field survey using total station was carried out to obtain Ground Control points for georeferencing the high resolution processed satellite Image. Further survey points were collected to delineate the parcel boundary. Secondly, geo-referenced satellite image were used for extraction of cadastral boundaries. Existing cadastral maps dating back to 1965 A.D collected from Department of Land Information & Archive (DOLIA) were outdated and surveyed without control points i.e. arbitrarily, hence was not used for the comparison. Thus the parcels acquired from different sources were used for comparison later.

Acquisition of Cadastral Data by Total Station
The study area comprised of existing geodetic control points (GCP) established by Geodetic Branch of Survey Department. However, these points were not adequate for conducting digital cadastral survey by total station. Furthermore, sufficient & well spread control points were required for geo-referencing the satellite image. Therefore, additional control points were established to meet the requirement of acquiring cadastral data using total station.
With ample amount of control points covering the study area, the collection of survey points were carried out. Prior to the traditional method of pegging or marking the parcel corners, respective land owners were asked to determine their boundary during adjudication. Reflectors were mounted on these demarked boundary corners and measured by the total station. Likewise successive parcel boundary points were recorded on the total station for delineation of parcel boundary.
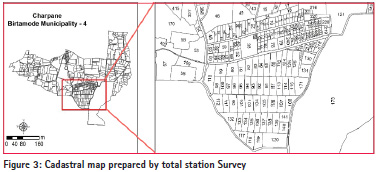
The collected boundary points recorded on the total station were transferred into the computer via cable. Appropriate software was used to convert the total station file to CSV (comma separated value) file. This file was loaded into the GIS environment via GIS software ARCGIS 10.3, which was further used for processing and analysis. These data were stored in a predefined database schema to prepare the cadastral database. Parcel boundaries were delineated with the help of sketch made during the collection of survey points. Also the information related to the parcel such as land owner, address, type of land, etc. were stored in the attribute table of the respective parcel. Later the completed database is used for publishing notice, preparing field book, land ownership certificates etc. Thus, the final output is a database, where the parcel and its related documents are stored, which can be printed on a paper.
The final output were printed in form of maps in order to carry out the field verification to determine the flaws during measurements or data processing. Parcels were verified on the field and errors during measurements or processing were identified. Later these errors were checked and corrected and hence finalized to be used for providing service to the public.
Acquisition of Cadastral Data by HRSI
For this study purpose, we used 0.5 m resolution panchromatic GeoEye image. Since the image was previously radiometrically and geometrically corrected no further processing were required except for geo-referencing. For this GCPs were collected during control point densification for enhancing the positional accuracy of the image. The control points were collected by field observation using total station with reference to the existing third order control point established by Geodetic Survey Branch. The control points collected were well distributed over the study area and sufficient enough for the image to be georeferenced.
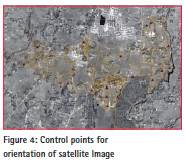
Sometimes the location information delivered by the satellite image are inadequate, and the data does not align properly with field data. To ensure the locational accuracy the satellite image was aligned or georeferenced using the GCP acquired during field observations by total station. First order transformation was used for mapping each raster point to the target location as the satellite image was preprocessed before its procurement. About 15 control points were used in this process to increase the overall accuracy of the transformation as shown in Figure 4.
After geo-referencing the satellite image, parcels were digitized and verified on the map by overlaying the parcel boundary obtained from total station survey. Furthermore, mismatch of the parcel boundaries acquired from different sources were compared as stated in the next section.
Result and Analysis
Time Comparison
The Table 1 & 2 shows the detail time involvement for deriving parcel using Total Station method and HRSI method respectively. Parcel Boundary delineation using Total Station requires intensive field observation thus consuming more cost and more time on field, whereas Parcel Boundary delineation using Satellite Image involves less field work and is economical compared to the method using total station.
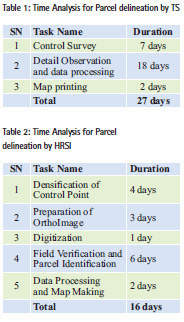
It took 27 days for the total station method to delineate the parcel boundary and prepare its map while the same process was completed in 16 days by using Satellite Image. Hence it can be concluded that Cadastral mapping using HRSI requires less time than mapping done by the total station.
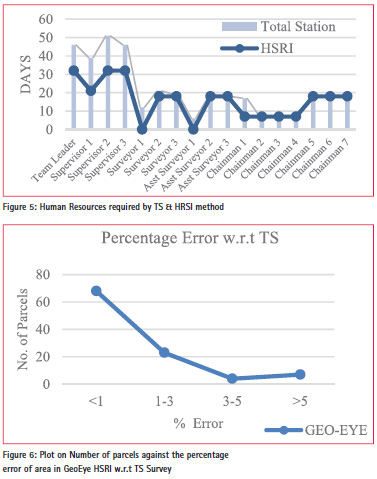
Resource Comparison
For the parcel boundary delineation using Total Station, more human resources and machinery equipment are involved in the activities like detail field observation and data processing, whereas less manpower with few machinery equipment can delineate parcel boundary using Satellite Image. The Figure 5 shows human resources involved in this study using both the Total Station and HRSI method.
Area Comparison
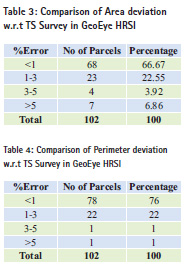
The parcels derived from the GeoEye image (0.5m) were used for analysis and compared with the parcels obtained from total station survey, as these data were used as reference area for the comparison. Matching parcels from both the layers were extracted and used for the analysis. A total of 102 parcels were extracted from the satellite image and used for comparison with the matching parcels derived from Total Station Survey.
The Figure 6 illustrates the percentage error ensued during mismatch between the two parcel layers derived from Total Station Survey and HRSI. It can be stated that 90 % of the parcels can be marked with less than 5% error using HRSI.
Also when observing the facts from the Table 3 , 67 % Parcels (68 Parcels) derived from the GeoEye image had area deviation less than 1 % with respect to TS Survey which shows an accurate match between two parcel layers. Around 23 % Parcels (23 Parcels) derived from the GeoEye Image had an area deviation between 1% and 3% w.r.t TS Survey which shows a minimal mismatch between these two parcel layers. However, very low percentage i.e around 4 % Parcels (4 parcels) derived from GeoEye Image had an area deviation between 3% and 5 % w.r.t TS Survey which indicates mismatch between two layers and considered to be a large deviation. These large deviations are due to several factors creating hindrance in derivation of parcels from the Satellite image such as unclear parcel boundaries and high canopy cover over the boundaries.
Perimeter Comparison
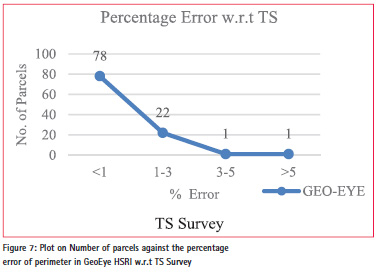
The perimeter of the derived parcels from GeoEye and TS Survey were used for the analysis. A total of 102 parcels were extracted from the satellite image and used for comparison with the matching parcels derived from Total Station Survey.
The Figure 7 shows the percentage error comparison of perimeter between two layers of parcels derived from GeoEye image and TS Survey. Observing the steep declination, it can be stated that larger no of parcels can be matched with higher accuracy between the two layers.
When observed in the Table 4, 76% Parcels (78 Parcels) derived from GeoEye had perimeter deviation less than 1% w.r.t to TS Survey which shows an accurate match between two parcel layers. Around 22% Parcels (22 Parcels) derived from GeoEye image had perimeter deviation between 1 % and 3% which shows a minimal mismatch between these two parcel layers. Only 1% Parcels derived from GeoEye had perimeter deviation between 3% and 5% w.r.t TS Survey which indicates small mismatch between two layers.
Position Comparison
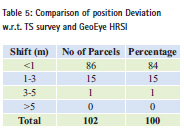
Positional Accuracy of the parcel boundary derived from GeoEye Image and TS Survey were assessed by identifying the shift in position of the parcels Centroid coordinates calculated in terms of distance between them .A total of 102 parcels were extracted from the satellite image and used for comparison with the matching parcels derived from Total Station Survey. Centroid Coordinates of each parcel derived from TS Survey as well as parcel derived from GeoEye image were calculated and the distance between the centroids of the corresponding parcel boundary was measured using the Euler’s Distance Formula (1):
![]()
Where d is the shift in meters, (x,y) is the coordinate value of the point From Table 5, we can observe that 84% Parcels (86 Parcels) derived from GeoEye image had centroid shift less than 1 m w.r.t TS Survey which shows an accurate match between these two parcels. About 15 % Parcels derived from GeoEye image had centroid shift between 1% and 3% which shows a minimal mismatch between these two parcel layers. Only 1 % Parcels had centroid shift between 3% and 5% indicating mismatch between two layers. From this it can be depicted that more number of parcels can be derived with acceptable accuracy using HRSI.
Limitations
The study was carried out under favorable conditions and circumstances for which the tough part can go neglected. Some of the limitations that govern this study are as follows:
i. Study area comprised of flat lands, mostly agricultural fields with almost no settlements.
ii. Considerably large parcel plots were used for the comparison.
iii. Image acquired was of during harvesting season where the parcel boundary could be easily depicted.
iv. The best digitization of the parcel boundary among three digitizers were used for the comparison.
Conclusions
Todays’ emerging new Satellite Technologies with high resolution has proved to be a boon in the field of land surveying for cadastral mapping with high accuracy, cost effective and time efficient manner. High Resolution satellite imagery provides clear identification of parcel boundaries and other features due to which conventional and traditional method of cadastral mapping is shifting towards more advanced, reliable and economic methods. This study incorporates the potential use of High Resolution satellite image for indirect land surveying for cadastral survey /resurvey to achieve high accuracy with low cost and within small timeframe. The principle objective of the project is to compare the cadastral survey done by High Resolution satellite image and that by Total Station in context of Nepal. Comparisons between parcel boundaries derived from total station Survey and HRSI shows good potential of the later for Cadastral Survey. For this, various attributes of the derived parcels such as area, perimeter and position from both techniques were compared along with human resource involved and time for the completion of task.
The comparisons shows that around 80% of the parcel boundary can be derived with acceptable accuracy and precision meeting the standards of cadastral Survey. In addition, use of HRSI will result in faster updating of Cadastral maps in more economical and convenient manner. From the above findings it’s clear that use of HRSI can reduce the Cost, Time and Human resources as compared to the total Station method.Also the parcel boundary can be derived with acceptable accuracy with the use of HRSI
However, large deviations in parcel areas were due to unclear boundaries with similar spectral response, high canopy cover over the boundaries. etc.
Recommendations
Though the obtained results from the comparison of two techniques in delineating the parcel boundaries shows good potential for HRSI’s use in cadastral survey, higher accuracy cannot be achieved as that of the total station. There are some limitations to this technique as it solely relies on visual interpretation. In case of highly dense settlement area, shadow region, high canopy cover, unclear boundaries due to similar spectral reflectance, small parcel etc. similar accuracy cannot be achieved.
Every techniques has its own flaws and benefit. To obscure the flaws of one with the benefits of the other would be the best option to overcome any task with high accuracy at minimal cost. Similar an integrated approach of both the techniques can be used to achieve higher accuracy in an economical manner and can even fasten the process. Furthermore, as aimed at the beginning of the project, introducing the GPS technology for cadastral survey could have enhanced more realistic picture of technologies intervention for expediting cadastral surveying.
Acknowledgements
The authors would like to express sincere gratitude to to Mr. Amir Neupane, Office Head, Survey Office Chandragadhi, Jhapa and his entire team for their support. The authors thank Mr. Kamal Ghimire, Chief Survey Officer, Survey Department for providing us High Resolution Satellite Image to carry out this project and guiding us throughout the project duration. The project team would like to extend heartfelt thankfulness to Survey Department for providing us the opportunity to carry out this project and all the staff of Cadastral Survey Division, for their constant support and encouragement.
References
[1] T. Cay, O. Corumluoglu and F. Iscan, “A Study on Productivity of Satellite Images in the Planning Phase of Land Consolidation Projects,” presented at the XXth ISPRS Congress “Geo-Imagery Bridging Continents”, Istanbul, Turkey, 2004.
[2] G. Büyüksalih and K, Jacobsen, “Optimized Geometric Handling of High Resolution Space Images,” ASPRS annual convention, Baltimore, p.9, 2005.
[3] Z. Ali, “Assessing Usefulness of High- Resolution Satellite Imagery (HRSI) in GIS-based Cadastral Land Information System,” Journal of Settlements and Spatial Planning, 3(2), pp. 93-96, 2012.
[4] Z. Ali, A. Tuladhar and J. Zevenbergen, “An integrated approach for updating cadastral maps in Pakistan using satellite remote sensing data,” International Journal of Applied Earth Observation and Geoinformation, 18, pp. 386-398, 2012
[5] S. S. Rao, J. R. Sharma, S. S. Rajasekhar, D. S. P. Rao, A. Arepalli, V. Arora., Kuldeep, R. P. Singh and M. Kanaparthi., “Assessing Usefulness Of High- Resolution Satellite Imagery (HRSI) for Re-Survey Of Cadastral Maps,” ISPRS Annals of the Photogrammetry, Remote Sensing and Spatial Information Sciences, Volume II-8, 2014.
The paper was presented at FIG – ISPRS workshop, 2015: International Workshop on Role of Land Professionals and SDI in Disaster Risk Reduction: In the Context of Post 2015 Nepal Earthquake. Kathmandu, Nepal, 25th – 27th November, 2015


 (2 votes, average: 4.00 out of 5)


Leave your response!