| GIS - New | |
Can Census GIS bell the Corona Cat?
(COVID-19) has uncertain ramifications in the Indian Context, owing to India’s lack of data on people as well as health facilities |
 |
|
With the world grappled in Corona virus (COVID-19) pandemic with over 5.5 million cases as of May 26, 2020, the affected numbers from India fail to find a proportion with its population density, hygienic/ living conditions, law enforcement, and healthcare program. It is said to do with the rate of testing, and it won’t be surprising to find a substantial number of contaminated persons amongst the billion-plus population, had the rate been better than 2243 for every 1 million (ICMR, 2020). The underlying reason is always lack of data and essential resources, and there can be no better time to acknowledge and act upon the same.
While it is dismaying to see the Corona Circles on near-real time dashboards getting bigger (and sometimes smaller, to conform to the global unfoldings (Monmonier, 2014)), like a bystander, it is wise to acknowledge the inevitability of the damage it shall cause in the near future, and aim for preparedness at the earliest possibility. While everyone is tracking the disease (ACPN, 2020), Government of India’s ‘Aarogya Setu’ App (Agarwal, 2020) might as well track the diseased (when everyone will have access to a smartphone) with its social mapping, but till then solutions need to be thought of in both the short and long run.
An opportunity of the decadal census is quite at the door, and a lot can be achieved if this grass-root level exercise may move beyond the idea of ‘notional maps’ (United Nations, 2009) in the Indian context. Even the latest Census of 2011 contains less of maps and graphical charts, and more of data worthy of scalograms and sociograms (Mahavir, 1996), leaving a lot to be desired in this era of cartographic coups.
The change, right from the process of data collection, is necessary, for the Census Town and Village Directories contain only the number of amenities, with no information on their spatial distribution, completely overlooking the consequential inconsistencies of the over- or inadequacy of amenities (Bennett & Geraghty, 2020).
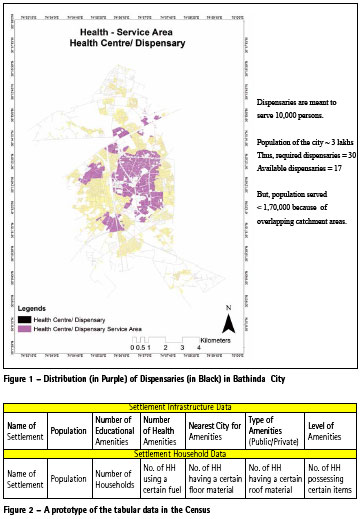
These amenities may as well suffice the required number in proportion to the population they are meant for (DDA, 2014), but on ground, the reality is different (Gupta, 2019). (Figure 1)
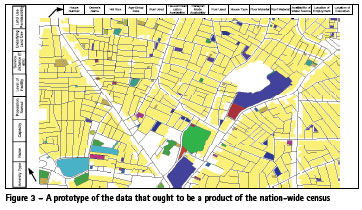
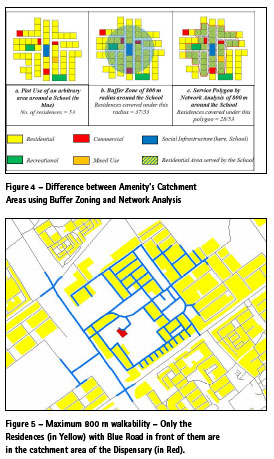
Supposedly, if the census mechanisms start going beyond ‘notional maps’ and sombre tabulations (Figure 2), and replace them with the ones in Figure 3, governance and decision-making might as well take a somersault.
It is best to map every house, with all its occupants’ information and respective cadastral layers. It is quite analogus to extending the SVAMITVA Scheme (MoPR, 2020) to Urban Areas (perhaps as SUAMITUA) and adding a few more columns to its Property Data Attribute Table – for information that cannot be captured by drones. The settlements – be it cities or hamlets, need to be controlled – for their complexities to be constructive. Mere technological means might sound disagreeable (Sandercock, 1997), but in a country with dearth of plans, planners, and planning mechanisms, it is best to undertake the bird in hand; and with the ever-augmenting circles of the coronavirus, planners cannot help wondering the better alternatives – of projecting migration with the help of cadastral data, and providing a better planned exodus; of deducing social vulnerability and most-at risk groups in catastrophic times; of helping out the common public with resources, goods and services; of facilitating employers and decision-makers with data on employees and citizens, respectively.
A Punjabi idiom loosely translated to ‘More the jaggery, sweeter the pudding’, fits in the scenario of data geo-visualization – always better with more and detailed shapefiles, as described below:
a. Mapping an amenity’s catchment area as per the distance norms (walkable distance).
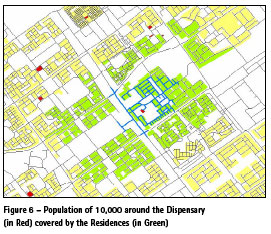
A walkable distance for a health centre/ dispensary is 800 m (Republic of Iraq, 2010), inducing the image of a dispensary with a circle/ buffer of radius 800 m around it in mind. In fact, Gupta (2019) poses a juxtaposition of another amenity, i.e. primary school – with a walkable distance of 800m (Perry, 1929). Taking into account abutting streets and their interconnected nexus, the distance around the amenity decreases considerably, thus serving lesser residential areas than anticipated. A geo-processing tool of GIS called Network Analysis is used for this purpose. (Figure 4)
Similarly, a dispensary with a walkability of 800 m has an influence area smaller than that. (Figure 5)
b. Redefining the catchment area obtained in (a) as per the amenity’s capacity.
The capacity of a health centre/ dispensary is 10,000 persons (DDA, 2014; TCPO, 2014).(Figure 6)
It depends on the population density of the area, whichever polygon (the one related to maximum distance, or the one related to maximum capacity) is smaller. Optimum planning might advocate going with the smaller polygon – or whatever is feasible at settlement level. Either way, population density is a significant function – both to deduce the catchment area of an amenity, as well as to determine the extent and speed of spread of a contagious disease, as the one at hand.
With uncertain RO and unprecedented super-spreader events (Ciarochi, 2020), parameters like heterogeneity of population and scarcity of medical facilities have been overlooked by even the most eminent of researches on SEIR (Susceptible – Exposed – Infected – Recovered) modelling of COVID- 19 (Hamzah et al., 2020; Lopez and Rodo, 2020), thus affecting the efficacy of such models as well as of their successors (Boseley, 2020).
c. Mapping the area of actual influence of an amenity.
For various kinds of amenities with a lot of choices – especially schools, and rarely health services – people do not necessarily follow the walkability’s or amenity’s capacity’s catchment areas. They prefer being served at an amenity of their choice, no matter how far it be – a parameter called ‘gravitational pull of an amenity’ (Stulz, Pichler, Kawohl, & Hepp, 2018), that planners may/ may not imbibe in their plans of requirement projections (subject to data availability). If one is only interested in fulfilment of numbers, there is the question of distribution. When that too is taken care of, individual choices of the people come into play. A planner who knows his/ her settlement and its economic conditions knows where to draw the line. However, census must not hesitate from collection of this type of data, for it’s never enough (Falkenberg & Styan, 2014).
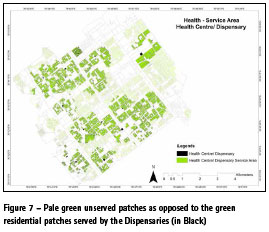
d. Projecting further requirement of the same kind of amenity.
Maps of amenities and their catchment areas make it easier for gap areas to be identified – and the consequent future projections. (Gupta, 2019) (Figure 7)
This can be applicable to all kinds of amenities, helping India usher on the path of better preparedness for any kind of eventuality. Hence, Census GIS might as well bell the Corona Cat, but only after laying an intricate trap.
Bibliography
ACPN, (Asian City Planners Network). (2020). 100 Delhi Containment Areas. Retrieved from https://goo. gl/maps/bR9aLmkSRGUHH5DM7
Agarwal, S. (2020, April 20). Aarogya Setu app primed to take lead in COVID-19 war. The Economic Times. Retrieved from https:// economictimes.indiatimes. com/news/economy/policy/ aarogya-setu- app-primed-totake- lead-in-covid-19-war/ articleshow/75238590.cms
Bennett, L., & Geraghty, E. (2020). Models and Maps explore COVID-19 Surges and Capacity to Help Officials Prepare. Retrieved April 25, 2020, from https:// www.esri.com/about/newsroom/ blog/models-maps-explorecovid- 19-surges-capacity/
Boseley, S. (2020, April 7). How can coronavirus models get it so wrong? The Guardian. Retrieved from https://www. theguardian.com/world/2020/ apr/07/how-can-coronavirusmodels- get-it-so- wrong
Ciarochi, J. (2020). How COVID-19 and Other Infectious Diseases Spread: Mathematical Modeling.
Retrieved April 24, 2020, from https://triplebyte.com/blog/ modeling-infectious-diseases
DDA, (Delhi Development Authority). (2014). Master Plan for Delhi – 2021. New Delhi. Retrieved from https://dda.org.in/ddanew/pdf/ Planning/reprint mpd2021.pdf
Falkenberg, L. J., & Styan, C. A. (2014). Too much data is never enough: A review of the mismatch between scales of water quality data collection and reporting from recent marine dredging
programmes. Ecological Indicators, 45, 529–537. https://doi.org/https://doi. org/10.1016/j.ecolind.2014.05.006
Gupta, R. (2019). Resource Efficiency Analysis of Social Infrastructure. Indian Institute of Remote Sensing, Dehradun.
Hamzah, F. A. B., Lau, C. H., Nazri, H., Ligot, D. V., Lee, G., Tan, C. L., … Salunga, R. E. (2020).
CoronaTracker: World-wide Covid-19 outbreak data analysis and prediction. Bulletin of the World Health Organization, (March), 32. https://doi.org/http://dx.doi. org/10.2471/BLT.20.255695
ICMR, (Indian Council of Medical Research). (2020). SARS-CoV-2 (COVID-19) Testing: Status Update 26 May 2020 9:00 AM IST. India. Retrieved from https://www.icmr.gov. in/pdf/covid/update/ICMR_testing_ update_26May2020_9AM_IST.pdf
Lopez, L. R., & Rodo, X. (2020). A modified SEIR model to predict the COVID-19 outbreak in Spain: Simulating Control Scenarios and Multi-scale Epidemics. MedRxiv, 2020.03.27.20045005. https:// doi.org/: https://doi.org/10.11 01/2020.03.27.20045005.
Mahavir. (1996). Modelling Settlement Patterns for Metropolitan Regions: Inputs from Remote Sensing. International Institute for Geo-Information Science and Earth Observation. Retrieved from http://www.itc.nl/library/ papers_1996/phd/mahavir.pdf
Monmonier, M. (2014). How To Lie With Maps. University of Chicago Press
MoPR, (Ministry of Panchayati Raj). (2020). Framework for Implementation of SVAMITVA Scheme – Survey of Villages and Mapping with Improvised Technologies in Village Areas. Panchayati Raj. New Delhi. Retrieved from https://panchayat. gov.in/documents/20126/0/ Svamitva+Guidelines.pdf/ c561bb40-4de3-9e19- fae8- 1f75502c8ec8?t=1587661167254
Perry, C. A. (1929). The Neighborhood Unit, a Scheme of Arrangement for the Family-life Community.
New York: Regional Survey of New York and Its Environs. Retrieved from https://books.google.co.in/ books?id=JhptGwAACAAJ
Republic of Iraq. (2010). Urban Housing Standards Manual. Baghdad. Retrieved from http:// investpromo.gov.iq/wp-content/ uploads/2013/04/URBANHOUSING- STANDARDS.pdf
Sandercock, L. (1997). Towards Cosmopolis: Planning for Multicultural Cities. Wiley.
Stulz, N., Pichler, E.-M., Kawohl, W., & Hepp, U. (2018). The Gravitational Force of Mental Health Services: Distance Decay Effects in a Rural Swiss Service Area. BMC Health Serv Res., 18(1), 81. https://doi. org/10.1186/s12913-018-2888-1
TCPO, (Town and Country Planning Organisation). (2014). Urban and Regional Development Plans Formulation and Implementation Guidelines. New Delhi.
United Nations. (2009). Handbook on Geospatial Infrastructure in Support of Census Activities. New York. Retrieved from https://unstats.un.org/ unsd/publication/seriesf/ Seriesf_103e.pdf


 (7 votes, average: 4.71 out of 5)


Leave your response!