| Surveying | |
A vision for a fully digital cadastral survey system
The value of cadastral survey data is rapidly increasing in line with the movement into the digital age. To truly realise its value, it will be necessary to detach completely from paper-based approaches associated with the past |
 |
|
 |
|
The world is going digital. Advancements in technology and an evolving society are coupling to mean it is fast becoming the norm to provide and consume information digitally. Local and central governments are reacting to this by developing policies, systems and infrastructure that are ‘digital by design’ and ‘digital by default’ (Corydon, Ganesan & Lundqvist, 2016). Examples include New Zealand’s capital city, Wellington, which has developed the strategy, Wellington Towards 2040: Smart Capital (Wellington City Council, 2011), and Singapore is well down the track to become a ‘Smart Nation’ (Smart Nation and Digital Government Office, 2018).
Cadastral survey systems define the boundaries of property rights and in countries like New Zealand are crucial to economic success. Making the cadastral survey system digital helps drive efficient economic activity and is a key enabler of the initiatives being pursued by governments. The cadastre also provides a critical base layer that is used in Geographic Information Systems and more ubiquitous technologies. It also enables the integration of propertyrelated services that are administered by local and central governments. The importance of cadastral survey systems emphasises a wider need for such systems to be truly and fully digital.
This paper explores a vision for a fully digital cadastral survey system in New Zealand. A particular focus of the paper is to discuss how the existing system, despite being highly digital, incorporates paperbased approaches that are a testament to past practice. It is these approaches that stand in the way of a fully digital system that supports processes of automation, enhanced data quality and data re-use.
Current digitisation of the survey process
Since the establishment of the cadastral survey and title systems in the 1800s, New Zealand surveyors have prepared survey plans to formally record the location and extents of property rights, restrictions and responsibilities in the cadastre. Since 2000, with the introduction of the automated survey and titles system ‘Landonline’, most of the survey process have been progressively digitised and use digital data – in the field, in the office, and for the cadastre itself.
With reference to Figure 1, a cadastral survey begins with a surveyor remotely searching the cadastre for records that relate to the area of interest (e.g., where existing parcels are to be subdivided). The surveyor uploads information that is relevant to their job, such as ownership records (e.g., titles) and historic survey plans. In addition to any image-based records, survey data is extracted and imported into the surveyor’s preferred survey software. The surveyor adds new data from their field survey along with any other data derived from groundtruthed architectural or engineering drawings. The required data for the finalised survey is then exported to a LandXML file (http://www.landxml.org).
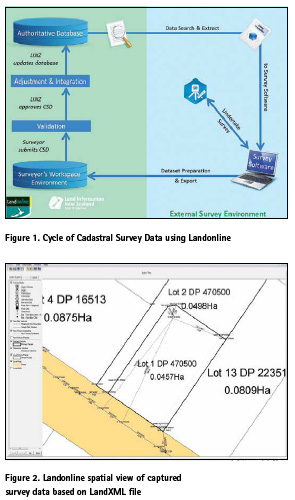
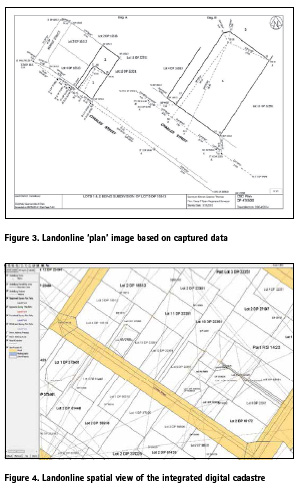
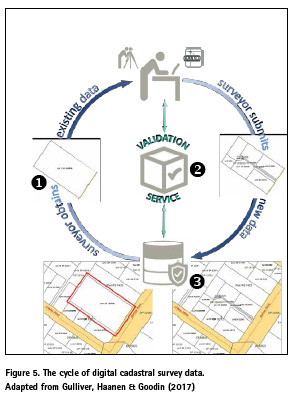
The surveyor then logs into a restricted area in Landonline and imports the LandXML file (see Figure 2) and invokes a series of in-built tests that validate the dataset against various regulatory requirements. They also use tailored software within Landonline to generate diagrams of the survey and parcels that ultimately become the plans of the survey (see Figure 3). The surveyor adds supporting documents, such as a survey report and any supporting graphics, certifies the package, and submits the ‘cadastral survey dataset’ to the national cadastral survey system.
Currently 3D surveys, such as those for multilevel, multiple ownership ‘Unit Title Developments’ are only represented in plan image format – without structured data. Surveyors create these plans using their own software and import them into Landonline as TIFF images.
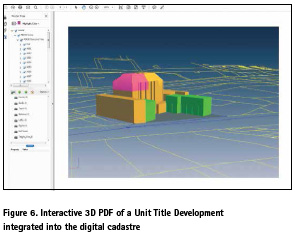
Once the survey dataset successfully passes a final validation process, it is approved and then integrated into the authoritative cadastre. This includes generating accurate coordinates for all the points in terms of the survey control network, and updating the parcel map to show the new parcels (see Figure 4). The resultant information is then made freely available for reuse by all users.
Problems and opportunities
Data Duplicated on Plans
The current Landonline system, which was initially built nearly 20 years ago, was designed to support ‘automation’ through the capture, validation and storage in the cadastre of digital survey data. Surveyors and users, however, insisted that the equivalent of traditional ‘plans’ were still needed (LINZ, 1998).
The system was, therefore, built to enable this and has resulted in the information shown on the plans duplicating that held as data in the dataset. In today’s digital world such duplication is considered inefficient and results in unnecessary compliance costs for the surveyor and ultimately the property developer.
Under the current New Zealand survey regulations, both the data and the plans are legally authoritative and, therefore, have to be correct (Surveyor-General, 2010). The Surveyor-General is currently considering whether to change the regulations that specify the content of a cadastral survey dataset so that they need not include plans. The Cadastral Survey Act 2002 already allows for legislative references to ‘survey plans’ to be synonymous with ‘cadastral survey datasets’. There would be no need, therefore, to change the parent legislation.
In order to avoid this duplication, the primary question is how to ensure that users can visualise the survey dataset without the effort and cost of generating a plan. This is covered in the section below.
Datasets of 3D Surveys
At the time that Landonline was being developed the tools to manage 3D data in the cadastre were not readily available. Consequently the digital versions of paper plans continue to be used for most 3D surveys today – they are not represented in the form of data. Those plans are difficult to create and (with increasing development scale and complexity) can be notoriously difficult to interpret. They consist of multiple plan (‘bird’s-eye’) views, sections, and elevations that have to be combined in the user’s head, or reproduced as perspective or 3D depictions, to envision the actual structure and boundaries. This is exacerbated where the boundaries are neither horizontal or vertical (such as slope or curved boundary surfaces).
A 3D digital dataset of these surveys would enable them to be readily rendered, visualised and interrogated, as well as being tested for 3D gaps and overlaps. The technology is now readily available and the potential benefits are significant (see below).
While the step required to move from plan to data is greater for 3D than for other types of survey (as ‘2D’ surveys are already digitally enabled), that step is not as significant with today’s technological capabilities.
Benefits of digitisation of the Cadastral Survey Process
Putting aside the issue of plans for the moment, making the cadastral survey process fully digital provides significant benefits that can be categorised under the process headings of capture, validation, integration, and reuse:
Capture
The practice of surveying is already fully digitally enabled. Existing digital data from the cadastre is able to be uploaded into survey office applications and field equipment (see in Figure 5), and all new measurements, including from GNSS, are captured digitally. The digital transfer of this data to other applications, particularly survey calculation software, helps avoid errors and ensure the integrity of the survey data.
Validation
Having a digital representation of the survey enables validation tests (e.g., business rules) to be run that help ensure the quality of the dataset. Mathematical, topological, and spatial tests can be applied to the data, including by comparing it to existing data, such as an underlying survey already held in the cadastre. Provision of a ‘Validation Service’ (via an API – Application Programming Interface) that is accessible from both survey software and to cadastral survey system validation staff would provide efficiency (avoiding duplication of tests) and help ensure quality by detecting errors early in the cycle (see 2 in Figure 5).
Integration
Once the survey dataset has been quality assured, it can be safely recorded in the authoritative cadastre. This can be a simple record of each independent survey. However as each parcel boundary is also the boundary of the neighbouring parcel, and the boundaries of that parcel are also common with its neighbours, each survey can be integrated into the cadastral survey network as if the whole country were covered by a single continuous survey network (see 3 in Figure 5).
Re-use
Digital data, including the map of the cadastral survey network, is then available for reuse by surveyors, other land and property professionals, and the many other known and emerging users of cadastral data.
Visualising a dataset without a plan
The previous section has made the case for representing a survey in the form of a structured, digital survey dataset, rather than a static plan image. For most users, including many surveyors, this will be a major challenge as it would break a long-established traditional means of recording the outcome of a survey. The current digital versions of plans are primarily intended to be printable and readable in that form – persisting with the traditional concept that people need something in paper form. Yet we know that virtually all users of the cadastre already undertake their operations in the digital world every day and that a plethora of technologies provide much better ways of presenting and interacting with information – including spatial.For example, surveyors need to be able to see both the overview of the entire survey, as well as the specific detail at, say, a boundary. On plans this is typically achieved through the use of individual diagrams. It is precisely this capability that is inherently available in digital tools for viewing (and printing) digital spatial data.
Bridging the Visualisation Gap
Users of a cadastral survey dataset need to be able to see its data in graphical form. Conveyancers and title registrars in particular currently prefer, at least in terms of the authors’ experience in New Zealand, to have formal documents that provide a persistent record of the parcels and boundaries defined on the survey. These are typically attached to titles and may be recorded in the register.
A number of methods and tools can be used to visualise the data in survey datasets. These include:
▪ Automatic rendering of a dataset as an image file (e.g., the New South Wales service (http://www.nswlrs. com.au/__data/assets/pdf_file/0003/214869/User_ Guide_for_Land_XML.pdf) that renders a LandXML file for all but complex surveys as a TIFF file).
▪ On-the-fly’ display in web-based clients from a suitable service platform (typically also works for 3D). Some of these are now consumer-grade products that are freely available on the web or as apps on mobile devices.
▪ Survey software, GIS, CAD, etc.
▪ PDF reading software that enables spatial viewing of interactive PDFs. These are easily generated from survey and spatial software. These ‘persistent’ files are readily viewed and printed from free and readily available readers which also provide surprisingly powerful tools to spatially interact with the data (illustrated in particular by 3D PDFs (https://helpx.adobe.com/acrobat/using/ displaying-3d-models-pdfs.html) (see Figure 6)).
A significant advantage of many of these approaches is that they allow subsets of the data to be displayed or used for specific purposes – compared to the use of a universal plan which is expected to serve all purposes. This includes the ability to display the cadastral survey data with other data such as base maps, aerial photography, or utility mapping. Exposing well-constructed data offers the ability to filter, view and render the data and integrate it with other data in forms tailored to meet a user’s specific needs.
Conclusion
The value of cadastral survey data is rapidly increasing in line with the movement into the digital age. To truly realise its value, it will be necessary to detach completely from paper-based approaches associated with the past. It will only be then that the efficiencies and effectiveness of a fully digital cadastral survey system will be realised to the benefit of all.
References
Cadastral Survey Act 2002. New Zealand Government.
Corydon, B., Ganesan, V., & Lundqvist, M. (2016). Digital by default: A guide to transforming government. New York: McKinsey & Company.
Gulliver, T., Haanen, A., & Goodin, M. (2017). A 3D Digital Cadastre for New Zealand and the International Opportunity. ISPRS International Journal of Geo-Information, 6(11), 375.
LINZ (1998). Landonline design and build documentation – LINZ internal. New Zealand Government.
Smart Nation and Digital Government Office (2018). Smart Nation Singapore. Singapore Government.
Surveyor-General (2010). Rules for Cadastral Survey 2010. New Zealand Government.
Wellington City Council (2011). Wellington Towards 2040: Smart Capital.
Wellington City Council.
The paper was presented at FIG Congress 2018, Instanbul, Turkey, May 6-11,2018.


 (3 votes, average: 3.00 out of 5)


Leave your response!