| Positioning | |
A new approach for real-time structural monitoring
This work addresses the feasibility of employing low-cost GNSS receivers and MEMS-accelerometers for structural and infrastructures monitoring purposes, in particular as regards vibrations recognition and characterization |
 |
|
 |
|
 |
|
 |
|
 |
|
 |
|
In the context of structural monitoring, GPS technology made possible the structures behaviour monitoring in terms of absolute displacements, relative to a fixed global reference frame.
The accelerometers, typically employed in such a field, were in fact characterized by some limitations in displacement measurements being able to describe relative displacements with respect to their body fixed reference frame. In recent years, with the increasing development and dissemination of structures and infrastructures in urban areas, the response of huge structures to dynamic phenomena as earthquakes, severe winds, traffic loads and thermal behaviour is of great interest.
Monitoring networks which employ dual frequency GPS receivers are now commonly used (Yi et al. (2012)).
These sensors are quite expensive; therefore widespread distribution cannot take place on such a structure. Hence, the employment of low-cost single frequency receivers offers the possibility to overcome such a problem and the growing number of studies are focusing on this topic (Jo et al. (2012)).
In this work, we address the problem of fast oscillatory motions reconstruction through LIS3LV02DQ MEMS-accelerometer (LISMEMS), uBlox 6 (uBlox) single frequency and Leica Viva (Viva) dual frequency GPS receivers, in order to evaluate the performances of the three different sensors and the agreement among their solutions.
VADASE software for realtime displacements estimation
VADASE software has been used to process both dual and single frequency GPS data collected from the two GPS receivers (respectively, Viva and uBlox 6), during experimental trials. VADASE algorithm was successfully proposed in the Global Navigation Satellite Systems seismology (shortly indicated as GNSS seismology) context.
In Colosimo et al. (2011), a first demonstration of VADASE algorithm was presented; its effectiveness was confirmed with the application to the catastrophic Tohoku-Oki earthquake (USGS M = 9.0, March 11, 2011) (Branzanti et al. (2013)) and then to the Emilia earthquake in Italy (USGS M= 6.1, May 20, 2012) (Benedetti et al. (2014a)).
The software is based on the so-called variometric approach, applied on single phase observations continuously collected by a standalone GPS receiver. Standard GPS broadcast products (orbits and clocks), available in realtime, are required. With receiver phase observations and broadcast products, VADASE estimates epoch-by-epoch displacements, basically equivalent to velocities. The velocities are then integrated over the considered time period and displacements are retrieved. Since VADASE does not require either additional technological complexity or a centralized data analysis, in principle, it can be embedded into the GPS receiver firmware and work in real-time.
For these reasons, it could represent a new and efficient strategy in structural monitoring field. In this work we handle only GPS data, but VADASE is capable of working also with GLONASS and Galileo constellations (Colosimo (2013), Benedetti et al. (2014b))”
VADASE analytical basis
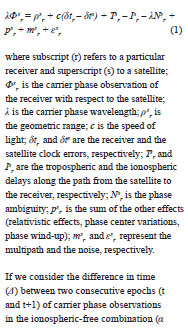
To briefly recall the estimation model of the variometric approach (for a more detailed discussion, please refer to Colosimo et al. (2011), Branzanti et al. (2013), Colosimo (2013)), we start from the standard carrier phase observation equation (in length units):
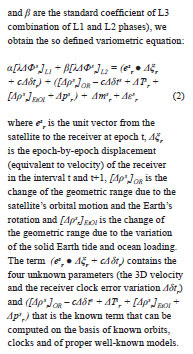
The least squares estimation of the 3D velocities is based upon the entire set of variometric equations (2) written for two consecutive epochs. The number of variometric equations depends on the number of satellites common to the two epochs, and at least four satellites are necessary in order to estimate the four unknown parameters for each couple of epochs.
VADASE for single frequency observations
The variometric equation can be also expressed by considering L1 single frequency observations:
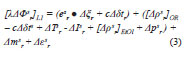
The ionospheric term △Is r represents the variation of ionospheric delay during the interval (t, t+1) and in the current version of VADASE (Benedetti et al. (2014b)). It is modelled according to the Klobuchar model (Klobuchar (1987)) which requires approximate information as geodetic latitude, longitude, elevation angle and azimuth of the particular GPS satellite considered, together with coefficients given by the navigational message. A possible alternative ionospheric model is NeQuick, recently proposed by Radicella (2009), and it will be considered in future developments of VADASE software.
Recent results in GNSS seismology field have shown VADASE software capability in handling single frequency data (L1).
For example, for the Emilia earthquake (Benedetti et al. (2014a)), 7 permanent stations data were processed with VADASE and the solutions were then compared with the ones obtained with other well-established strategies and software. VADASE software was used both applying L3 combination over dual frequency data, both considering L1 data only. The Root Mean Square Error for VADASE L3 solutions with respect to the reference ones are within 1.1 cm in horizontal and within 1.5 cm in height. The agreement in terms of RMSE of the difference between the two solutions (VADASE L3 and VADASE L1), over a 2 minute time interval, is 0.4 cm in horizontal and 1.7 cm in height. The obtained results are very promising and they pave the way to the possibility of a massive use of low-cost GPS receivers for monitoring purposes, which is one of the main goals of this investigation.
Experiments and devices: goals and features
Several experimental tests were performed in order to investigate the capability of LIS-MEMS, Viva and uBlox GPS receivers in retrieving kinematic parameters of oscillatory motions and the solution agreement.
The main goal of this research is to determine the feasibility evaluation of adopting low-cost sensors (GPS receivers and accelerometers) for structural and infrastructural monitoring purposes and perform in future, data processing strategies to integrate the observables provided by the two sensors. Some advantages of an integrated system based on these low-cost sensors can be summarized as follows:
– cheap sensors allow the possibility to set up dense network monitoring, suitable for structures and infrastructures with wide dimensions; redundant observations can be strategic to better describe extended dynamic phenomenon
– as regard the two different technologies, it is well known that accelerometers and GPS receivers can offer complementary contribution for monitoring purposes: for example, a temporary bad sky visibility can harm GPS receiver performances, while accelerometer is also capable of working indoors. In contrast, especially when operating under low acceleration conditions, the performances of MEMS-accelerometers can be influenced by thermal and mechanical noise characteristics (Mohd-Yasin et al. (2010))
– the different details of information provided by the two sensors are complementary: MEMSaccelerometers can usually work at a very high acquisition rate; for example, the LIS-MEMS, used in our trials, is capable to acquire a minimum frequency of 40 Hz, while the uBlox receiver can provide good quality observations, acquiring at (maximum) 5 Hz on the base of our experiences.
In the same time with a GPS sensor, it is possible to know the receiver position in a global reference frame together with accurate time information. Whereas MEMS-accelerometer information refers to a (X,Y,Z) body reference frame and no time stamps are usually given.
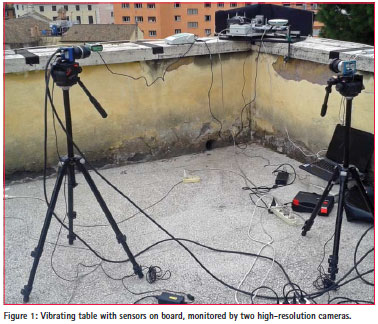
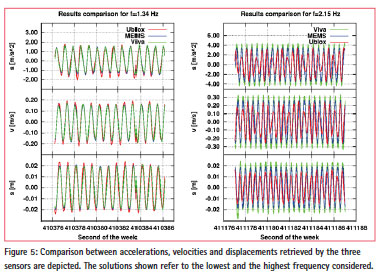
LIS-MEMS, Viva and uBlox GPS receivers have been tested with a simple vibrating table, able to realize onedimensional oscillations, allowing different amplitudes (from 4 to 8 cm) and frequencies (from about 1 Hz to 5 Hz). Unfortunately, it is not possible to set precisely the vibration frequency, which can be roughly changed through a potentiometer. As shown in Figure 1, the three sensors were located over the vibrating table; all the chosen oscillation frequencies were imposed during tests with durations of about 10-12 minutes.
Following, a brief description of the three devices and software interface.
Monitoring with image analysis for test system validation
The test system (vibrating table with uBlox, Viva and LIS-MEMS on board) has been validated using an independent image acquisition system (Figure 1). The goals of this validation were to control that the different sensors undergoing the same motion.
The image acquisition system consisted of a high-speed, high-resolution camera (Mikrotron EoSens) equipped with a Nikon 50-mm focal length lens capturing gray-scale images at up to 500 fps (frames per second) with a resolution of 1280×1024 pixels (for the present set of measurements, images were acquired at 250 fps) and a highspeed camera link digital video recorder operating in full configuration (IO Industries DVR Express® Core) to manage data acquisition and storage. The captured images were transferred to a personal computer under the control of the Express® Core software.
Acquired images have been processed using an image analysis algorithm solving the Optical Flow equation, which defines the conservation of the pixel brightness intensity at time t (I(x,t)):
![]()
where x=(x,y) is the generic pixel coordinate and U=(u,v) is the unknown velocity vector at location x. Since (1) is insufficient to compute the two unknown velocity components (u,v) is computed in a window W=H×V (where H and V are the horizontal and vertical dimension of the window respectively) centered at the pixel location and the solution, i.e., the displacement vector of the interrogation window between two consecutive frames, is determined through a least squares optimization (Moroni and Cenedese, (2005)).
Table 1: An example of retrieved frequency from image processing: the same frequency was found either when features of each element was separately seen (receivers, accelerometer or table) either or all features together (system) were considered.
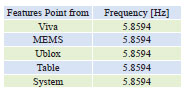
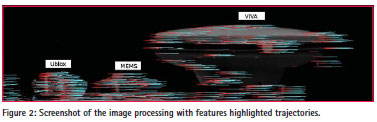
The algorithm, namely PEP (Particle Extraction and Prediction), selects image features (image portions suitable to the tracked because their luminosity remains almost unchanged for small time intervals) and tracks those from frame by frame (Shindler et al., (2012)).
The trajectories are then employed to compute velocity vectors and those belonging to the same frame are arithmetically averaged to compute the time history of both velocity components. By considering the results obtained from image processing, it is possible to state that the velocities of the different sensors and the vibrating table are homogeneous and therefore, fully comparable.
An example of these results is presented in Table 1 while in Figure 2 the velocity reconstructed in time by observing the trajectories of different features relating to each sensor are drawn.
Employed sensors
A Leica Viva GPS receiver was chosen to represent a solution reference to better understand the uBlox capability.
Leica Viva is a geodetic class receiver that is able to acquire in dual frequency from low (< 1 Hz) till very high (50 Hz) sampling rate. In these experiments, an acquisition rate of 10 Hz was deemed sufficient.
uBlox 6 is a low-cost GPS receiver that is able to acquire in single frequency only, from low (< 1 Hz) to high sampling rate (10 Hz). On the basis of previous experiments, it has been set up to work with a frequency rate of 5 Hz, since the observations have to be stored in realtime through a USB connection in an external memory unit (i.e. laptop) and some stream managing problems have been noticed at higher acquisition rates.
The u-center program (available online), used in the 6.2.2.0 release, is a flexible tool for the uBlox/laptop interface and allows the evaluation, analysis and configuration of the receiver.
The LIS3LV02DQ MEMS-accelerometer, provided by STMicroelectronics, was used as integrated in the EK3LV02DQ Evaluation Kit. It is a low-power triaxial linear accelerometer with an acquisition frequency from 40 Hz to 640 Hz and a full scale of ±2g and ±6g.
The software interface used was Unico 0.7.0.5.
These sensors were massively used for manifold applications (O’ Reilly et al. (2008)) as for crash safety, game controllers, personal computers, smartphones and cameras.
Recent studies have demonstrated encouraging results for the suitability of low-cost tri-axial MEMS-accelerometers in civil and geophysical fields, employable for the reconstruction of vibrations and ground motion (Cochran et al. (2009), Zhao M. and X. Xiong (2009), D’Alessandro A. and G. D’Anna (2013)).
Data processing: methods and results
Here, we present the strategy followed to evaluate the performances of the sensors in retrieving kinematic parameters of an oscillatory phenomenon.
MEMS data were analysed as recorded on a personal computer with Unico software interface: accelerations in MEMS body reference frame are given.
Dual and single frequency GPS data were both processed with VADASE software: as previously mentioned, the only input required are observations and navigational files available in real-time.
Starting from MEMS-accelerations and GPS-velocities, we proceeded to data analysis: three experimental tests are considered in this discussion.
From these tests, analysis corresponding to five different frequencies (from about 1 to about 2.2 Hz) will be presented. These frequencies have been chosen from a frequency interval where solutions of the different sensors coexist, in order to allow the comparison of the three sensors. The vibrating table was set at the smallest allowed displacement of 3.95 cm (amplitude 1.975 cm), measured with an accuracy of 0.005 cm.
Spectral analysis
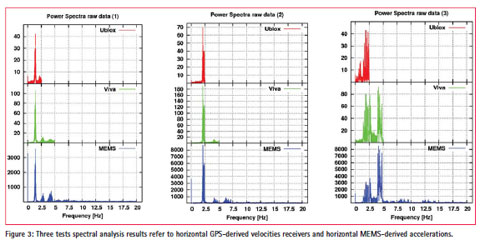
A spectral analysis of MEMSaccelerations and GPS-derived velocities was carried out (Figure 3).
As above mentioned, because of the 5 Hz sampling rate of uBlox receiver (hence, Nyquist frequency is 2.5 Hz), all data were band-pass filtered within 1.0 – 2.5 Hz using a Butterworth filter.
The shape of power spectrum (Figure 3) suggests high correlation of the frequency content tracked by the three sensors. The power spectrum is of course dependent on the sampling frequency adopted (i.e., the MEMS-accelerometer solution power spectrum is much higher than that of uBlox receiver).
LIS-MEMS was fixed on board the table with its y-axis aligned along the direction of oscillation, hence only the y-direction was considered. As regard the GPSderived velocities, VADASE solutions provided East, North and Up components. They were hence combined to consider the motion along the vibration direction.
In Figure 3 the spectra of y-acceleration of LIS-MEMS and GPS receivers planimetric velocities are shown.
Solutions comparison
We used a least squares motion estimation method (LSE) in order to quantify the agreement between the solutions and to estimate kinematic parameters (acceleration, velocity and displacement in a chosen time interval) of the oscillatory phenomenon.
The motion estimation method was formulated under the hypothesis of a constant sinusoidal motion, so that the residual phase shift, the main frequency and the corresponding amplitude were least squares estimated in accordance to the simple model:
![]()
where A, f and φ are respectively amplitude, frequency and phase of GPS (uBlox or Viva) or LIS-MEMS solutions (in Figure 4 the flowchart describing the steps followed to compare different solutions is shown). It is important to recall that the vibrating table is only roughly perfect harmonic oscillator. In this respect, with the aim to perform the estimation, it was necessary to select only short intervals (10 seconds), for which the frequency can be considered constant.
The input data at the beginning of the flowchart are the filtered velocities of the three sensors. As regards LISMEMS velocities in input to the Butterworth filter, they were previously obtained through the integration of the stored accelerations.
The GPS-derived velocities were resampled at 40 Hz (the rate of LIS-MEMS measurements) through cubic splines in order to allow solutions comparison. As regards the time scale, it is necessary to remind that LIS-MEMS observations are given without the corresponding time stamps; for such a reason, these time stamps were a-posteriori reconstructed by adding 0.025 seconds for each observation, starting from the first one. Obviously, this choice does not guarantee that the LIS-MEMS reconstructed time scale is aligned with the GPS time scale, so that a synchronization problem has to be faced.
In detail, the possible time drift between these time scales was estimated and removed accordingly to the following equation:
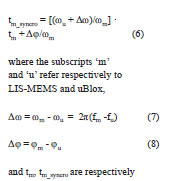
and tm, tm_syncro are respectively MEMS time stamps before and after the synchronization with uBlox, taken as reference. After the synchronization, the correlation between the signals related to positions, velocities and accelerations was computed.
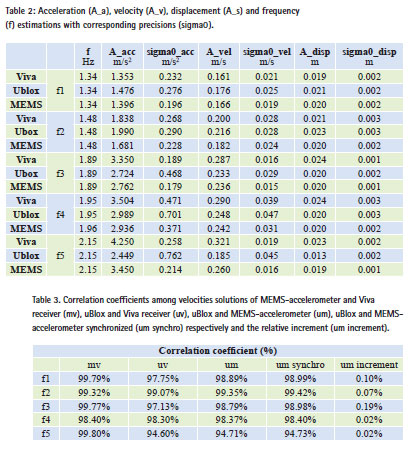
The obtained positions, velocities and accelerations results respectively are reported in Table 2, while in Table 3, cross correlation results among the three sensors are summarized.
Discussion
From the results obtained considering five frequencies (from about 1 to 2.2 Hz) the following remarks can be drawn:
– the sigma0 obtained from the LSE suggests a good precision of the adopted method; the median value calculated among all the solutions amounts to 0.27 m/s2, 0.025 m/s, 0.002 m as regards acceleration, velocity and displacement estimation respectively
– the estimated displacement can be compared with the real amplitude of the vibrating table (0.0198 m): MEMS-accelerometer displacement solutions deviate the reference value by ± 1%, except for the f5 frequency where the solution is underestimated for 5%; uBlox displacement solutions overestimate the reference value from about 2% to 17%, while overestimate 32% at the f5 frequency where uBlox solutions suffer aliasing phenomenon; Viva displacement solutions are characterized by an overestimation from 9% to 15% in comparison with the reference value except for the f1 frequency where the underestimation is about 3%
– the correlation coefficients reported in Table 3 have been calculated by considering 10 seconds of data in input to the estimation method. However, they are representative of a general high correlation between all the results obtained. For tests considered in their entirety, at maximum the coefficients (ρ(MEMS-uBlox), ρ(MEMS-Viva), ρ(Viva-uBlox)) are lower in percentage less than 3.5% with respect to the coefficient here presented
– looking at the obtained results, the 2 Hz frequency seems to represent a sort of threshold: if overcome (as from 1.95 to 2.15 Hz), the uBlox shows significant problems in reconstructing the oscillatory motion due to the aliasing phenomenon
– it is necessary to highlight the synchronization between uBlox receiver and LIS-MEMS observations must be considered as a preliminary attempt. In fact, it will be necessary to consider synchronization model under the hypothesis of different and variable time scale of LISMEMS and uBlox receiver.
However, it can be noted that the synchronization is more effective for low frequencies.
Conclusion
This work addresses the problem of fast oscillatory motions monitoring through LIS3LV02DQ MEMSaccelerometer, uBlox single frequency and Leica Viva dual frequency GPS receivers, in order to evaluate the performances of the three different sensors and their solution agreements. Suitable tests were performed using a vibrating table able to shake the co-located devices with a frequency from about 1 to 5 Hz.
A first spectral analysis was carried out: Figure 3 show the spectra obtained for three tests made and the similar shape suggests high concordance in terms of frequency content between the different solutions set. These starting solutions are accelerations of LIS-MEMS and velocities of the two GPS receivers obtained with VADASE software.
A pass-band filter was then applied in order to consider the frequency band common to the three devices. The filtered data were then given in input to an LSE model in order to estimate kinematic parameters representative of the considered oscillatory motion. Integrating and deriving the starting velocities, the analysis was extended to accelerations and displacements; five frequency oscillations were investigated.
The estimated solutions highlight the uBlox (set to acquire at 5 Hz) capability to reconstruct oscillatory motions with frequencies in the interval of 1 – 1.95 Hz.
The uBlox (5 Hz acquisition rate) displacement estimated amplitude differs from the real amplitude of vibrations (0.0198 m) ranging from 0 to 3.5 mm for frequencies from f1 to f4 (1 – 2 Hz), while for f5 (2.15 Hz), the difference is 6.5 mm due to the aliasing phenomenon.
The Viva (10 Hz acquisition rate) displacement estimated amplitude differs from the real one from 0 to 4 mm, while LIS-MEMS solutions are close to the amplitude reference value within 1 mm.
High level of correlation has been obtained, in particular for frequency lower than 2 Hz where the correlation between LIS-MEMS and uBlox solution is always higher than 98.30%.
Overall, the obtained results are quite promising for possible establishment of structural health monitoring through low-cost MEMSaccelerometers and GPS receivers.
The combined and integrated use of these low-cost sensors in dense network monitoring represents a useful solution to better ensure a more detailed coverage of structures and infrastructures.
The use of low-cost single frequency receivers is allowed by the VADASE software which also ensures the employment of standalone receivers with the possibility to work in real-time.
A next step of this research which will be addressed in the near future, that could be represented by the formulation of MEMS-accelerometer and uBlox receiver data analytical integration.
References
Benedetti E., M. Branzanti, G. Colosimo, A. Mazzoni, M. Crespi (2014b). VADASE: state of the art and new developments of a third way to GNSS Seismology. International Association of Geodesy Symposia, VIII Hotine Marussi Symposium (In Press).
Benedetti E., M. Branzanti, L. Biagi, G. Colosimo, A. Mazzoni, M. Crespi (2014a). GNSS seismology for the 2012 Mw= 6.1 Emilia Earthquake: exploiting the VADASE algorithm. Seismological Research Letters, Volume 85, Issue 3, May-June 2014, pages 649- 656, DOI: 10.1785/0220130094.
Branzanti M., G. Col osimo, M. Crespi, A. Mazzoni (2013). GPS near real-time coseismic displacements for the great Tohoku-Oki earthquake, IEEE Geoscience and Remote Sensing Letters, vol. 10, no. 2, DOI: 10.1109/LGRS.2012.2207704.
Colosimo G., M. Crespi and A. Mazzoni (2011). Real-time GPS seismology with stand-alone receiver: A preliminary feasibility demonstration, Journal of Geophisical Research, vol. 116, Issue 11, DOI: 10.1029/2010JB007941.
Colosimo G. (2013) VADASE: a brand new approach to real-time GNSS seismology, 180 pp., ISSN:9783845438382, Lambert Academic Publishing AG & Co KG.
Cochran E. S. , J. F. Lawrence, A. Kaiser, B. Fry, A. Chung, and C. Christensen (2011). Comparison between low-cost and traditional MEMS-accelerometers: a case study from the M 7.1 Darfield, New Zeland, aftershock deployment, Annals of Geophysics, vol. 54, pp. 728–737.
D’Alessandro A. and G. D’Anna (2013). Suitability of low- cost three-axis MEMSaccelerometer in strong-motion seismology: Tests on lis331dlh (iphone) accelerometer, Bulletin of the Seismological Society of America, vol. 103, pp. 2906–2913.
Jo H., S-H Sim, A. Tatkowski, Spencer Jr. B. F. and Nelson M. E. (2012). Feasibility of displacements monitoring using low-cost GPS receivers. Structural Control Health Monitoring, vol. 20, pages 1240-1254.
Klobuchar J. A. (1987). Ionospheric time-delay algorithm for singlefrequency GPS users , IEEE Transactions on Aerospace and Electronic Systems,vol. AES-23, pp 325–331.
Mohd-Yasin F., D. J. Nagel and C. E. Korman (2010). Noise in MEMS, Measurement Science and Technology, vol. 21, n. 1.
Moroni M., A. Cenedese (2005). Comparison among feature tracking and more consolidated velocimetry image analysis techniques in a fully developed turbulent channel flow. Measurement Science and Technology 16, 2307-2322.
O’ Reilly R., H. Tang, and W. Chen (2008). High-g testing of MEMS devices, and why, IEEE Sensors Conference. Radicella S. M. (2009). The NeQuick model genesis, uses and evolution, Annals of Geophysics, vol. 52, n. 3 – 4.
Shindler L., M. Moroni, A. Cenedese (2012). Using optical flow equation for particle identification and velocity prediction in particle tracking. Applied Mathematics and Computation, 218, 8684–8694. Zhao M. and X. Xiong (2009). A new MEMS-accelerometer applied in civil engineering and its calibration test, Ninth International Conference on Electronic Measurements and Instruments (ICEMI ’09).
Yi T H, Li H N, Gu M. (2012). Recent research and applications of GPS-based monitoring technology for high-rise structures. Structural Control Health Monitoring.
The paper was presented in ENC-GNSS 2014, Rotterdam, Netherlands, 15-17 April.


 (8 votes, average: 2.13 out of 5)


Leave your response!