| GNSS | |
3D deformation analysis using GNSS data
A case study of Penggaron bridge of Semarang-Ungaran toll road section. The results of this study show that there are deformation on eight Penggaron Bridge observation points. The strain has the same pattern with horizontal and vertical movement patterns of the observation points |
 |
|
|
|
Penggaron bridge is located in Semarang-Ungaran toll road, 20th kilometer in Susukan region, East Ungaran, Semarang. According to PT. Transmarga Central Java, The bridge is relatively new and actively used since 2010, but the bridge is visually deformed as indicated by small cracks in some pillars of the bridge.
Trisnawati (2015) states that the influences from nature are suspected to be the main effect of movements and cracks that occured on the bridge. Some pillars are planted in unstable ground that allow the pillars continuously deformed to the maximum limit of the bridge’s strength, that will reduce the estimated age of the bridge. During the year of 2013 to 2016, there are some studies about deformation that is occurred in Penggaron Bridge. The results showed that there was a movement in the monitoring points installed around the Penggaron Bridge. Deformation occurs in Penggaron Bridge almost has the same trend movement, according to Utomo (2013). This theory is also supported by Waluyo’s research (2016). He states that the direction of deformation occurs in Penggaron Bridge has a trend movement toward southwest at all points of observation.
The movement analysis and strain model occured at the observation points around the bridge makes it easier in a bid to cope with the risk of a disaster that happen on the Penggaron Bridge. Geometric analysis method using Modified Least Square (MLS) at the observation point is expected to identify the movement in the observed area. The using of Finite Element (FE) analysis is expected to get the strain values and its model that occur at Penggaron Bridge. Nine stations of ina-CORS BIG observation around the research location are used as a benchmark by considering the network precision.

Research methodology
This research using observational data observation of GNSS deformation monitoring points in Penggaron Bridge in epoch 2015 to 2016. This data consists of the observation data in July 2015, August 2015, September 2015, April 2016, and May 2016. Data observation of nine Ina-CORS BIG around Central Java and Yogyakarta, and 12 IGS station, precise ephemeris, broadcast ephemeris, h-files global, ionosphere correction, meteorology correction according to doy GNSS observations of the Bridge.
GNSS Data Quality Checks
The quality data of RINEX GNSS checked by TEQC. In conducting the qualification to the data, there are some data quality parameters, namely 1) Moving average MP1 and moving average MP2 less than 0.5 m. 2) The value of IOD slips less than 100. 3) The values IOD or MP slips less than 100. 4) The Data which were removed from the overall data amount is relatively small (Lestari, 2006).
Data Processing Using GAMIT/GLOBK
The observation data processing with GAMIT/GLOBK. The results of GAMIT processing are then evaluated by the value postfit nrms and fract. The results of GAMIT match the requirements, if the processing fract value <10 and postfit nrms value <0.25. The computation of velocity vector movement using GLOBK is performed in the entire observation times of the bridge deformation. The calculation is done automatically by inserting the script of velocity computation. After this processing, and then it should be done for plotting velocity vector movement.
Deformation Computation and Analysis
Computation and analysis are done in some observation scenarios. The analysis of the computation is done with congruency and observation point movement test. The coordinates data and its standard deviation that are used in this analysis, are the observation point coordinates and its standard deviation in the toposentric coordinates system which is from the GAMIT/ GLOBK data processing result.
Determine and Test of 3D Strain Parameters
The strain parameters test were determined by Matlab software. The determination of strain parameter are used the coordinates of the observation point between 2015 and 2016 from GLOBK result. The obtained strain parameter is then calculated for its extension and compression values, as well as the angle of the strain for the visualization in the area of my research.
Results and analysis
The results of deformation geometric analysis
The test results demonstrate the value of the network congruency test is the whole scenario calculation is more than 1,962. it means the value of the network congruency test is rejected. It shows that the observation network is change and not congruent in the first and second epoch on the entire processing scenario. The test results show that the value of the movement point test all the observation points is more than 1,740. It means the value of the movement point test rejected This result indicates that all the point have displacement in all coordinates components.
The Results of Velocity Computation
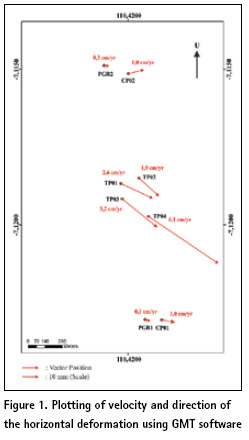
Table 1. shows the horizontal movement velocity and its standard deviation of the observation point Based on Table 1, N component (VN) has velocity values ranging from -0,024 to 3,406 cm/year. All of the observation points have movement horizontally toward the southeast. Figure 1 shows the results of plotting the horizontal velocity movement of the observation point on Penggaron Bridge.
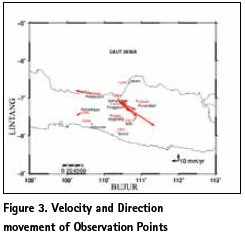
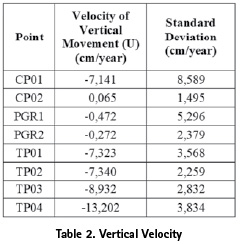
Figure 1 shows that all of the observation points have movement horizontally toward the southeast. In addition, the horizontal displacement processing with GLOBK is also produces vertical movement. Table 2 shows the value of vertical movement and its standard deviation.
Based on Table.2. it shows that, the vertical movement velocity of the observation point have a range 0,065 cm/year to -13,202 cm/year.
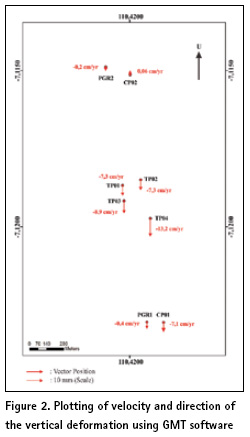
Figure 2 shows the visualisation that the bridge observation points have a vertical movement tend to go down to the surface.
The results from velocity plotting the movement observation points have the same trend towards the movement of the CORS BIG Semarang station.
Figure 1 shows the direction movement of the bridge observation point and the movement of CORS station.
Based on Figure 3, it shows the eight observation points of Penggaron Bridge have the same relative direction, compare to the movement of CORS CSEM station. It is because of the Penggaron Bridge location has a geological conditions similar to CORS CSEM station. Geological conditions which is vulnerable to the ground motion is a condition that potentially be the demage of Semarang’s toll Solo part Semarang-Ungaran km 5+600 to km 8+500 (Trisnawati, 2015)
The Results of Strain Parameter Test
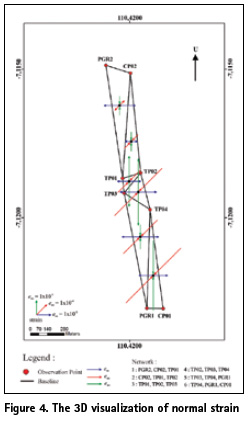
The objectives of this scenarios are to get the value of the strain that are occured from the beginning to the end of the observation. The calculation of this test is done by forming network scenarios to determine the value of strain that occurs at each observations. In this research, the scenarios for strain computation are divided into six network observations. Figure 4 shows the visualization of the results normal strain.
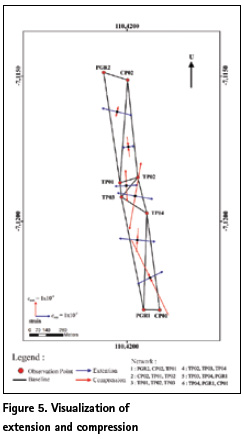
Based on Figure 4, the computation results show the normal and shear strain value with the range from 10-3 fraction to 10- 5, with a value of translation between 0,014 m to 0,084, and with the value of rotation between 4,69×10⁻⁵ to 3,38×10- 3 rad. The computation of extension and compression of six scenarios network, have rotation that are ranged from 10-3 to 10-5 toward the northeast and southeast. While Figure 5 shows the visualization of extension and compression of the six observations network.
Based on the Figure 5 above, it shows that all tests are accepted in all network. It means, the results of similarity test are accepted on the entire networks. While the results of congruency test is in the other way around. It shows that the tests are rejected in all network.
Acknowledgements
This research was supported/partially supported by PT. Geotronix Pratama Indonesia. T. Aris Sunantyo, Nurrohmat Widjajanti who provided insight and expertise that greatly assisted the research.
References
[1] Herring, T.A, King, R.W, dan McClussky, S.C., 2006, Introduction to GAMIT / GLOBK, Department of Earth, Atmospheric, and Planetary Science, Massachusetts Institute of Technology.
[2] Kuang, S., 1996, Geodetic Network Analysis and Optimal Design : Concepts and Applications, Ann Arbor, Inc., Chelsea, Michigan.
[3] Lestari, D., 2015, Analisis Stabilitas Candi Borobudur Berdasar Integrasi Data Pengamatan GPS dan Terestris Jaring Pemantau Deformasi Candi. Desertasi Program Doktor Teknik Geomatika, Program Pascasarjana Fakultas Teknik Universitas Gadjah Mada, Yogyakarta.
[4] Trisnawati, D., 2015, Penentuan Zona Ancaman Gerakan Tanah pada Jalan Tol Semarang–Solo Ruas Semarang–Ungaran km 5+600 s.d. km 8+500 Menggunakan Metode Analytical Hierarchy Process (AHP), Proceeding Seminar Kebumian ke-8, Academia-Industry Linkage, 15- 16 Oktober 2015, Graha Sabha Pramana, Universitas Gadjah Mada, Yogyakarta.
[5] Utomo, A., 2013, Monitoring Pergerakan Struktur Jembatan di Semarang Berbasis Fotogrametri Jarak Dekat (Studi Kasus: Jembatan Tol Semarang Solo Seksi 1 Semarang – Ungaran di km 20 di wilayah Susukan, Ungaran Timur, Kabupaten Semarang), Skripsi Jurusan Teknik Geodesi. Fakultas Teknik, Universitas Diponegoro, Semarang.
[6] Waluyo, S.B., 2016. Analisis Ketelitian Titik Kontrol Horizontal pada Pengukuran Deformasi Jembatan Penggaron Menggunakan Perangkat Lunak GAMIT 10.6. Skripsi Jurusan Teknik Geodesi Fakultas Teknik, Universitas Diponegoro, Semarang.


 (No Ratings Yet)


Leave your response!