| Applications | |
Sea level changes in the 19-20th and 21st centuries
I have read the paper by Hannah (this volume), and I arrive at a totally opposite conclusions, viz. that there is no indication what so ever of a recent sea level acceleration, and that it is the high rates around 3 mm/yr that should be “safely disregarded” |
 |
|
I have read the paper by Hannah (this volume), and I arrive at a totally the opposite conclusions, viz. that there is no indication what so ever of a recent sea level acceleration, and that it is the high rates around 3 mm/yr that should be “safely disregarded”.
In the present paper, I will review some of my own observations and arguments with respect to present sea level changes.
There is only one place in the world where we have a full control of the crustal component, and hence are able to isolate the true eustatic component from the relative sea level changes recorded, and that is the Kattegatt Sea (Mörner, 2014a). Here, the eustatic factor can be closely fixed at 0.9 mm/yr. This implies a value only half of the value favoured by Hannah (this volume) and only about 30% of the value from satellite altimetry – which is far too large differences to be attributed to regional variability.
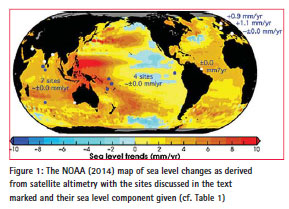
In Figure 1, I have plotted the sites used and the values of sea level changes arrived at on the NOAA map of rates of sea level changes based on satellite altimetry (NOAA, 2014), and in Table 1 further details are added (all to be discussed below).
Sea level complexity
The sea level is changing both vertically and horizontally for several different reasons (as recently reviewed in Mörner, 2013a). At the shore itself, crustal, oceanic and dynamic factors interact in a complicated manner (e.g. Figure 1 of Mörner, 2010a).
At the shore, we make our observations of changes in the coastal environment, usually manifested in the details of the shore morphology. Therefore, our studies have to be diverged to different coastal settings; off-shore environments, hard-rock coasts, sandy coasts, lagoons and lakes. This is how we worked in the Maldives (Mörner et al., 2004; Mörner, 2007a, 2011a; 2013a).
The tide gauges are by necessity located to the shore zone, and generally to river mouths where harbours are located. The oldest tide gauge was installed in Amsterdam in 1682. As the name says, it is an instrument to measure the tides in order to know the best time of entering or leaving a harbour. There was, however, also a long-term consideration. In Sweden and Finland, numerous tide gauges were installed in order to measure the land uplift. If not compensated by continual dredging and lowering of quay constructions (as recently was the case in Stockholm), the harbour had to be dislocated down-streams. In other parts of the world, a river mouth usually also implies a delta area, which predominantly is subjected to a long-term subsidence. This means that tide gauges in such environments are likely to be affected by a subsidence factor, which has to be quantified in order to asses true sea level rise. The sediments themselves are subjected to compaction, especially if loaded by a heavy harbour construction (where the tide gauge was used to be placed). Coastal waterwithdrawal has resulted in high-rate subsidence in places like Bangkok and Nirita in Japan. Therefore, a global set of tide gauges (away from uplifted areas) has a tendency of overestimating the sea level rise (Mörner, 2004, 2010a, 2013a).
The Indian Ocean
In the Maldives, we have very strict morphological evidence of a sea level stability over the last 30 years (Mörner, 2007a, 2011a; Mörner et al., 2004). The tide gauges show incomplete cyclic patterns (Mörner, 2010a, 2011a). If there is any trend hidden, it seems to be less than 1.0 mm/yr. The morphology of numerous coastal sites shows an absence of any rising trend (Mörner, 2007b). The sea level curve of the last 500 years is backed up by numerous data from different coastal settings, and repeated at several atolls (Figure 2a).
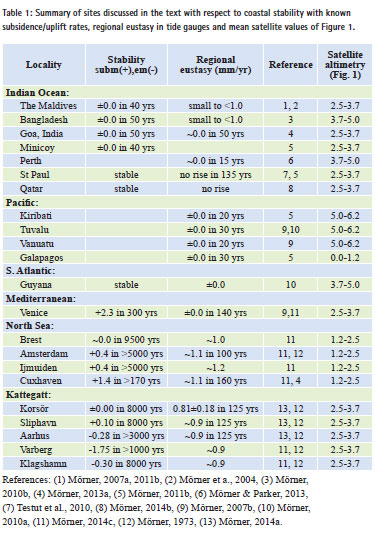
Bangladesh is another region, which has been doomed to be severely flooded in the near future. My observations in the area (Mörner 2010b) give a totally different picture, however, with a lowering in 1955-1962 followed by 50 years of stable sea level conditions around zero (Figure 2b).
In Goa, India, I was able to obtain a very detained record of the sea level changes over the last 400 years (Mörner, 2013a) as illustrated in Figure 2c. We have morphological, archaeological and an old painting documenting a high level in the 17th century and a low level in the 18th century. Multiple morphological data provide firm records of a recent sea level lowering, followed by 50 years of stability around zero. The tide gauges both in Mumbai and in Visakhapatnam (on each side of India) record a 12 cm drop in sea level between 1955 and 1962 (Mörner, 2010b, Figure 12). are similar data indicating a recent fall in sea level followed by stable conditions (Mörner, 2011a, Figure 6).
The Fremantle tide gauge at Perth gives an interesting record (Mörner and Parker, 2013, Figure 2) changing from 6.0-6.5 mm/yr for short-term cyclic behaviour of the last decades, to a long-term mean trend of 1.5 mm/yr, which transform into little or no rise at all, if calibrated for eustasy. A zero trend is recorded for 15 years but may extend over the last 60 years.
In St Paul Island, there is a long-term record (Testut et al., 2010), which gives no sea level rise at all over the last 135 years. In Qatar, there are excellent coastal records indicating a long-term stability of the present coastal regime (Mörner, 2014b).
So, over most of the Indian Ocean, it is hard to find any records of a present sea level rise. In contrast to the satellite altimetry map of NOAA (Figure 1), suggesting variable rates sea level rise ranging from 2.5 to 5.0 mm/yr; i.e. far from what is actually observed. I take this as a strong argument that there is something basically wrong with the satellite reconstruction (cf. Mörner, 2010c).
The Pacific
This is an enormously large ocean. Still, I restrict my analysis to a few islands, because they have been used as examples of a rapid on-going flooding. The only actual facts we have in order to assess the coastal stability are the tide gauge records (Mörner, 2011b). Kiribati has been claimed to be in the process of being flooded. The tide gauge record shows no such trend, however; only a variability around a flat zero level (Mörner, 201lb).
Tuvalu is a classical site – like the Maldives – in the claim of an on-going flooding. The tide gauge, going back to 1978, shows no such trend, however (Mörner, 2007b, 2010a). After an initial compaction subsidence 1978-1984, the record indicates coastal stability for the last 30 years (punctuated by three major ENSO events). Vanuatu was claimed to be in the process of flooding. Still, the tide gauge shows no such trend; just a stability over the last 20 years of recording (Mörner, 2007b).
The Galapagos lies in an area often shown to be in the process of a sea level lowering. Even here, the tide gauge gives a mean trend of zero (Mörner, 2011b).
The disagreement between satellite altimetry values and tide gauge observations cannot be more different. One data set must be in serious errors. Personally, I favour the tide gauge observations (Mörner, 2007b, 2010a, 2011b) indicating little or no actual sea level rise.
Australia lies between the Pacific and Indian Oceans. Mörner and Parker (2013) have assessed its tide gauge records; the 39 mainland stations give a mean value of 0.9 mm/yr, the 70 non-official stations give a mean value of 0,1 mm/yr, and all the 86 official station give a mean value of 1.5 mm/yr, which made the authors to conclude that the true eustatic factor was to be found in the sector between 0.1 and 1.5 mm/yr, i.e. far below the value proposed by White et al. (2014) and Whitehead & Associates (2014), but well in harmony with the values here proposed (Mörner, 2013a, 2013b).
French Guyana and Surinam
From French Guyana and Surinam, there is an excellent sea level record, which shows the 18.6 tidal cycle for 2.5 full cycles (Gratiot et al., 2008; Mörner, 2010a). The cyclic behaviour shows ups and downs around a stable zero level of ±0.0 mm/ yr (Mörner, 2010a, Figure 3). For the same area, satellite altimetry gives a rise of about 3.0 mm/yr. “There is a message in this difference”, to say the least.
Venice
The long-term subsidence rate of this part of the Po delta is very well recorded over the last 300 years (Mörner, 2007b) at a mean rate of 2.3 mm/yr. The tide gauge record gives a relative sea level rise of 2.3 mm/yr for the past 140 years (PSMSL, 2014), implying a eustatic component of ±0.0 mm/yr over the past 140 years, with a negative trend after 1970 (Mörner, 2007b).
The North Sea
Many sites along the southeast coast of the North Sea are dominated by a longterm postglacial crustal subsidence. In Amsterdam, the subsidence is known to be of a rate of 0.4 mm/yr (Mörner, 1973; Kooijmans, 1974), a value that should also apply for the Ijmuiden tide gauge. At Cuxhaven, the subsidence is estimated at 1.4 mm/ yr (Mörner, 2010c, 2013a). Brest, on the other hand, seems to represent a more or less stable area over the last 10,000 years (Mörner, 1969, 1973). With the crustal component reasonably well established, we can assess the eustatic components from the tide gauge values presented by PSMSL (2014); viz. 1.0 mm/ yr for Brest, 1.1 mm/yr for Amsterdam, 1.2 mm/yr for Ijmuiden and 1.1 for Cuxhaven.
Therefore, it seems fair to conclude that the eustatic component of the North Sea region has been in the order of 1.1 mm/yr for the last 100-150 years.
The satellite altimetry data (Figure 1) give a general rise in the area of 1.8 ±0.6 mm/yr (Table 1). If that value would be valid, all the classical sites of subsidence would instead be uplifting areas, which is out of the question for solid geological facts (Mörner, 1996, 2004, 2013a).
The Kattegatt Sea
I have recently discussed the eustatic component in the Kattegatt Sea (Mörner, 2014a). Because the crustal component is known in such great details (Mörner, 1969, 1971) and the zero isobase of uplift has remained stable for the last 8000 years (Mörner, 1973, 2014a), the regional eustatic component can be isolated and determined with a high precision for the last 125 years; viz. at 0.8 mm/yr in Korsör, 0.9 mm/yr in Sliphaven, and 0.9 mm/yr in Aarhus (Mörner, 2014a), and 0.9 mm/yr in Varberg and 0.9 mm/ yr in Klagshamn (Mörner 2014c).
Consequently, we can firmly set the mean eustatic component at 0.9 mm/yr for the last 125 years. Because I previously recorded a eustatic rise of 1.1 mm/yr for the period 1830-1930 (Mörner, 1973), we can also conclude that there cannot be any recent acceleration recorded.
Comparing rates
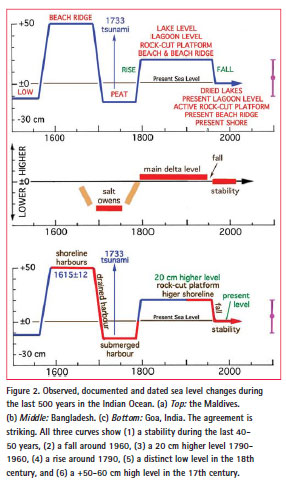
Figure 3 gives a histogram of the tide gage records used by University of Colorado (UC, 2013) in their global sea level assessment. The mean of 182 sites (excluding a few out-layers) scattered all over the globe is 1.6 mm/yr (Mörner, 2013a, 2013b). Because of long-term subsidence of many river mouth sites and site-specific compaction problems (as discussed under Section 2, above), this value may, in fact, represent a slightly too high value. The key sites here discussed provide values of about 0.0 mm/yr, and the Kattegatt and North Sea records give firm values around 1.0 ±0.1 mm/yr (Figure 1).
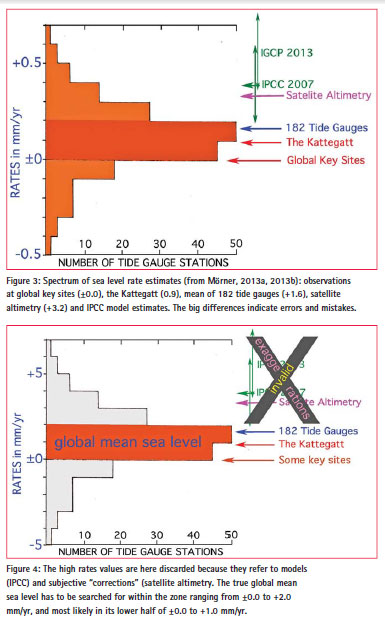
This data set is in deep conflict with the high rates proposed by the IPCC (2007, 2013) and satellite altimetry (NOAA, 2014). In Figure 4, I therefore propose that those data sets should be “safely disregarded” (to use the terminology of Hannah, 2014), and claim that the mean global eustatic component is to be found in the zone ranging from +2.0 mm/yr to ±0.0 mm/yr, and most probably in the lower half of this zone; i.e. within 1.0–0.0 mm/yr.
Setting frames and likelihoods
The INQUA Commission on “Sea Level Changes and Coastal Evolution” (consisting of some 400 sea level specialists) had the issue of possible future sea level up at five international meetings, and arrived at a best estimate of +10 ±10 cm by years 2100 (INQUA, 2000). Personally, I later updated this value at +5 ±15 cm by year 2100 (Mörner, 2004).
There are certain physical and observational facts we have to consider because they set the frames of what can be considered possible and what must be discarded as not possible (Mörner, 2011c). Below follows four of the most important ones:
(1) No present sea level rise can exceed 10 mm/yr, because this value was the mean rate of rise during the most intensive phase of postglacial deglaciation (Mörner, 2011c, 2013a). Any present rise must be considerably lower.
(2) Thermal expansion is zero at the coasts (Mörner, 2010c, 2013a).
(3) We are moving into a new Solar Grand Minimum, which in analogy with previous ones is likely to generate cold climate and glacial expansion (Mörner, 2010d, 2011d; Mörner et al., 2013) that might lead to a minor lowering in sea level (Mörner, 2013b, Figure 2).
(4) Firm geological records indicate that the North Sea basin and the southeastern parts of the Unites States are subsiding as a function of long-term glacial isostasy (Mörner, 1969, 1973; Newman et al., 1971). These trends can, of course, not be reversed (as the discarded high values in Figure 3 and 4 would imply). The same applies for uplifting coasts. In Stockholm, for example, the absolute rate of uplift has been 4.9 mm/yr, at least for the last 3000 years. PSMSL (2014) gives a tide gauge value of -3.8 mm/yr, which sets the eustatic factor at +1.1 mm/yr. This is the same value as established by Mörner (1973) for the period 1850-1930, implying the absence of acceleration in the last decades.
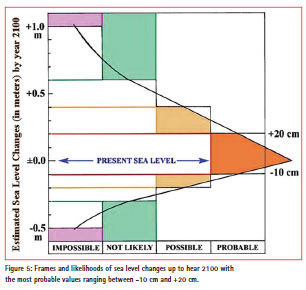
With this in mind, I have in Figure 5 assessed the frames and likelihoods of future sea level changes.
As “impossible” maximum rise and minimum fall of sea level by year 2100, we can quite safely set +1.0 m and -0.5 m.
As “not likely”, I put values exceeding +0.6 m and -0.3 m.
As “possible”, I put values up to +0.4 m and down to -0.2 m.
As “probable”, I put values below +20 cm and above -10 cm.
This gives a graphical peak at around present zero with an uncertainty range of +20 to -10 cm.
Conclusions
The present global eustatic changes have to be confined to rates between +2.0 and 0.0 mm/yr, with a preference to the lower half of this zone; i.e. +1.0 to 0.0 mm/yr (Figure 3 and 5).
In view of this, it is the highvalues of the IPCC models and satellite altimetry that have to be “safely disregarded” (Figure 4).
Therefore, my best estimate of the amount of sea level change by year 2100 is +5 ±15 cm, which is nothing to worry about.
References
Gratiot, N., Anthony, E.J., Gardel, A., Gaucherel, C., Proisy, C., Wells, J.T., (2008). Significant contribution of the 18.6 year tidal cycle to regional coastal changes. Nature Geoscience, 1, 169–172. doi:10.1038/ngeo127.
Hannah, J., (2014). Climate related sea level change – An inconvenient fact or an irritating fiction? Coordinates Magazine, Volume X, Issue 10, 8-14.
INQUA, (2000). Sea Level Changes and Coastal Evolution, www.pog. su.se, (from 2005: www.pog.nu).
IPCC, (2007). Fourth Assessment Report. The Intergovernmental Panel of Climate Change.
IPCC, (2013). Fifth Assessment Report. The Intergovernmental Panel of Climate Change.
Kooijmans, L.P.L., (1974). The Reine/ Meuse delta: four studies on its prehistoric occupation and Holocene geology, E.J. Brill (Leiden), 1-421.
Mörner, N.-A., (1969). The Late Quaternary history of the Kattegatt Sea and the Swedish West Coast: deglaciation, shorelevel displacement, chronology, isostasy and eustasy. Sveriges Geol. Undersökning, C-640, 1-487.
Mörner, N.-A., (1971). Eustatic changes during the last 20,000 years and a method of separating the isostatic and eustatic factors in an uplifted area. Palaeogeogr. Palaeoclim. Palaeoecol., 9, 153-181.
Mörner, N.-A., (1973). Sea level changes and Earth’s rate of rotation. J. Coastal Res., 8, 966-971.
Mörner, N.-A., (2004). Estimating future sea level changes from past records,
Mörner, N.-A., (1996). Sea level variability. Z. Geomorph. N.F., Suppl.Bd. 102, 223-232.
Mörner, N.-A., (2007a). Sea level changes and tsunamis. environmental stress and migration over the seas. Internationales Asienforum, 38, 353-374.
Mörner, N.-A., (2007b).The Greatest Lie Ever Told. P&G-print, 1st 2007, 2nd ed. 2009, 3rd ed. 2010.
Mörner, N.-A., (2010a). Some problems in the reconstruction of mean sea level and its changes with time. Quaternary International, 221, 3-8.
Mörner, N.-A., (2010b). Sea level changes in Bangladesh: new observational facts. Energy & Environment, 21, 235-249.
Mörner, N.-A., (2010c). There is no alarming sea level rise! 21st Century Science & Technology, Winter 2010/2011, 12-22.
Mörner, N.-A., (2010d). Solar Minima, Earth’s Rotation and Little Ice Ages in the Past and in the Future. The North Atlantic – European case. Global Planetary Change, 72, 282-293. http://dx.doi.org/10.1016/j. gloplacha.2010.01.004
Mörner, N.-A., (2011a). The Maldives as a measure of sea level and sea level ethics. In: Easterbrook, D.J., ed., Evidence-based Climate Science, Elsevier, 2011, Chapter 7, 197-209.
Mörner, N.-A., (2011b). Mörner, N.-A., (2011c). Setting the frames of expected future sea level changes by exploring past geological sea level records. In: Easterbrook, D.J., ed., Evidence-based Climate Science, Elsevier, 2011, Chapter 6, 185-196. Mörner, N.-A., (2011d). Arctic environment by the middle of this century. Energy & Environment, 22, 207-218.
Mörner, N.-A., (2013a). Sea level changes: past records and future expectations. Energy & Environment, 24, 509-536.
Mörner, N.-A., (2013b). Sea level changes: a short comment. Global Climate Status Report, Sept. 2013, 5-9.
Mörner, N.-A., (2014a). Deriving the eustatic sea level component in the Kattegatt Sea. Global Perspectives on Geography, 2, 15-21.
Mörner, N.-A., (2014b). The flooding of Ur in Mesopotamia in new perspectives. Submitted.
Mörner, N.-A., (2014c). Danger over: no sea level rise along the Norwegian coasts. Lecture at Oslo University on Sept. 9, 2014.
Mörner, N.-A. and Parker, A., (2013). Present-to-future sea level changes: The Australian case. Environmental Science An Indian Journal, 8 (2), 43-51.
Mörner, N.-A., Tattersall, R., Solheim, J.-E. and 16 others, (2013). General conclusions regarding the planetarysolar- terrestrial interaction. Pattern Recogn. Physics, 2, 205-206.
Mörner, N-A., Tooley, M., and Possnert, G., (2004). New perspectives for the future of the Maldives, Global and Planetary Change 40, 177-182.
Newman, W.S., Fairbridge, R.W. and March, S., (1971). Marginal subsidence of glaciated areas: United States, Baltic and North Seas. In: Etudes sur le Quaternaire dans le Monde. Union Inter. L’Etude Quaternaire, M. Ters, Ed., 2, 795-801.
NOAA, (2014). Laboratory for satellite altimetry/sea level rise. Sea level trend map. http://www.star.nesdis.noaa.gov/ sod/lsa/SeaLevelRise/
PSMSL, (2014). Table of relative mean sea level secular trends derived from PSMSL RLR data. http://www.psmsl. org/products/trends/trends.txt
Testut, L., Miguez, B.M., Wöppelmann, G., Tiphaneau, P., Pouvreau, N. and Karpytchev, M., (2010). Sea level at Saint Paul Island, southern Indian Ocean, from 1874 to the present. J. Geophys. Res., 115, C12028, 10. pp, doi:10.1029/2010JC006404
UC, University of Colorado, (2013). Sea Level Research Group of University of Colorado, http://sealevel.colorado.edu/
Haigh, I.D., Church, J,A., Koen, T., Watson, C.S., Pritchard, T.R., Watson, P.J., Burgette, R.J., McInnes, K.L., You, Z.-J., Zhang, X. and Tregoning, P.,Earth
ScienceReviews
Whitehead & Associates, (2014).
South coast regional sea level rise
policy and planning framework
http://esc.nsw.gov.au/inside-council/projectand-
exhibitions/public-exhibition/onexhibition/
south-coast-regional-sealevel-
rise-planning-and-policy-response/
South-Coast-Regional-Sea-Level-Rise-
Policy-and-Planning-Framework.pdf


 (77 votes, average: 4.78 out of 5)


Your examples ignore the contribution of GNSS CORS to monitor uplift and subsidence of tide gauges especially in subsidence prone areas. You will find that most rigorous studies in the last 10 years have confirmed a sea level rise of between 2-3 mm/yr after tide gauge observations have been corrected for gauge uplift and subsidence.
Leave your response!