| Navigation | |
Comprehension of the Eye of the Navigator
This article presents Eye Tracking data that has been collected on board the world’s fastest littoral combat ship, compared with similar datasets collected in a bridge navigation simulator |
 |
|
 |
|
The increased use of technology and more advanced Integrated Navigation Systems (INS) has changed the focus of the Navigator. Electronic Chart and Display Information System (ECDIS) has become mandatory on most ships to provide the Officer of the Watch (OOW) with increased situational awareness (1). In earlier days, the navigator had to find and fix the position of the vessel using paper charts, peloruses, sextants, etc. (2), whereas nowadays the navigator’s role is to monitor the position provided. Today the navigator’s attention is drawn towards the ECDIS, where the position is provided most commonly by a Global Navigation Satellite System (GNSS) such as NAVSTAR Global Positioning System (GPS). The result is a new generation of navigators, who in turn are very comfortable with the use of computers (3). The trust in the position given by the GPS is found to be high, and research has shown that it takes time before the navigator detects an error in the position source (4, 5). This phenomenon may be described as a «PlayStation-mode», and the Maritime Accident Investigation Branch (MAIB) has recently introduced the term ECDISassisted groundings (6). To avoid ECDISassisted groundings, the navigator has to perform continuous integrity monitoring of the system, primarily through visual comparison of the ships’ surroundings with how its position is presented in the ECDIS; e.g. a position fix with multiple bearings. Integrity monitoring can also be performed in the INS, known as conventional control (7). An example is comparison of the RADAR and the ECDIS with the use of RADAR overlay.
The layout and functional design of a navigation bridge has been through a paradigm shift with the introduction of electronic navigation aids to assist the navigator in planning and performing a safe passage. However, statistics show that navigational error still accounts for half the accidents in Norwegian littoral waters (8). It is therefore imperative that those of us who thrive in the maritime domain, learn how to better understand user behavior, and to use this knowledge to develop integrated navigation systems that further support the navigator in planning, monitoring and controlling the safety of navigation and progress of the ship. To improve performance, the user must identify which tasks to prioritize and separate each into primary and secondary tasks (9). Knowing this, a scanning pattern can be constructed which will limit fixation and improve performance.
This article reviews the use of maritime simulators in navigation training, and identifies possible areas for improvement in human system integration (HSI) and graphical user interface (GUI) by the use of Eye Tracking data. The Eye Tracking data has been reviewed by the author in an earlier article, where the data collected suggested that field study data is similar to simulator study data, and thus simulator navigation training is efficient and should be further developed (10).
Method
Skjold-class Corvette
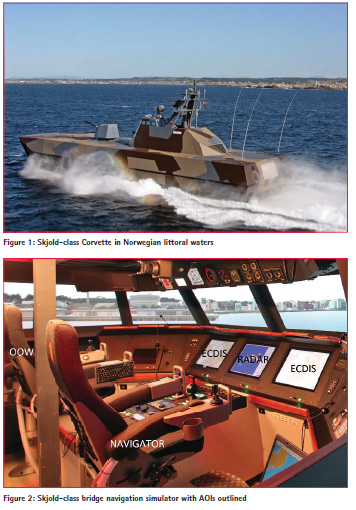
The Skjold-class coastal Corvette was inaugurated by the Royal Norwegian Navy (RNoN) in 2010 and is designed to operate along the Norwegian coastline (Figure 1). The vessel is 50 meters long and is characterized by its stealth design and catamaran hull. The vessel can operate in speed up to 60 knots, making the Skjoldclass the fastest armed ship in the world (11).
The many fjords, underwater reefs and a large amount of skerries characterize the Norwegian coastline. Weather conditions can be harsh, and especially the Artic environment with its strong winds, high seas and preticipation makes navigation in this area extremely challenging.
Participants
Four experienced navigators participated in the field study and live study. All participants are graduates from the Royal Norwegian Naval Academy (RNoNA), and have the theory for Deck Officer Certificate class 1. Median age of the participants is 30 years.
Navigation Bridge Simulator
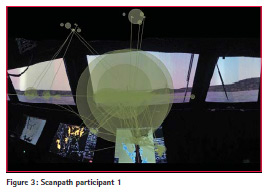
The Royal Norwegian Navy Navigation Competence Centre (NavComCen) contains a simulator system (NavSim) consisting of seven separate bridge layouts. The simulators are used in education of new navigators and in scenario-based training of existing navigators. One of these cubicles is an exact replica of the Skjold-class corvette bridge, with the same layout, design, hardware and software (1:1 Skjold-class bridge simulator) as shown in Figure 2. The visual scene is constructed by seven LED-projectors providing a seamless 210-degree picture in front, and two 42” fl at screens that generates an aft view image for the navigation team, all in 1280×1024 resolution.
Eye Tracking
The data set is collected by secondgeneration ETG from SensoMotoric Instruments (SMI ETG 2w©). The SMI ETG can record native, binocular eye tracking up to 120 Hz with a gaze tracking accuracy of 0,5°. Gaze tracking range is limited to 80° horizontal angle and 60° vertical angle, with a resolution of 1280×960. SMI ETG 2w© is compatible with contact lenses and most vision correction spectacles, and it is possible to conduct live validation of gaze tracking quality. Calibration is performed with the use of one or three-point calibration process, and it is possible to conduct calibration when processing the data in BeGaze. The data set generation is a manual process using the BeGaze software from SMI (12).
Eye Tracking equipment has been used to evaluate, understand and improve the training process on ships’ navigational bridge simulator (10).
Procedure
Participants were instructed to conduct a standard watch and to perform route monitoring as normal. Route planning was prepared in advance of the trials, and was not within the scope of this research project. All participants were accustomed with both the Skjold class Bridge and the use of the simulator. Each participant conducted 2-4 trials in the live study and in the simulator, and each trial had a median of 10 minutes. 16 datasets were collected among the participants with a total duration of 2 hours and 36 minutes.
Restrictions in availability of databases in the simulator made it necessary to conduct the simulator study and the field study in two different parts of Norway. However, the simulator study area and the field study area are similar enough in topography, navigational challenges to require the same sets of skill and behaviour of the navigators.
Results
Before analysing the data in BeGaze, Areas of Interest (AOI) were defined (Figure 2). The definition of the AOIs was generated in a pre-study in the simulator, where eye movement data was analysed to identify which areas on the bridge held the navigators` attention. This resulted in the establishment of seven AOIs:
1. Outside (out the bridge window), AOIO
2. ECDIS, AOIE
3. Route Monitor window, AOIM (Lower right corner of ECDIS, ref Fig. 7)
4. RADAR, AOIR
5. Display (Electromagnetic Log repeater, EML), AOID
6. Consoles (Throttle and autopilot), AOIC
7. White space (Area left outside of the AOIs), AOIW
Nine Key Performance Indicators (KPI) was generated for the AOIs:
1. Sequence: Order of gaze hits into the AOIs based on entry time. Lowest entry time – first in Sequence.
2. Entry time: Average duration for the first fixation in the AOI. Identify time spent on first fixation in the AOI.
3. Dwell time: The sum of all fixations and saccades within the AOI. Identify the visual attention for the participant.
4. Hit ratio: How many subjects looked at least one time into the AOI. Identify the use of AOIs.
5. Revisits: How many visits the subjects made into the AOI. Identify the use of AOIs with regards to glances.
6. Revisitors: Number of subjects with more than one visit in AOI. Identify number of subjects that looked into the AOI at least 2 times.
7. Average fixation: The average of the fixation time in the specific AOI. E.g. identify mental and cognitive workload.
8. First fixation: In ms how long the first fixation for selected subject in AOI lasted. E.g. identify patterns and workloads.
9. Fixation count: Number of all fixations in AOI. E.g. identify complexity of AOI. Fixation is defined as the state when the eye remains still over a period of time (in this study <80ms). Saccade is defined as the rapid motion from one fixation to another (13).
By analyzing the Eye Tracking data, statistics were generated which could be further analyzed. These statistics consisted of KPI data in the AOIs, scanpaths, focus maps, heat maps and sequence charts (10).
Human Machine Interface
Human factor related considerations is identified as a top priority in military systems design to reduce life cycle costs and optimize human and system performance (14). One of these goals are met through Human Factors Engineering (HFE) in order to maximize the users’ ability to perform at required levels for operation, maintenance and support by considering human capabilities and limitations and eliminating design-induced errors (15). An electronic system should be able to communicate information about its status to an operator through displays and the operator will evaluate these inputs before communicating how he or she wants the machine’s status to change by manipulating controls. The ECDIS is designed to enhance safety of navigation, and should provide the navigator with better situational awareness and free time for the navigator to monitor the surroundings of the ship. In order to optimize the navigators scan pattern it should be possible to adjust the information order (GUI) and the placement of the displays (layout) related to the operator.
Bridge Design
By analyzing scanpaths, focus maps and sequence charts in the Eye Tracker data collected, interesting observations concerning human machine interface were made. Lingering focus on certain displays or instruments steals time and attention from the primary focus area of the navigator (outside the windows), and can be identified by analyzing scanpaths and sequence charts (16). This includes the general design of the bridge as well as the graphical user interface (GUI) of the ECDIS software (SW).
Furthermore, possible improvements in the general arrangement of the bridge design can be revealed through the use of visualization related techniques to annotate regions or objects on the stimulus that are of special interest to the user (16).
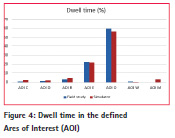
Scanpath refers to the fairly abstract concept of a fixed path that is characteristic to a specific participant and viewing pattern (13). In Figure 3 the scanpath of participant 1 is visualized, and the duration of the fixation is shown by the size of the circles. The data collected reveals that the primary gaze area for the navigator is outside of the ship (AOIO), explicitly expressed by the Dwell time statistics. Figure 4 shows the dwell time for the navigator to be 59,7% in the field study, and 56,4% in the simulator study in AOIO (10).
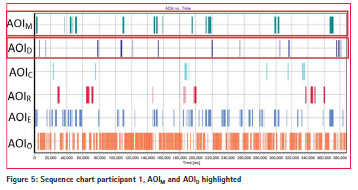
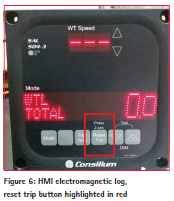
The primary task for the navigator is to conduct a safe passage. Monitoring the surroundings and controlling the INS is an important task, and every navigators` attention should be focused mainly to the outside of the ship (3). Sequence charts illustrates the visual fixation periods within an AOI along the timeline (13). Figure 5 shows the distribution of visual attention of the navigator for each of the AOIs. By highlighting the Display area (AOID), together with analyzing the dwell time for AOID, there is an indication that the time spent focusing on AOID in some periods are substantial and disturbs the desired focus on AOIO.
AOID consist of an electromagnetic log (Figure 6). The electromagnetic log is designed so that you have to press and hold a button for 2 seconds in order to reset the trip meter. The navigator resets this button for every change of course typically during the turning phase of the ship, which is a critical phase for conduction of safe navigation. The illustration in Figure 4 indicates a less than optimal design since it removes the navigator’s attention from what should have been the primary area of interest, outside the window of the bridge (AOIO).
The reset-button is co-located with five other identical buttons (Figure 6) and is therefore difficult to find unless you look directly at the instrument. The suboptimal design of the buttons, along with the placement of the instrument, marks it as one of the time-stealing displays for a Skjold bridge navigator. It is also important to highlight that this procedure is conducted in the turning phase of the ship, which is a critical phase of the passage. A less time consuming placement could be to place the resetbutton on the Arm Rest Panel (ARP), closer to the navigators’ fingertips.
Graphical user interface (GUI)
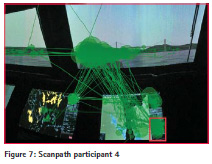
Concerning graphical user interface (GUI) on a modern ship’s bridge, the ECDIS SW is of particular interest to analyze. A typical scanpath (Figure 7) illustrates how much visual attention is given to the lower right corner of the ECDIS GUI, which is the Route Monitor window (AOIM).
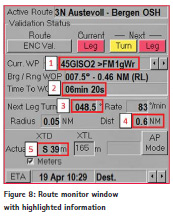
The Route Monitor window (AOIM) informs the navigator of critical information such as turning point and heading mark, and is shown in Figure 8.
The information in the Route Monitor window is a combination of number and letters, providing quick and intuitive feedback for the navigator to interpret. The information which is of highest importance for the navigator is marked with red boxes and numbered accordingly in Figure 8:
1. Information regarding turning point and next heading mark
2. Time to Wheel over Point
3. Next course
4. Next leg distance
5. Cross track distance from planned leg
The sequence chart in Figure 5 illustrates how the navigator’s attention is drawn from looking outside (AOIO) to focus on ECDIS (AOIE), and especially on the Route Monitor window (AOIM) in the lower right corner of the ECDIS GUI. Comparisons of the participants’ scanpath and sequence chart suggests that the operation of extracting information from the Route Monitor window is time consuming, and therefore reduces time spent looking outside (AOIO). Some reasons for this may be the size of the numbers and letters, which the navigators express are difficult and time consuming to read and process, and the location of the Route Monitor window (lower right corner of ECDIS GUI) which may increase the information extraction time. These observations suggest that the Skjold class ECDIS Route Monitor GUI should be remodeled and tested for usability in order to minimize time used to extract this information.
Discussion
Science is based on empiricism, which means pursuing knowledge by observation. These observations can range from uncontrolled, direct observations within natural settings to tightly controlled experiments in artificial settings. Measurements are said to be reliable if we get similar values when we measure the same thing more than once (9). The research performed in earlier studies (10) shows that there is enough similarity between the Skjold simulator and the actual vessel to make them sufficiently comparable concerning the navigator’s attention, fixation and behavior. This suggests that proper design in a bridge simulator can enable valid tests as to how well a navigator will perform in a real environment with the requirements and demands found there. It may also allow for redesign (if necessary) of the simulator navigation systems after analyzing the test results. Ultimately, this may result in improved software and hardware capabilities and remodeling of the bridge’s general arrangement. As long as there is a proven similarity between the simulator environment and the ship bridge itself, you will ensure that the design can be fitted on real systems in real environments.
Conclusion
The use of Eye Tracking equipment as a tool to develop maritime navigation has a clear potential. Data from Eye Tracking can be analyzed to identify pros and cons concerning bridge layout and GUI to identify visual attention thieves. Analyzing different data sources such as scanpath, sequence charts and KPIs from the eye tracking data set, gives valuable insight about bridge design and layout of bridge equipment and identifying poor GUIs which disrupts the primary task of the navigator.
Ship’s bridge design that are sufficiently comparable in a simulator and onboard will make it possible to perform unobtrusive tests and observations in a simulator that will inform training interventions and optimize bridge design.
Future work
Scanpaths can provide valuable information of a navigator’s area of interest and subsequent behavior. An ideal scanpath, of the task of interest, would be presented as a straight line from one object to a specified target, and deviance from this ideal scanpath can be interpreted as a hindrance to desired visual attention. Future work should look into, and suggest, recommendations for optimal visual scanning of the surroundings of the maritime navigator.
This topics and findings in this article also indicates a strong potential for future simulator studies in order to optimize the ECDIS GUI.
Acknowledgment
The RNoNA sponsored this work. Special thanks to the Simulator Department at RNoNA and participants from the RNoN.
References
[1] IMO. Resolution MSC.232(82). Adopted on 5 December 2006 ed. London: IMO; 2006.
[2] Kjerstad N. Navigasjon for maritime studier: Tapir Akademisk Forlag; 2010.
[3] Norris A. Integrated Bridge Systems vol 2 ECDIS and Positioning. London: Nautical Institute; 2010. 215 p.
[4] Shaw G, Grant A, Williams P, Voy MD, editors. Mitigating the effects of GNSS Interference – GLA monitoring and update on eLoran. GNSS Interference, Detection and Monitoring Event; 2011: Digital Systems KTN (Location & Timing).
[5] Hareide OS. Control of position sensor input to ECDIS on High Speed Craft. Nottingham: University of Nottingham; 2013.
[6] MAIB. Ecdis-assisted grounding MARS Report 200930. London: Marine Accident Investigation Branch, 2008.
[7] Hareide OS. Electronic Chars – Require a high degree of control. Navigare. 2014(1):24-8.
[8] Directorate NM. Ulykkesutvikling 2000 – 2010. Haugesund: 2011.
[9] Proctor RW, Van Zandt T. Human Factors in Simple and Complex Systems, Second Edition: CRC Press; 2008.
[10] Hareide OS, Ostnes R. Comparative Study of the Skjold-Class Bridge- and Simulator Navigation Training. European Journal of Navigation. 2016;14(4):57.
[11] UMOE. Skjold Class Corvette UMOE Web Page2011 [02.03.2016]. Available from: http://www.um.no/ web/um200.nsf/pages/C10AC32D5D.
[12] SMI. BeGaze Manual: SMI; 2011. 316 p.
[13] Holmqvist K, Nyström M, Andersson R, Dewhurst R, Jarodzka H, Van de Weijer J. Eye tracking: A comprehensive guide to methods and measures: OUP Oxford; 2011.
[14] NPS. Human Systems Integration NPS Homepage: NPS; 2015 [cited 2016 02.05.2016]. Available from: http://www.nps.edu/Academics/ Schools/GSOIS/Departments/ OR/HSI/index.html.
[15] Army US. MANPRINT Handbook – Manpower and Personnel Integration. Washington D.C.: Office of the Deputy Chief of Staff; 2005.
[16] Blascheck T, Kurzhals K, Raschke M, Burch M, Weiskopf D, Ertl T, editors. State-of-the-art of visualization for eye tracking data. Proceedings of EuroVis; 2014.
The author can be contacted at oddsveinung.hareide@sksk.mil.no
The paper was presented at ENC 2016, 30 May – 2 June 2016, Helsinki, Finland


 (No Ratings Yet)


Leave your response!