| SDI | |
An SDI Model to Spatially Enable Peri-Urban Areas in Mozambique
The City of Maputo lacks accessible telecommunications spatial datasets and databases for its planning community, local governmental agencies, local businesses, utilities and telecommunications companies, and the general public |
 |
|
 |
|
The majority of telephony service subscribers in the City of Maputo – Mozambique’s capital and largest city – are from mobile networks. However, the level of Quality of Service (QoS) and mobile coverage offered by current licensed carriers remains a challenge in peri-urban areas, which are areas with mixed rural and urban features with a lack of urban attributes such as accessibility, services, infrastructure, etc., (Allen, 2003).
The current spatial distribution of 3G mobile cell towers is not in accordance to the dynamics caused by the population growth since the last national census. It requires improvement, achieved by the formulation of spatial planning frameworks. The National Institute of Communications of Mozambique (INCM) – the telecommunications regulatory authority – lacks an appropriate framework to monitor QoS in a common environment to spatially evaluate the coverage of licensed carriers and protect the interests of mobile subscribers.
In this context, open source tools such as QGIS and paid software from Esri (ArcGIS) were used to allow manipulating, visualizing and analysing INCM captured data in 2013, used to visualize the full distribution of 3G cell towers across Maputo. The results were linked to the census data provided by the National Institute of Statistics (INE) to evaluate the appropriateness of the current allocation of telecommunications resources. This is where the focus of the data analysis relied: evaluating how the distribution of current 3G cell towers accommodates the five urban zones from Maputo, and how the visualization could support decision-making to INCM as a regulatory authority, to improve QoS and mobile network performance.
The findings from the case study served as an input to develop a specific Spatial Data Infrastructure (SDI) model for Maputo to help respond to the research problem of this study – the non-existence of a common platform for data sharing and exchange to facilitate decision-making for infrastructure planning (especially in the context of telecommunications) – using three-tier architecture, to offer holistic and more coordinated planning in peri-urban areas in the City of Maputo.
Introduction
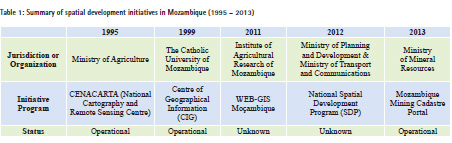
The need is growing for data to be organized across different organizations and jurisdictional levels for planning purposes. The City of Maputo lacks accessible telecommunications spatial datasets and databases for its planning community, local governmental agencies, local businesses, utilities and telecommunications companies, and the general public. There are SDI and spatial development initiatives in Mozambique (shown in Table 1), however, neither of them established a common platform with shared access to integrate telecommunications spatial data and services for infrastructure planning.
Further, INCM’s current framework does not provide spatial visualization to allow effective decision-making over current issues associated with public telecommunications services. For instance, licensed carriers are required to submit statistical reports to INCM on a regular basis. One of the things being reported is the complete inventory of cell towers, also used to evaluate the level of QoS and mobile coverage over a certain area. The reports are submitted on a previously agreed template, in Excel format. Proximity patterns however, are hard to see in spreadsheets. These are not effective to support decision-making.
About the study area
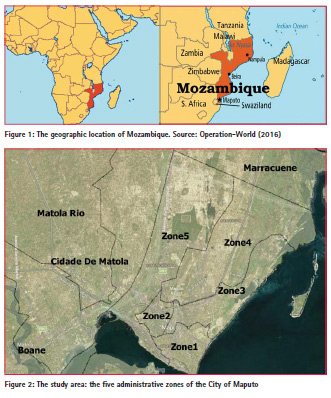
Mozambique is located in the South-East part of Africa (Figure 1). It has boundaries with six countries: Tanzania to the north, Malawi and Zambia to the north-west, Zimbabwe to the west, South Africa to the south and Swaziland to the South-West. It has a coastline on the Indian Ocean to the east of approximately 2500 kilometres. The country has an overall area of 799,380 square kilometres and a population of 26,423,623 million people (INE, 2014). The major cities are Maputo in the south, Nampula in the north, and Beira in the centre. As a previous Portuguese colony, Mozambique adopted Portuguese as its official language. Metical is the national currency and the greatest contributors to the economy are agriculture, fisheries and exports.
Study area: the city of maputo
The City of Maputo has an area of 347 square kilometres (INE, 2011) divided into seven administrative zones: KaMpfumo (zone 1), KaNhlamankulu (zone 2), KaMaxakeni (zone 3), KaMavota (zone 4), KaMubukwana (zone 5), KaTembe (zone 6) and KaNyaca (zone 7). Figure 2 shows the selected study area. Zones 6 and 7 were not considered for being geographically displaced from the mainland.
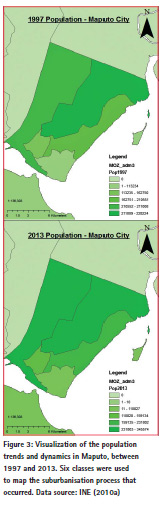
Since the late 1990s, Maputo population has been migrating from dense metropolitan areas to adjacent and accessible peri-urban areas in search of better residential and lifestyle opportunities while continuing to work in the city. KaMavota (zone 4) and KaMubukwana (zone 5), were the urban zones which registered the greatest impact on population growth. These are considered peri-urban regions, which are areas with mixed rural and urban features with a lack of urban attributes such as accessibility, services, infrastructure, etc.,(Allen, 2003). The result of the suburbanisation process occurred is presented in Figure 3, as mapped in ArcGIS using six distinct classes.
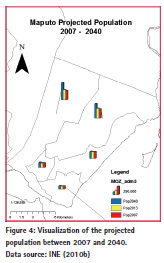
According to INE data, Maputo will be experiencing further suburbanization until 2040. Figure 4 maps the projected population for the 2007- 2040 period , according to INE (2010b), also produced in ArcGIS.
SDI and latest trends in development models
The literature revealed that the effective use of general infrastructure for developmental purposes (whether for telecommunications, water systems, transportation, strategic planning, etc.), is dependent on the availability of Spatial Information (Isa (2016). This is supported by SDI as a strong decision-making tool. The concept of SDI, however, has evolved over the past decade. Its evolution divides SDI into three generations as suggested by Sadeghi-Niaraki et al. (2010): data-centric SDI, process-centric SDI, and user-centric SDI. In the first two generations, SDI users were passive recipients of the spatial data being shared, whereas in the user-centric generation, the users are active receivers as their interests are taken into account.
Several ways were found to define SDI as a tool to improve decision-making. Toomanian (2012) defined SDI as a mechanism to facilitate spatial data by providing an environment for essential collaboration and cooperation among different organizations. SDI pioneers Rajabifard and Williamson (2001), defined it as an initiative intended to create an environment in which stakeholders are able to cooperate and interact with technology to better achieve their spatial information objectives at different political and administrative levels.
Also from the literature, Roche (2014) proposed that for a society to be regarded as spatially enabled, citizens must be spatially literate followed by the existence of an environment to open and share spatial data. Therefore, Maputo should be able to support critical spatial thinking if it considers the adoption of certain components to facilitate the coordination of comprehensive strategic spatial policies.
Various SDI models and architectures were reviewed in different contexts of planning, including telecommunications. Mansourian et al. (2005) model, initially developed to facilitate disaster response, presented a high level of detail clarifying the five SDI components originally proposed by Rajabifard and Williamson (2001), making it almost a classic template for SDI modelling.
The model proved to be useful, particularly in reducing the time response by a third. This was achieved by having the required information available and accessible, as well as conducting appropriate planning prior to operational responses, crucial in disaster and emergency situations. This relates to what the problem is in Maputo, although in a different context – that is, resolving spatial data issues within the telecommunications sector for proper resource allocation to serve the growing demand in a timely and effective manner. Recent models from Coutinho-Rodrigues et al. (2011), Barik and Samaddar (2014) and Painho et al. (2015), showed that trends in SDI conceptual models and architectures used for planning applications are oriented to:
1. SDI as a Spatial Decision Support System (SDSS)
• Specifically, SDI as a decisionmaking tool for investment options for infrastructure planning;
• Using multi-criteria decision support methods (MCDA).
2. SDI models with 3-tier architecture, consisting of client/presentation layer, application/service layer and data storage layer based on open source software.
3. SDI third generation: process-centric to user-centric models, supported by questionnaires and interviews methodology, to better consider the interests of stakeholders.
4. Naming SDI models and initiatives with a suggestive acronym based on context and applicability.
These four points summarize the contributions of the literature to this research. Specifically, The Modelo Digital
– the name of Painho et al. (2015) system
– was of relevance as it is a complete SDI for managing and sharing spatial data for partnerships, developed in the Zambezi Valley in the Central-North of Mozambique. Finally, frustrated SDI initiatives in Western Africa inspired Dekolo and Oduwaye (2014) to develop a generic roadmap for SDI development in African cities in the context of urban and spatial planning. This was used in this study, supported by a case study approach in the telecommunications sector, to benefit the planning community in Maputo
Case study: Mobile telecommunications operators
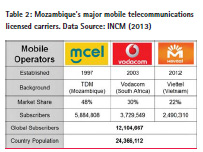
According to INCM’s 2013 annual report, Mozambique had 71 telecommunications service providers. This included 1 fixed operator, 3 mobile operators, 3 broadband operators for national access, 2 broadband operators for international access, 25 internet service providers, 3 cable TV operators, 3 satellite TV operators, 1 global mobile operator, and 30 value-added services operators.
The current mobile licensed carriers are summarized in Table 2. They operate in both 2G and 3G technologies with fairly good coverage in metropolitan areas. Moçambique Cellular (MCEL) was the country’s very first mobile service provider, established in 1997. It is owned by TDM and holds about 48% of the market, corresponding to 5,884,808 subscribers. In 2003, Vodacom Moçambique (VODACOM) was established – the country’s second mobile service operator. It is owned by Vodafone South Africa and holds about 30% of the market, or 3,729,549 subscribers. Movitel is the country’s third licensed carrier, established in 2012. It is owned by Vietnam’s Viettel and holds about 22% of the market, corresponding to 2,490,310 subscribers (INCM, 2013).
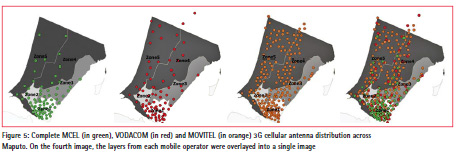
Figures 5 visualises the complete 3G cellular antenna distribution for each mobile operator, as produced in QGIS using the INCM collected data and INE projected population until 2013. During this period, half of the city population lived in KaMubukwana (zone 5) and KaMavota (zone 4). According to the last census, these were also the peri-urban areas with the greatest impact on population growth, and are darkly shaded. KaMaxakeni (zone 3) followed in population growth and is shaded with neutral gray. The city metropolitan centre – KaMpfumo (zone 1) and KaNhlamankulu (zone 2) – registered little impact on population growth and are mapped in lighter grey tones.
The maps show that, except for Movitel, the current allocation of 3G cell towers is inappropriate particularly for Mcel and Vodacom, in zones 4 and 5. This will not allow for acceptable QoS levels if mobile subscribers in the affected areas wish to use media services apart from web browsing. In addition, the allocation of the telecommunication antennas is not in accordance to the area size of each urban zone in Maputo. KaMpfumo (zone 1), KaNhlamankulu (zone 2) and KaMaxakeni (zone 3), have an area as small as 12, 8 and 12 square kilometres, respectively. The areas of KaMavota (zone 4) and KaMubukwana (zone 5), however, are of 108 and 53 square kilometres, respectively. Yet, the higher density of tower distribution is in zones 1 and 2.
The SDI development model
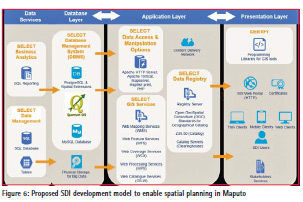
Recent trends in SDI development models suggest the adoption of three-tier architecture with: database, application/ service and presentation/client tier layers. As stated by Roche (2014), the unification of geospatial standards is one of the requirements to achieve spatial enablement. Therefore, Open Geospatial Consortium (OGC) standards along with e-Government interoperability framework for Mozambique (eGIF4M) are proposed in the SDI model to freely open and share spatial data. Based on the findings and results in the context of the literature, the following SDI model was proposed.
In the database layer, QGIS is proposed to create the geospatial database of the telecommunications resources and other fundamental datasets. PostgreSQL is to be implemented as a DBMS with the aid of PostGIS to support geometry, topology, data validation, coordinate transformation and network analysis (Painho et al., 2015). MySQL is proposed to store security aspects as well as nonspatial data for decision-making, as suggested by Barik and Samaddar (2014).
Following Barik and Samadar’s modular concept to allow for (1) publishing web service descriptions, and (2) submitting requests to discover web services of relevance to SDI users, the application layer is suggested to handle one application server and one GIS server. Web Map Service (WMS), Web Features Service (WFS), Web Coverage Services (WCS), Web Catalogue Service (CSW) and Web Processing Services (WPS) are proposed for impairing geospatial web capabilities through GeoServer, GeoNetwork, GeoWebCache and WAMP. For alphanumeric and GIS data sharing, exchange and manipulation, Apache HTTP Server, Apache Tomcat and Mapserver are proposed. Mapfish Print is suggested to facilitate map print reports in various formats such as PDF, PNG and JPG (Painho et al. (2015). PHP is proposed as a programming language for its wide compatibility with most web servers and operating systems. The data registry is to allow for data discovery and access to the metadata and clearinghouse using OGC standards for Geographical Catalogues. Protocol Z39.50 allows searching and retrieving data from the database.
The authors of the SDI Cookbook recommended organizations use OpenGIS Consortium Catalogue Services Specification – version 2.0.2 – for metadata publishing. They also recommended SDI participants to register the catalogue servers with GEOSS Component and Service Registry (CSR) for easy data discovery (Infrastructures, 2004). As well, this can be used to discover relevant spatial data for telecommunications network propagation planning purposes. Finally, for the presentation layer, programming languages that allow the development of GIS tools for the internet should be identified accordingly. PHP (Hypertext Pre-Processor), JSP (Java Server Pages) and GeoExt (GeoExtension) languages can be used to allow for scripting and integration with Open Layers. As suggested by Coutinho-Rodrigues et al. (2011), a human interface such as a user friendly web portal should support visualization alternatives and spatial analysis. To enhance mobility and data access at anytime and anywhere, it is proposed that the SDI web portal be accessible from mobile devices and thin clients.
Leassons learnt and recommendations to INCM
Urbanization triggered by suburbanization has been reforming Maputo. The results revealed that urban zones 1, 2 and 3 will notice minimal variance while zones 4 and 5 are expected to increase by 62% and 92%, respectively. This means that by 2040, at least 65% of Maputo’s population is expected to be living in the current peri-urban regions of KaMavota and KaMubukwana. In addition, these are Maputo’s largest urban zones with areas of 53 and 108 km2, respectively. Yet, Mcel and Vodacom lack 3G cellular antennas within these locations.
Current SDI initiatives in Mozambique do not have telecommunications layers to support future development planning in the sector, and there is no metadata information in most of the layers available. Overall, current GIS projects and SDIs are private and corporate. They are not connected to a common platform to be shared with other corporations and jurisdictions, targeting investment and development in the same region, or to promote reuse of the data. Hence, some of the current SDI and spatial development initiatives do not provide a holistic approach to maximising the interconnectivity and shareability of spatial information between government institutions.
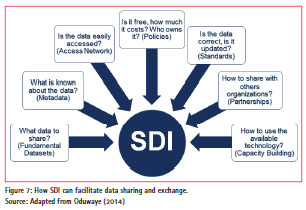
Two government agencies in Mozambique with interests in telecommunications policies were found from the case study: the ICT National Institute (INTIC) and INCM. INTIC is responsible for all Internet and ICT policies, including the implementation of the e-Government Strategy approved in 2006 (INTIC, 2016). In 2010 it developed the e-Government interoperability framework for Mozambique (eGIF4M) to enable interoperability access in the public sector where a total of 125 standards were considered: 39 for Networks and Infrastructure, 19 for Process Interoperability, and 67 for Semantic Data Interoperability. The second agency with interests in telecommunications policies is INCM, responsible for regulating the telecommunications and postal sectors. Due to bureaucracy, the licencing process becomes a long process as opposed to if the information was strategically shared and exchanged on a common enabling platform, easily accessible to every stakeholder (Figure 7).
Governments need to leverage the current spatial information technologies to enable informed decision-making on social, economic, and environmental issues. As a governmental agency, the demonstrated spatial visualization will support INCM in:
• Assessing licensed carriers’ network performance and respective QoS;
• Evaluating how mobile operators can improve their network planning. This can be achieved by spatially allocating future antennas in a more coordinated manner to accommodate the growing demand, particularly in KaMubukwana and KaMavota areas;
• Monitoring if 2G antennas should be replaced by 3G antennas at certain sites. As per International Telecommunications Unit (ITU) reports, mobile data usage is increasing. Data services should be provided at acceptable speeds; and
• Creating new products to generate more revenue, if implemented accordingly.
A planning framework is thus required to bring together a divided sprawling city and achieve effective city planning. Maputo needs a framework that accommodates data sharing and exchange across multiple disciplines (including telecommunications), encouraging creativity and the development of new products and services. The foundation of an SDI to support infrastructure planning through SDFs will aid addressing these and more, including the dataset’s high cost and the need for consistent, welldocumented and accurate data.
References
ALLEN, A. 2003. Environmental planning and management of the peri-urban interface: perspectives on an emerging field. Environment and urbanization, 15, 135-148.
BARIK, R. K. & SAMADDAR, A. B. Service Oriented Architecture Based SDI Model for Education Sector in India. 2014. Springer, 555-562.
COUTINHO-RODRIG UES, J., SIMÃO, A. & ANTUNES, C. H. 2011. A GISbased multicriteria spatial decision support system for planning urban infrastructures. Decision Support Systems, 51, 720-726.
DEKOLO, S. & OD UWAYE, L. Building Spatial Data Infrastructures for Spatial Planning in African Cities: the Lagos Experience.
INCM 2013. Info rmação Sobre o Sector das Comunicações em Moçambique. Maputo: INCM – Instituto Nacional de Comunicações de Moçambique.
INE 2010a. III Recenseamento Geral da População e Habitação, 2007 Indicadores Socio-Demográficos Distritais – MAPUTO CIDADE. Instituto Nacional de Estatística.
INE 2010b. Proj ecções Anuais da População Total, Urbana e Rural, dos Distritos da Cidade de Maputo 2007 – 2040. Instituto Nacional de Estatística.
INE 2011. Estat ísticas do Distrito de Cidade De Maputo. Instituto Nacional de Estatística. INE 2014. Mozam bique in Figures. In: ESTATÍSTICA, I. N. D. (ed.). Instituto Nacional de Estatística.
INFRASTRUCTURES , D. S. D. 2004. the SDI Cookbook. GSDI/Nebert.
INTIC. 2016. In stituto Nacional de Tecnologias de Informação e Comunicação [Online]. INTIC. Available: http://www.intic.gov.mz/ [Accessed 28 May 2016 2016].
ISA, M. Z. 2016 . SPATIAL DATA INFRASTRUCTURE (SDI) FOR SUSTAINABLE DEVELOPMENT IN AFRICA. Development, 4.
MANSOURIAN, A., RAJABIFARD, A. & ZOEJ, M. J. V. 2005. Development of a web-based GIS using SDI for disaster management. Geo-information for disaster management. Springer.
ODUWAYE, S. D. A. L. 2014. Building Spatial Data Infrastructure for Spatial Planning in African Cities: The Lagos Experience.
OPERATION-WORLD . 2016. Operation World – Mozambique Republic of Mozambique – Africa [Online]. Available: http://www.operationworld.org/moza [Accessed May 03 2016 2016].
PAINHO, M., ALM EIDA, L. M., MARTINS, H., ADELINO, A. & OLIVEIRA, P. 2015. {SPATIAL DATA INFRASTRUCTURE FOR THE ZAMBEZI VALLEY (MOZAMBIQUE)}.
RAJABIFARD, A. & WILLIAMSON, I. P. 2001. Spatial data infrastructures: concept, SDI hierarchy and future directions.
ROCHE, S. 2014. Geographic Information Science I Why does a smart city need to be spatially enabled? Progress in Human Geography, 38, 703-711.
SADEGHI-NIARAKI , A., RAJABIFARD, A., KIM, K. & SEO, J. Ontology based SDI to facilitate spatially enabled society. 2010. 19-22.
TOOMANIAN, A. 2 012. Methods to improve and evaluate spatial data infrastructures.


 (2 votes, average: 3.00 out of 5)


Leave your response!