| GIS | |
3D+t Acoustic Fields Modelling Based on Intelligent GIS
The approach described in this paper considers the development and implementation of the W2 concept and technology for the underwater acoustics’ problems solving |
 |
|
 |
|
 |
|
 |
|
 |
|
Currently a lot of basic and applied research in hydroacoustics mainly considers resources of various types, including models’ and calculated problems’ libraries. Similar to the Internet and network resources, the hydro acoustic models development is an actual task.
The above selected problem is a component of a process that solves a problem of developing the IGIS modeling environment for acoustics as stated in [1]. The cornerstone in this research chain specification (statement) was laid in an attempt to develop a dynamic and adaptive computer model for the acoustic fields calculation by some combined complex methods (beam/ ray and wave acoustics) developed by Konstantin Avilov [2, 3]. The biggest problem of Avilov’s approach is a need to possess actual data about many phenomena in the water, surface, air and bottom. Today as a rule there exist no statistical data accurate enough; also only several possibilities are available that provide the current data about real time conditions from real time systems, for instance, like ‘Argo’ [4].
The given paper attempts to demonstrate the advantages of W2 implementation for solving the above hydroacoustics problem. As an example of tasks, the passive location has been selected; the IGIS case study based on the paper authors’ experience has been selected to illustrate the W2 capacities [5].
Main essentialities (entities) of the passive location equations and their decomposition are considered. Such decomposition gives a possibility to see the dependence of equations on the current data from geo media. At that, the notations of equations by Urick R J [6] are taken as a source description. The material presented in this paper proposes a subject domain description composed together by non-programming mathematical and acoustics experts. One can see a complex geo medium structure of the selected subject domain and a need to have distributed and heterogeneous W2 network (Intranet or Internet).
Short description of the W2 network and some requirements are given in Section III. As a result of this consideration, a conclusion is achieved that W2 network should be developed under Network Centric Operations principles.
A discussion on the IGIS implementation of W2 network as systems of some interfaces and as a container of the network web services has also been suggested. Also there are presented visual 3D representation results of modeling on IGIS and illustration of complexity of the geo media as an argument in favor of developing the W2 technology.
Fundamental basis
Let us discuss the main equation of an acoustic location and detect the dependence of some parts of the equation on hydroacoustics environment. According to Urick R J [6], the active and passivesonar equations look as follows:
The active-sonar equation:
SL – 2TL + TS = RL + DT;
The passive-sonar equation:
SL – TL = NL – DI + DT, (1)
where:
SL – Projector Source Level;
TL – Transmission Loss;
NL – Self-Noise Level;
DI – Receiving Directivity Index;
DT – Detection Threshold.
The object-oriented analysis of (1) has shown that first of all, it is necessary to perform an object-oriented decomposition based on the following ‘class’ notion. So, main classes of the passive sonar equation (1) are:
Sonar System, Sources of Sound and Medium. From this point of view, parts of equation (1) can be collected as follows.
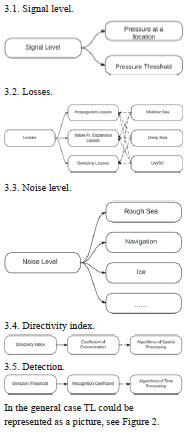
1. Equipment (Sonar System): Projector Source Level (SL); Self-Noise Level (NL); Receiving Directivity Index (DI); Detection Threshold (DT).
2. Medium: Transmission Loss (TL); Reverberation Level (RL); Ambient-Noise Level (NL).
3. Target: Target Strength (TS); Target Source Level (SL).
According to the above information, there exist three main parts of the equation (Sonar System, Targets and Medium) that in the general case depend on each other. And it is important to know data about the defined area. It should be noted that data regarding the defined area are changing in various time scales: during the day periods, from season to season, and from year to year. This information is important and allows us to detect time of observation for receiving actual data. Type of information (data) and period of observation form a set of requirements for the W2 devices and technology. Relevant information can be helpful for understanding requirements for the measurement devices’ locations: water (depth of installation), air, space, land, link type (wireless or traditional), requested period of time and other.
The sea and its boundaries (surface, bottom) form a remarkably complex medium for sound propagation. Parameter of transmission losses expresses the magnitude of one phenomenon of many associated with the sound propagation in sea, and is caused by:
1. spreading loss (a geometrical effect representing the regular weakening of the sound signal as it spreads outwards from the source);
2. attenuation loss (includes some effects as follows: absorption, scattering, diffraction and refraction);
3. sound scattering layers; and
4. boundaries.
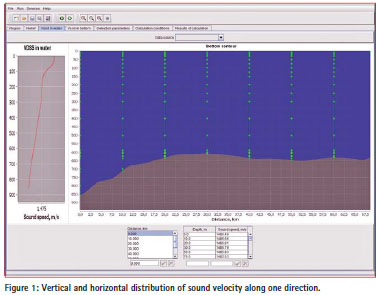
An example of velocity distribution is shown in Figure 1.
It is difficult to develop really useful equations or experimental data of transmission losses (TL) in a general case. As a rule, it is necessary to consider at least the following three phenomena.
Shallow water
TL is calculated for three regions, each region is characterized by their own averaged decay law. Parameter H which provides the definition of these regions’ boundaries is calculated using Marsh’s and Shulkin’s formula [9]:
![]()
where h – water depth; ho – thickness of isothermal layer.
The spherical decay law is applied to the distance r < H. At the distance H < r < 8 H TL varies in inverse proportion to the distance raised to the power of three halves and depends heavily on boundary conditions. At the distance r < 8 H the averaged decay law is cylindrical with increasing influence from the additional attenuation.
The dominating influence on the losses value in the shallow water has frequency, thickness of the water layer and bottom type. Rough water effect at the low frequencies is insignificant. As the frequency increases, the heaving of sea begins to tell when its value is more than 4-5 on Beaufort scale.
Deep sea
The main factors, which define sound propagation conditions at the deep sea, are speed of sound distribution in depth. Different hydrologo-acoustic conditions determine following acoustic phenomena in the deep sea:
• surface sound channel;
• antiwave sound propogation;
• underwater sound channel;
• regional field structure.
Variable channel along the range of propagation
In this case, bottom relief, speed of sound distribution at the depth and bottom property exercise significant influence over TL. Given phenomena are typical for:
• sound propagation on the long distance (more than 1,000 km);
• sound propagation in the coastal wedge;
• crossing frontal zones by sound energy.
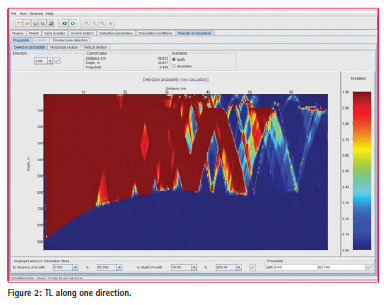
The given below graphic representation is used as a descriptive version instead of algebraic equations.
 .
.
Web & Wireless capabilities
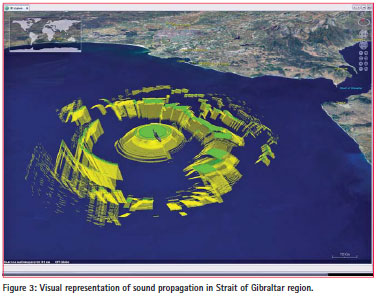
The given pictures clearly indicate the dependence of the parts of main acoustic equation on different input data. Conventionally, for most input hydroacoustic data, these data are of statistical nature. So, evidently the received results are not accurate enough. To assure the input data, it is necessary to have the right information at the right time, and it is only possible to receive such information using the distributed hybrid network. Figure 3 gives 3D representation of hydroacousic conditions in some parts of the ocean (near the Strait of Gibraltar). It is quite easy to form a link between the equations (sections 3.1- 3.5) and environment phenomena in the sea. It is worth emphasizing again that to receive real data in real time for sure it is necessary to have a distributed hybrid network available. For the problem selected in the paper at least the following network types will be required: satellite, cell (traditional network), underwater cell and special hydroacoustic networks. At that, it will be necessary to operate with a fairly big volume of data and data of the different time scales as well as with the sources of hybrid network On the data flow side, a situation is similar to the Global Internet, at the same time, certain new requirements arise for the general case of underwater acoustics, and most important are: very large volume of data from underwater sound channel, bottom, surface conditions, etc. This is why every information source and receiver should have web&wireless interfaces and work as an element of global or local network. So in short, the web & wireless networks for underwater acoustics problems should be developed based on the Network Centric Operations principles. According to those principles, it is needed to collect information from different sources and also to furnish other customers with the information processed. According to the so far existing experience, it is possible to use information from Automatic Identification System (AIS) [7]. As a rule, this information covers well enough conditions on sea routes and ports (cell network), satellite images (space network), weather conditions at sea, ice line, etc. Complementary information about surface conditions and ships come from the radars. One important experimental conclusion is that for some information sources it is possible to use several various networks instead of a single one. So, the customer has a possibility to choose using one or several networks. Also, it is needed to evaluate the network costs and the data transfer rate. While developing monitoring system for regions like the Baltic Sea, the conclusion was made that cell networks are somewhat preferable for AIS and radars at identifying the surface conditions. Indeed, the decisions regarding a configuration and architecture of the network should be made for the defined region, goals and costs. On the whole, the situations can be more complex in case of underwater and bottom properties and conditions, since it is difficult to maintain continuous data channel. Underwater cell network turns out to be too complex and expensive. However, for military purposes some countries, for instance, the USA, support investigations in developing the underwater cell networks of the kind.
Intelligent GIS capabilities
It had been already noted [8] that Geographic Information Systems (GIS) are a key technology for up-to-date information systems and especially for underwater acoustic systems. GIS could be used in different ways as a friendly interface, as a special system for control and processing heterogeneous data, and as a container of web interfaces and services. The proposed GIS handy tools allow the end users or decision-makers to graphically fuse different information, and Figure 3 gives an example of such a fusion. In Figure 3, the ship under study is located in the center of a green circle, and from the green circle’s center the ship’s signals are propagated in different directions from 0 to 360, and the distribution of the sound energy differs in accordance with the conditions of the geo medium. The energy level (Signal Level) is a complex function that depends on a number of factors as discussed in Section II. Environmental factors depend on the coordinates that unfortunately are time-varying. So, the distributed network should be used for assuring the receipt of true results that would assist the decision-makers. The network is expected to provide the right information at the right place and real time as has been discussed in Section III. GIS should at least provide the following services in order to: control network; check conditions and state of the input data sources; run a system of hydroacoustics field modeling; provide recommendations for decision-makers; collect and store initial data; provide initial and processed data to other customers; generate visual representation of situation on maps in 2D (2D+t) or 3D (3D+t) versions. Intelligent extensions turn GIS (IGIS) into truly advanced information systems; say, for underwater acoustics problem, IGIS is a revolutionary technology that allows the regular users to investigate hydroacoustic problems in their work place without extra obligations to communicate elite laboratories and companies. It is also evident that the W2 technologies enable optimistic opportunities for many researchers in developing and investigating various acoustics problems under real data and real time conditions, and using their personal computer/network means. To match this optimistic prognosis, the GIS system should incorporate certain new properties and capabilities; most important of them are: well developed system of web services (at least three levels: system, application & data base, and end users); input and output systems for receiving and sending data by different wireless networks; structured system of ontology for data harmonization, integration and fusion.
Conclusion
Web&Wireless technology plays an important role in everyday life and affects the fundamental science and hi-tech. The approach described in this paper considers the development and implementation of the W2 concept and technology for the underwater acoustics’ problems solving. Needless to say that the above approach demonstrates a fusion of different science and technology: W2, GIS, Intelligent GIS and underwater acoustics.
Currently, the studies in the complex hydroacoustic calculations’ models are pursued based upon the existing accomplishments of different companies interested in solving the problem under consideration. It is assumed that the approach proposed here will allow, along with accounting for the medium objective parameters, detection means and systems to account for the factors like: who uses the calculation system (remote terminal, sophisticated user or other), what are the time constraints (real-time or imposed time constraints), availability of information resources for calculations (current measurements, statistic or processes data), etc.
References
[1] V. V. Popovich, V. A. Zaraisky, R. M. Yusupov, Multi Agents Approach for Underwater Sound Equations Solution, Proc. of the Sixth International Conference on Theoretical and Computational Acoustics (ICTCA), Honolulu, Hawaii, August, pp. 464-474, 2003
[2] K. V. Avilov, Pseudodifferential Parabolic Equations of Sound Propagation in the Slowly Range- Dependent Ocean and their Numerical Solutions, Acoustic Journal, Vol. 41, No. 1, 1995, pp. 5-12
[3] K. V. Avilov, O. E. Popov, The Calculation of the Signal from a Broadband Point Source Arbitrarily Moving in the Range- Dependent Ocean, Proc. of the XIV-th L.M. Brekhovskikh’s Symposium, Moscow, 1998
[4] V. Popovich, V. Ermolaev, N. Hovanov, D. Chirov, P. Konuhovsky, S. Vanurin, Acoustics Field’s Calculation Optimization on the Combined Approach Basis, Proc. of the Euripean Conference on Underwater Acoustics (ECUA), Istanbul, Turkey, July, 2010
[5] P. N. Volgin, V. I. Guchek, V. I. Ermolaev, V. V. Popovich, S. N. Potapichev, Visual Representation of Sonar’s Possibilities for 2D Heterogeneous Medium, Proc. of XI-th Conference “Applied Technologies of Hydroacoustic & Hydrophisics”, pp. 63-65, St. Petersburg, Russia (in Russian), 2012
[6] R. Urick, Principles of Underwater Sound for Engineers, McGraw- Hill, New-York, 1975
[7] V. Popovich, V. Ermolaev, Y. Leontev, O. Smirnova, Hydroacoustics phields modeling on an Intelligent GIS Base, Artificial Intelligence and Decision Support, No. 4, 2009, pp. 37-44
[8] Object-Oriented Geoinformation Systems Laboratory of SPIIRAS. www.oogis.ru
[9] Marsh H.W. and Schulkin M. (1962) Colossus II Shallow-Water Acoustic Propagation Studies, USL Report No. 550, 1.


 (2 votes, average: 3.50 out of 5)


Leave your response!