| Disaster Management | |
The prediction and validation of Kumamoto Earthquake with GNSS data
It was very diffi cult to achieve the prediction of the Kumamoto Earthquake because there were very few short term abnormal changes at multiple GNSS stations which have normally occurred, in our previous experience, for larger earthquakes |
 |
|
 |
|
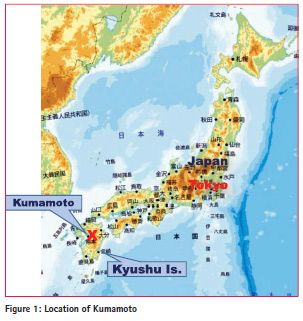
The huge Kumamoto Earthquake 2016 occurred at 1:25am, April 16, 2016 in the vicinity of Kumamoto City, Kyushu Island, Japan (see Figure 1). This destructive earthquake, in addition to very large foreshocks as well as repeated aftershocks, killed 50 persons and injured 1,720, while 86,411 houses were destroyed as of the 14th May 2016, a month after the earthquake.
The authors initiated technical support for an earthquake prediction business in January 2013 using GNSS data provided by Geospatial Information Authority (GSI). Our prediction of the Kumamoto Earthquake was not perfect, but partially succeeded despite its very special characteristics. This article describes how we predicted the earthquake in advance, and the large crustal changes that were revealed after the Kumamoto Earthquake based on the GNSS data analysis.
Introduction
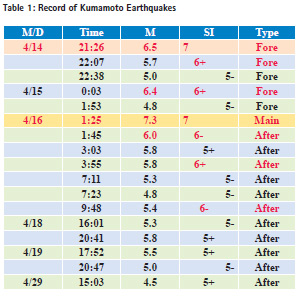
The main Kumamoto Earthquake was M7.3 on the Richter scale, which also registered the highest level of 7 on the Japanese Seismic Intensity Scale (hereinafter called SI). However a foreshock with M6.5 or SI 7 occurred at 21:26, April 14, 2016, 28 hours before the main shock. Because the foreshock was so large, many people imagined that the foreshock was the main earthquake. In addition, the initial damages were not very significant. As most houses and buildings had not collapsed after the foreshock, many people who had been evacuated, went back home for the night. The main shock occurred unexpectedly in the early morning of the 16th April, which resulted in many more houses being destroyed and many more fatalities. The special character of the Kumamoto Earthquake was the extraordinary large number of aftershocks with more than 1,300 occurring in a month, including 11 larger earthquakes of a destructive level higher than SI 5. Such a large number was the maximum ever record in Japanese earthquake history.
From our 14 year experience of earthquake prediction research, there should be extraordinary short term changes in height at multiple GNSS stations in advance of such a large earthquake. However in the case of Kumamoto Earthquake, such short term changes or weekly height changes were not recognized except for a long term significant subsidence in Kyushu Island commencing two years earlier. Based on the abnormal subsidence of Kyushu Island, we issued a warning to our customers that the Kyushu area including Kumamoto (located in the middle of Kyushu) and Kagoshima (in the south of Kyushu) was a risky area on the ‘weekly mail magazine: MEGA earthquake prediction’.
The new year 2016 issue of the weekly magazine ‘Post’ which included our prediction ‘be careful in Kumamoto and Kagoshima until spring’ was correct. However the above mentioned weekly mail magazine continued the warning only until the end of March because the warning had been repeated and postponed for these two years. But 14 days after the withdrawal of the warning, the Kumamoto Earthquake occurred. Therefore, the prediction was not correct in this regard.
Special charcteristics of Kumamoto earthquake
The special characteristics of the Kumamoto Earthquake should be noted as follows.
1) The main EQ was quite large (Maximum Magnitude: 7.3 and Maximum SI: 7) and the depth of epicenter was quite shallow at 10 km.
2) There were 5 foreshocks and 11 aftershocks of magnitude greater than SI 5, which are classified at the destructive level as listed in Table 1. This number of large earthquakes caused serious destruction and damages such as house collapses, landslides, mudflows, bridge collapses, road surface cracking, derailments, fires, terminations of supply of water, gas, electric power, sewage and so on.
3) There were about 1,300 aftershocks at higher than the weak level of SI 1 in a month. Normally the number of aftershocks has decreased in a week after an earthquake, but in the case of Kumamoto Earthquake the number did not decrease as usual.
4) Due to continuously occurred aftershocks which accelerated the destruction and fear of people, most could not live at their own houses, which resulted in a large number of 183,000 persons being evacuated.
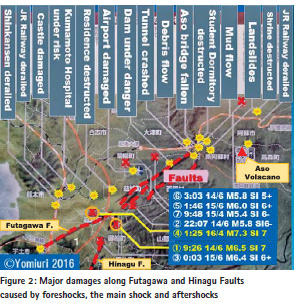
5) Most of the damage and destruction were concentrated along two faults; namely Futagawa and Hinagu Fault as shown in Figures 2 and 3.

Prediction of Kumamoto earthquake
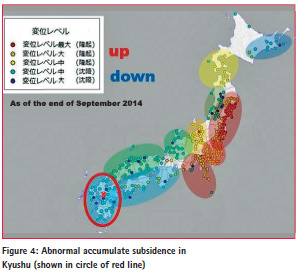
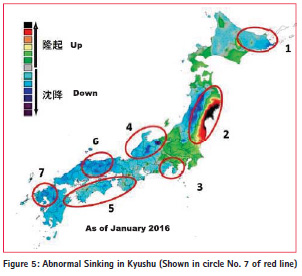
JESEA commenced its warnings that Kumamoto was a risky area in May 2014 in its published mail magazine, as the Kumamoto vicinity started sinking abnormally. At the end of September 2014, the accumulated deformations were also serious in Kyushu Island shown in Figure 4. Kyushu Island kept sinking until January 2016 as shown in Figure 5.
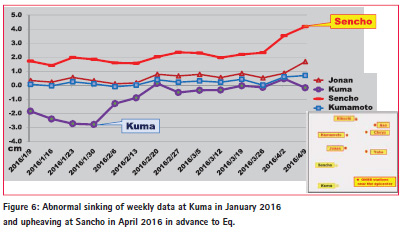
Weekly averaged data at GNSS stations of Kuma and Sencho near Kumamoto showed abnormal behavior in January and April 2016 respectively as shown in Figure 6.
The above abnormalities were reported and warned in our mail magazine to our customers. Because the warnings on Kumamoto had been prolonged until the end of January 2016 and further prolonged until the end of February, JESEA decided to withdraw the warning in the beginning of April 2016. One of the reasons for the withdrawal was because JESEA received criticisms from customers who claimed the warning had been repeated so often. We feel ashamed that JESEA could not maintain its confidence in its predictions until the Kumamoto earthquake occurred only two weeks later.
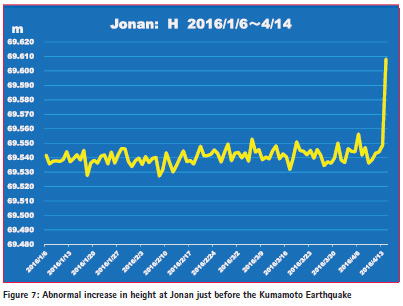
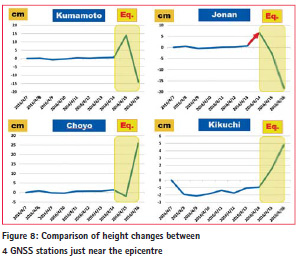
Daily data at GNSS stations near Kumamoto just before and after the earthquake were checked to determine whether there were any pre-signals in advance to the earthquake. We found that only Jonan just near Kumamoto showed an abnormal increase in height just before the earthquake as shown in Figure 7. This behavior is very rare and strange, since in the previous cases of large earthquakes a large number of GNSS stations revealed abnormal pre-signals in advance. Figure 8 shows the height changes at 4 GNSS stations near the epicenter just before and after the earthquake. Therefore, it must be understood that Jonan was exceptional. It would be difficult to identify just one GNSS station that revealed such abnormality out of the 1300 GNSS stations all over Japan. In addition users of GSI’s GNSS data cannot access the data in real time because there is a delay of 2 days in the release of the data. If JESEA could access this data in real time, the prediction would be timelier and more accurately determined. This is why JESEA is now promoting construction of its own GNSS stations in cooperation with NTT Docomo, the largest telecommunication enterprise in Japan.
Analysis of crustal chages after the earthquakes
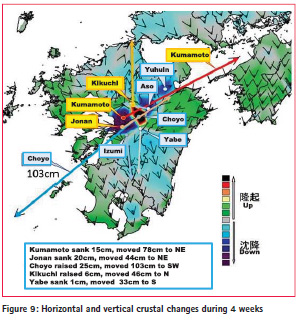
JESEA has developed GIS applications to visualize image-based crustal changes from pointwise GNSS data with arrows indicating horizontal changes overlaid on color images of vertical changes. The blue color group shows sinking while green, yellow and red color groups show rising.
Figure 9 shows the crustal changes for two weeks before and after the Kumamoto Earthquake. According to the geographical locations in relation to the faults, the crustal changes were completely different in horizontal and vertical directions. For example, Kumamoto sank 15cm and moved 78cm to NE, Jonan sank 20cm and moved 44cm to NE, Choyo rose 25cm and moved 103cm to SW, Kikuchi rose 6cm and moved 46cm to N, Yabe sank 1cm and moved 33cm to S.
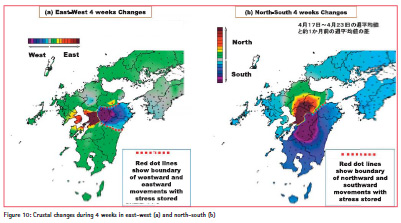
It is interesting to visualize the east-west components of the changes 2 weeks before against those for 2 weeks after the earthquake as well as the north-south components, instead of using arrows, as shown in Figure 10. In this figure, the boundaries or faults of the crustal changes can be clearly visualized.
Conclusions
It was very difficult to achieve the prediction of the Kumamoto Earthquake because there were very few short term abnormal changes at multiple GNSS stations which have normally occurred, in our previous experience, for larger earthquakes. Only long term changes of trends in subsidence in the Kyushu area, which have been recognized in the previous two years, would have been the scientific evidence for our predictions.
It was human error at JESEA to have withdrawn the warning of potential risk in Kumamoto at the end of March 2016 because of criticisms from the customers over the prolongation of the warning for the long period of two years. Ironically the Kumamoto Earthquake occurred just 2 weeks after the withdrawal of the warning.
In order to improve its predictions, JESEA is promoting a real time observation system at its own GNSS stations which would enable the provision of more timely precise data on an hourly basis instead of daily. The GIS analysis to enable image-based visualization of the three dimensional crustal changes after the earthquake was very useful in understanding how the land in the vicinity of Kumamoto moved drastically in different directions.
Acknowledgement
The authors would like to express their appreciation to Mr. KITTA Toshihiro, the president of JESEA and Mr. TANIKAWA Toshihiro, Executive of JESEA for their kind support of our research. The authors also thank GSI for providing daily GNSS data of 1,300 stations free of charge. The authors would like to appreciate Prof. John Trinder for editing and correcting English.
References
MURAI, S. and ARAKI, H.: Prediction of earthquakes and volcanic eruptions using GNSS data (Japanese): 2003, Technical report, Journal of Surveying, Japan Association of Surveyors
MURAI, S. and ARAKI, H.: Earthquake Prediction using GPS, GIM International, Volume 17, No. 10, October 2003
MURAI, S. and ARAKI, H.: Prediction of Earthquake and Volcanic Eruption using GPS: Asian Journal of Geoinformatics, Vol. 4, No.3, March 2004
MURAI, S. and ARAKI, H.: Was early warning of Sumatra earthquake possible? Coordinates, Volume 1, Issue 2, 2005.7, p.8-11
MURAI, S. Report on Tohoku Kanto Great Earthquake and Tsunami 311: ISPRS Highlights, April 2011 MURAI, S. and ARAKI, H.: Crustal Movement before and after the Great East Japan Earthquake, Coordinates, May Issue 2012
MURAI, S, ARAKI, H. and YANAGI, H.: Towards the prediction of earthquakes with GNSS data, Volume X, Coordinates, May Issue 2014.
MURAI, S. and ARAKI, H.: Overview for the prediction of larger earthquakes in Japan, Coordinates, July Issue 2015


 (No Ratings Yet)


Leave your response!