| Applications | |
Spatial and economic inequities and trends in South Africa
The paper aims to better understand the spatial interlinkages between racial segregation, poverty, household composition, land value and income inequality in these areas |
 |
|
 |
|
 |
|
Introduction
The effectiveness of programmes realizing urban equity and resilience in the South African context are greatly constrained by South Africa’s entrenched racial, (and through that class) land ownership and settlement patterns. Given the costs of well-located urban land, the state efforts to house the urban poor have often resulted in housing opportunities being provided at great distance from the urban core and employment opportunities. This has exacerbated the ability of even the working poor to make ends meet as high transport costs often consume over 25% of their income. The black working poor often have to have three homes to survive: a home where apartheid’s forced removals forced them to live, a home which they may have received as a results of the democratic state’s massive housing provision since 1994, and also a home in the form of a shack which is located close to their workplace and in which they live in order to reduce travel costs whilst working or seeking work.
This report analyses the spatial and economic inequities between, and within, South Africa’s major metropolitan areas. It aims to better understand the spatial interlinkages between racial segregation, poverty, household composition, land value and income inequality in these areas. It examines the market valuation of property across 11 municipalities drawing out the implications of these trends for reducing inequality. These data also have implications for providing housing on well located vacant land, as well as for transforming the apartheid spatial landscape. Overall, the report will emphasise the challenges in overcoming inequality and providing access to urban opportunities for particularly poor and black South Africans who were historically disenfranchised.
National municipal context
South Africa is divided into 257 municipalities, organised into two basic groups:
• 8 Category A municipalities often referred to as Metropolitan municipalities; and
• 205 Category B municipalities (referred to as locals) which are distributed across 44 Category C municipalities (referred to as Districts).
Municipalities exercise a range of powers and functions, and in general are the major distributors of basic network services such as electricity, water, sanitation, roads, transport; as well as a number of community-based and economic services such as planning and development, parks, recreation, cemeteries and crematoria, tourism, and local economic development.
Municipalities receive a share of the national fiscus (known as the equitable share), as well as contributions from national/provincial governments to deliver a certain quantum of free basic services (water, electricity, sanitation) as well as to undertake a range of developmental functions such as providing access to electricity, water and sanitation for particularly the poor, the building of roads and the provision of public transport.
Municipalities that deliver services such as electricity, water and sanitation are able to recover these costs through charging tariffs.
Metro and Local municipalities are also able to tax property owners through charging property rates. These taxes are calculated using a formula (termed ‘rates randage’) which is a proportion of the market valuation of a property, and which must be paid directly to a municipality.
The financial resources available to municipalities differs markedly across the country, with the Metros having significantly larger budgets than the Locals. The Metros have an aggregate budget of R237 ZAR Billion, compared to the rest of the municipalities have total budgets of only some R143 ZAR Billion.
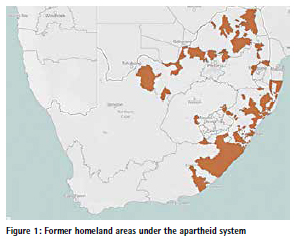
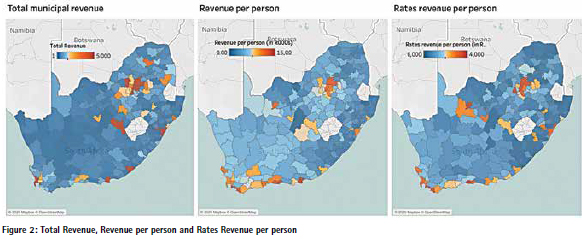
The following figures indicates the significant spatial differences in municipal budgets across the country, the first map on the left showing the total municipal revenue per municipality. When the revenue data is standardised by the population size being served, the spatial inequalities become more clear, with the larger urban areas having greater resources with which to provide services to their communities. The effects of apartheid are clear in that the areas shown as blue (ie with less revenue) are largely former homeland areas. The map figure 1 indicates the extent of area of South Africa which fell under the former apartheid homeland system:
There are also significant spatial disparities when one compares municipalities in terms of the rates revenue being generated per person in each municipality. This is indicated in the map figure 2
Overall, then, there are clear spatial inequities in the funds available to municipalities to provide basic services to their communities, as well as in the funds the municipalities are able to generate. These spatial inequities are largely a result of the legacy of apartheid, where formerly white areas had higher levels of education, higher levels of services in households (water, electricity, etc.) and higher GDP (and its effect of having higher employment levels). Hence it is no real surprise to find that there are very high levels of correlations between the billed rates and these variables which epitomised what white people under apartheid received.
On the other hand, since South Africa’s democracy in 1994 in particular, significant additional numbers of black South Africans have moved to these areas of economic opportunity. In many cases these migrants move as individuals, at least initially, and seek out the least expensive forms of accommodation. There is therefore a strong correlation between the size of the property rates bill and the number of households living in backyard shacks and informal settlements. Indeed, the numbers of people living in poverty are even greater in the large urban areas.
The spatial inequities in the property rates income for municipalities is further evidenced in a review of the municipal property valuation rolls. As may be seen in the table below, 50% of properties that can be valued in terms of their market value, and which are used to generate property rates income, are found in the 8 Metros which contain only around 30% of the population.
The next section looks at how, within municipalities, similar inequities exist.
The spatial distribution of market value of property within municipalities
Whilst spatial inequities with the South African municipal system are often discussed in general, and have usually focussed on the impacts that racial segregation continues to have on development progress, very few studies have provided empirical evidence showing how the inequities in access to decent housing have impacted on property markets and in turn how those markets have led to spatial inequities in property markets within municipalities.
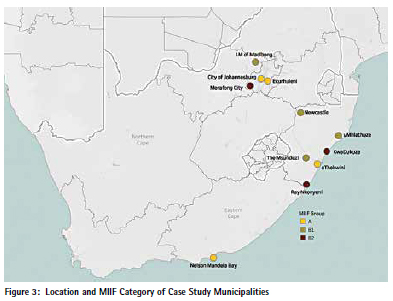
This forms the subject of this study and in order to analyse the degree to which such inequities exist, a set of case study municipalities were chosen and databases for each developed. Eleven municipalities were selected across the larger municipalities:
• Category A: Johannesburg, Ekurhuleni, eThekwini and Nelson Mandela Bay;
• B1 – (Larger secondary city centres): Msunduzi, Newcastle, uMhlathuze and Madibeng;
• B2 – (Regional/tertiary centres): Merafong, Ray Nkonyeni and KwaDukuza.
A brief descriptions of these municipalities follows1:
• City of Johannesburg is one of the most commercial cities in Africa and the engine room of the South African and regional economy. Johannesburg is home to almost five million people, accounting for about 36% of the Gauteng’s provincial population and 8% of the national population. The city’s main economic sectors are finance and business services, community services, manufacturing, trade (collectively 82%)
• uMhlathuze: The City of uMhlathuze Local Municipality is a Category B municipality situated within the King Cetshwayo District on the northeast coast of the KwaZulu-Natal province. It is the largest among the five municipalities that make up the district. It boasts the deepest water port, in Richards Bay, and is home to the Richards Bay Industrial Development Zone (RBIDZ), which drives the inwards investment of the City through foreign direct investments. Its main economic sectors are: manufacturing (45.9%), mining and quarrying (11.6%), financial, real estate and business (10.7%), community, social and personal services (10.4%), transport and communication (9.1%), trade (6.3%), agriculture, forestry and fishing (3.2%)
• City of Ekurhuleni: The City of Ekurhuleni Metropolitan Municipality is a Category A municipality in the Gauteng province and in many ways serves as the transportation hub of the country. Its main economic sectors include manufacturing (23%), finance and business services (21.3%), community services (20%), trade (15%), transport (11%), construction (4.1%), electricity (2.3%), mining (2.3%)
• eThekwini is a Category A municipality in the province of KwaZulu-Natal. eThekwini is the third-largest city in the country. Its main economic sectors include: finance (22%), manufacturing (22%), community services (18%), trade (16%), transport (16%), construction (3%), electricity (2%)
• KwaDukuza is a Category B municipality located within the iLembe District in the KwaZulu-Natal Province. Its main economic sectors include: agriculture and tourism
• Madibeng is a Category B municipality located in the North West Province within the Bojanala Platinum District. Its main economic sectors include mining, manufacturing, agriculture and tourism
• Merafong is a Category B municipality situated within the West Rand District in the Gauteng Province. Its main economic sectors include mining (50.7%), trade (9.7%), finance and business services (9.9%), community services (9.2%), general government (9.1%)
• Msunduzi is a Category B municipality situated within the uMgungundlovu District in KwaZulu- Natal. Its main economic sectors include community services (29%), finance (24%), transport (13%), trade (12%), manufacturing (12%)
• Nelson Mandela Bay is a Category A municipality and is the economic powerhouse of the Eastern Cape Province. Its main economic sectors include Manufacturing (25%), community services (23%), finance (23%), trade (13%), transport (13%)
• Newcastle is a Category B municipality situated within the Amajuba District in KwaZulu-Natal. Its main economic sectors include: Trade (24.9%), community services (22.1%), finance (14.71%), manufacturing (13.7%), construction (6.9%), transport (6.7%), agriculture (3.8%)
• Ray Nkonyeni is a Category B municipality situated within the Ugu District in the KwaZulu-Natal Province. Its main economic sectors include: Finance and business services (21.5%), wholesale and retail (18.7%), general government services (13.3%), manufacturing (12.3%), agriculture and forestry (8.9%), transport and communication (8.9%).
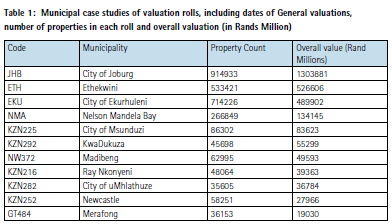
All of the case study municipalities have recently updated their general valuation rolls and they contain market valuations of at least 2,8 million properties. Collectively, these properties have been valued at around R2,8 ZAR trillion. Johannesburg itself has properties valued at over ZAR1,3 trillion whilst the smallest valuation roll of Merafongs properties are worth around ZAR19 billion.
In analysing the breakdown of properties across each of the valuation rolls by property type, the number and value of properties, we find significant variation across each of the municipalities in terms of reliance on different property sectors for their property rates income. For example, the largest number of properties are residential across all municipalities, but there is significant variation in the value of property across municipalities. For example, 88% of properties on the Johannesburg roll are residential, constituting 65% of the value of all properties. At the other end of the spectrum, in uMhlathuze whilst residential properties constitute 83% of their properties, in terms of value these are only 49% of total property value.
Business and commercial properties constitute significantly higher proportions of value than the number of properties suggest should be the case.
For purposes of analysing the spatial distribution of properties and values across each municipality, the overall number and values of all properties, as well as the specific distribution and values of residential and commercial properties are described. Three sets of analysis are provided. The first examines the degree of concentration of property values across the municipalities, the second describes the spatial distribution of property values and the third section analyses these distributions.
In examining the degree of concentration of values in specific parts of the municipality, Lorenz curves were produced, indicating:
• The cumulative proportion of property values from the smallest values to the highest property values in each ward.
• residential property values within each municipality. For these, curves were smoother indicating less concentration of residential values in wards.
• The cumulative proportion of commercial/industrial property values found across the wards and, as may be expected, they generally suggest a greater degree of concentration of commercial/industrial property values across the wards.
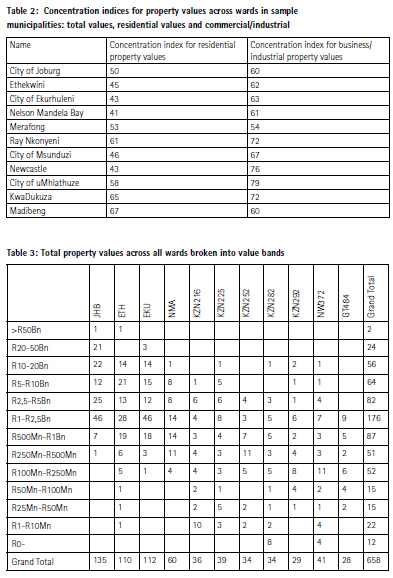
Overall, in order to easily compare these Lorenz curves, an adaptation of Hoover’s index of concentration or localization, as cited in Cox (2019)2, was used for comparative purposes. The indices provided in the table below are percentages which reflect the proportion of all properties that would have to be moved around in order to get equality in values (total, residential or business) in order to get complete equality across all wards in each municipality.
For example, in the case of Johannesburg, in order to get equity across all wards in terms of total property values, 50% of the residential properties would have to be shifted and 60% of commercial/Industrial properties would have to be shifted. On the one hand, the results are expected in that one does not expect to find high proportions of commercial/industrial properties in all wards. But on the other hand, these concentration indices are very high lying generally close to or above 50% across all indicators and municipalities:
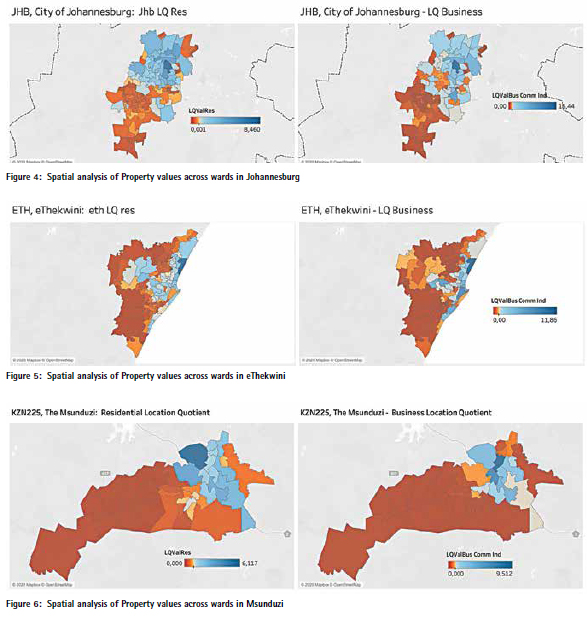
Clearly these data and indicators suggest that within municipalities there is a very high level of concentration of property values with some wards having high values and others very low values. This is easily evidenced in grouping the overall property values by wards across municipalities. The following table shows this, and it shows that 2 wards have overall property values of over ZAR50 Billion, with 34 wards having total property values of less than ZARR10 Million: Whilst there are very high degrees of concentration of property values across the eleven case studies, it is important too to understand the spatial distribution of these property values. In order to do this Location Quotients (LQs) were calculated for each ward: high LQs indicate that the overall values are very high compared with an equitable situation. The following sets of maps for some of the municipalities reflect the spatial distribution of properties:
• Map of LQs of residential property values across all wards: these generally show that whilst the previous analysis showed there were generally high levels of concentration of property values, this map shows that the concentration of high values are generally in former white areas and the low LQs are in formerly black African areas;
• Map of LQs of commercial/business which show even higher levels of concentration but which also mirror that of the LQs of total property values;
These maps reinforce the arguments made that the spatial inequities that have their roots in apartheid continue to play a major role in the shape and form of South African cities, showing that the spatial distribution of property values and corresponds largely to the shape of the apartheid reality, with high levels of concentration (high property values in formerly white areas and low property values in formerly black areas) and spatial inequality.
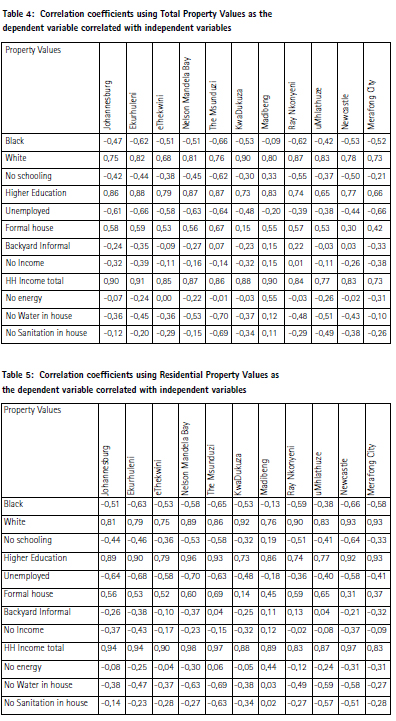
A set of correlations were also calculated to show the degree to which the property values in each municipality, as dependent variables, were associated with a set of independent variables reflecting dimensions such as race, education, employment, income, housing type and access to services.
The correlation coefficients further reinforce the arguments that the racially-based apartheid system remains etched into the concrete of the country, where areas where there is a higher concentration of whites who, because of apartheid were better educated and have higher income and employment levels have high correlations with property values. Variables such as the proportion of formal housing have lower levels of correlation with property values, in part due to the fact that post-1994 the massive house building strategy of the democratic government has focussed on providing access to housing for as many, particularly poor and black, people as possible and so the sheer number of formal houses is not as good a predictor of high property values as, for example, race (white) and educational levels. At the same time, property values are inversely correlated with the proportion of black people residing in a ward:
As would be expected, a very similar situation shows when examining the correlations between residential property values and the same set of independent variables.
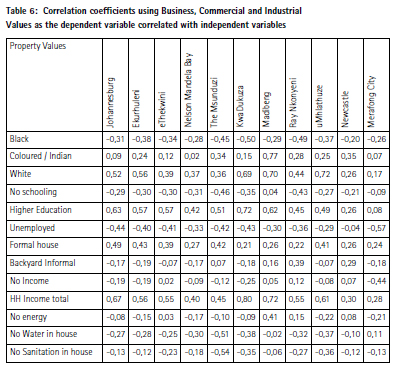
However, in the case of the relationship between business/ commercial/industrial property values and the set of independent variables, the results are not as strong. Whilst the results still reflect the effects of apartheid, with black areas unlikely to have high business property values as compared with white areas, the reality is also that black South Africans often created and moved into informal settlements close to places of economic opportunity in the post-1994 period. As a result the strong relationships evidenced in the previous two tables, would have been diluted to a certain extent, even though the effects of the racist past are still evident.
Policy implications
The policy challenge at a national level is to create greater equity between municipalities, providing greater resources to municipalities who are faced with high levels of need, but low financial resources to address them. This needs to be done without compromising the growth of the large metro areas which accommodate growing numbers of poor migrants in search of work opportunities.
Within municipalities there is a need to:
• Increase the revenue base of municipalities, through measures which ensure that property values are able to be realised in all areas, not just former white areas. This requires mechanisms to bring ‘unrated’/ traditional areas into the rates system to avoid the problem of people living and building homes in these areas to avoid property rates. This must be done whilst ensuring that poor and indigent households are not burdened with additional costs they cannot afford.
• Use increased revenue’s from broadening the property rates base to improve access to services and improved urban environments for the poor and in underserved areas.
• Use the resources already available in former white areas to benefit poorer black households and allow them to get access to the city, improved social and other services and lower their costs of living.
• Develop mechanisms to use vacant land and densification as a means of improving equity whilst increasing rates
The following policy amendments are proposed
Well-located areas of opportunity
Identify well located areas within each municipality which are close to job opportunities and which are in well-serviced neighbourhoods with adequate service and social infrastructure. Within each, undertake an analysis of available vacant land, as well as under-used land which can be repurposed or densified. These should be demarcated and prioritised for social or rental housing opportunities where low income households are given accommodation opportunities. These should be funded from the national fiscus (as social housing currently is).
The current housing subsidy grant – which although not discussed in this document – is a considerable quantum of funding available for housing purposes is currently used to fund and develop low income housing on inexpensive land, generally on the outskirts of urban areas, should be re-designed to focus increasingly on social housing.
Broadening municipal revenue
Most municipalities do not currently charge property rates in former black townships. This is a response to high levels of poverty in these areas as well as to the fact that many townships do not have freehold tenure as they are located on traditional land. However this also allows for a situation where new housing is developed in these areas specifically because the owners do not have to pay for property rates.
Considerable work is currently being done in looking at South Africa’s tenure system and how it can be reformed to provide greater security of tenure for those living on traditional land. Whilst not the focus of this paper, it is important to recognise that there are a variety of mechanisms that could be used to levy charges on land that is communally owned. One such mechanism could be to use the sectional title or share block mechanisms.
However this must be done in a way that does not over-burden the poor, but ensures that residential structures over a certain value are taxed. The experience from the levying of tolls on highways in Gauteng “e-Tolls” must be incorporated into any initiative to levy taxes onto what has previously been free. It is important to ensure adequate consultation is held on this and initial costs are kept as low as possible.
Township focussed commercial and industrial development
In order to increase access to employment opportunities in former black townships and to address the lack of amenities in these areas, the spatial focus for industrial and commercial development should be on land within or adjacent to these areas. South Africa has experience – although with mixed degrees of success – in establishing Special Economic Zones (SEZ’s) and Industrial Development Zones (IDZ’s) in order to encourage development in particular spatial areas.
As above, however, it is vital to learn from the failures of some previous initiatives: development must be located in areas that are suitable for commercial development and not all outlying townships will be suitable. In addition, it is important to ensure that these do not become single land use areas, but instead are well planned integrated zones which include business, light industry, government services as well as residential areas.
A strong infrastructure component must accompany these initiatives to ensure that former neglected areas are provided with greater access to transport, energy and water infrastructure.
Concluding comments
The above data and maps show that the spatial effects of apartheid spatial planning are still deeply etched in the national and urban landscape.
Whilst South Africa’s municipal system has been reformed, including the legislative system which guides it and the allocation of financial resources across municipalities, these have not addressed the spatial inequality that exists across the country as well as within cities.
The financial system attempts to equitably allocate resources across municipalities according to their needs. Many municipalities raise revenue from the sale of services, but this does not generate significant net revenue for the municipality. Municipal income from property rates, however, can generate a far higher proportion of net profit. However, because the ability of municipalities to raise their own revenues is linked to the commercial value of property, areas that benefited from the allocation of resources under apartheid remain privileged and these benefits are being further endorsed with greater access to resources, perpetuating the apartheid legacy.
The policy proposals made aim to ensure that apartheid spatial patterns are effectively disrupted through firstly, creating space within former white residential areas for lower income black residents who will be able to benefit from the resources and facilities that were developed for whites during apartheid.
Secondly, it is proposed that there is a focussed initiative to develop infrastructure and facilities on land within or near former black townships which are located in outlying areas. These are aimed at ensuring that these former ‘dormitory townships’ are made into viable, liveable environments which support a greater range of land uses.
Finally, policy proposals are made to ensure that municipal own-revenue sources are increased through bringing in currently un-taxed land on which development is currently taking place.
Endnotes
1 See www.municipalities. co.za for municipal profiles.
2 Uneven Varieties of Space Economy Paper prepared for the annual conference of the Cambridge Journal of Regions, Economy and Society, July, 2019: ‘Rethinking the Economy of Place: Challenges of Inclusion, Productivity and Power.’


 (No Ratings Yet)


Leave your response!