| Applications | |
Sentinel-1 SAR data based flood mapping and monitoring of River Kosi, Bihar, India
The study makes an attempt to assess the inundated/flooded areas by comparing two time-series Sentinel-1 SAR dataset of 24th June 2017 i.e. pre-flood areas which depicts the permanent waterbodies (referred as archive image) and the image of 23rd August 2017 which depicts the actual flooded area (referred as crisis image) |
 |
|
Kosi belt (Alluvial fan) in Bihar has historically been under the constant flooding by River Kosi, the river popularly known as the ‘Sorrow of Bihar’. Each year it inundates hundreds of acres of fertile land and invades highly populated area, which incurs tremendous loss to human life and property. Nonetheless, the people live with floods for years and adapted the unpredicted behavior of the river. The latest remote sensing data have come as a boon in flood forecast, relief planning and management. Under the European Union’s Copernicus programme, radar based satellite Sentinel-1 (all weather satellite) offers huge capability in improving crisis management and helping response efforts. The high revisit time and rapid data dissemination make the Sentinel-1 radar data the most sought after satellite imagery as on date. The study makes an attempt to assess the inundated/flooded areas by comparing two time-series Sentinel-1 SAR baseline dataset of 24th June 2017 i.e. pre-flood areas which depicts the permanent waterbodies (referred as archive image) and the image of 23rd August 2017, which shows the actual flooded area (referred as crisis image). The study area has been restricted only for four northeastern districts of Bihar i.e. Saharsa, Khagaria, Madhepura and Supaul in view of voluminous dataset of Sentinel-1.
Flood in general
Floods and flooding impact more people globally than any other type of natural disaster. Floods have the potential to devastate entire communities and cities, destroy homes, take lives and even spread disease. With global warming having a greater effect on our climate than ever before, an increasing global population and a growing number of people living in flood-prone regions worldwide, vulnerability to flooding is set to increase further in the near future. Hence, strengthening our capabilities vis-à-vis flood forecast and preparedness thereof is of utmost importance.
Kosi Flood
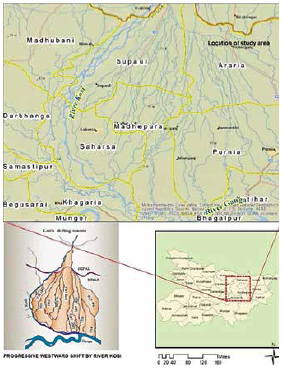
As per one estimate, Bihar is India’s most flood affected States in the country having over 73 percent of its lands under recurring flood. Among all, Kosi does the most of the damages in the State. Floods have defamed the Kosi to be called the “River of Sorrow”. Its unstable nature has been attributed to the heavy silt it carries during the monsoon season. The Kosi alluvial fan is one of the largest in the world, and extends from Barāhkṣetra across Nepalese territory, covering northeast Bihar and eastern Mithila to the Ganges, 180 km (110 mi) long and 150 km (93 mi) wide. It shows evidence of lateral channel shifting exceeding 120 km (75 mi) during the past 250 years, via at least twelve major channels. The river, which flowed near Purnea in the 18th century, now flows west of Saharsa (Refer figure-1 & Wikipedia).
Extensive soil erosion & silt load
Owing to extensive soil erosion and landslides in its upper catchment by factors both natural and human, the silt yield of river Kosi is estimated to be about 19 m³/ha/year, one of the highest in the world. The Arun – a trans-boundary river forming upper main part of River Kosi, with its origins in Tibet, brings the greatest amount of coarse silt in proportion to its total sediment load. The river is able to transport its heavy sediment load down the steep gradients and narrow gorges in the mountains and foothills, but on the plains beyond Chatra where slopes are flatter, the sediment load is deposited in an immense alluvial fan that has grown to an area of about 15 000 km². This fan extends some 180 km from its apex where it leaves the foothills, across the international border into Bihar state and on to the Ganges. Instead of a single welldefined channel, the river has numerous interlacing channels that shift laterally over the fan from time to time. Without sufficient channelization, floods spread out very widely. The record flow of 24 200 m³/s is equivalent to water a meter deep and more than 24 kilometers wide, flowing down the slight slope of the alluvial fan at one meter per second (Wikipedia).
Need for effective monitoring and flood management
Detecting and monitoring flood events globally is crucial to our understanding of the processes, how it happened, how it can be prevented, how it can be managed, how can we prepare better in the future and how can we best warn people situated in at risk areas. In the midst of a disaster, information is needed as quickly as possible to provide an overview of the situation, to improve crisis management and to help response efforts.
Satellite data
With an unprecedented amount of satellites monitoring the Earth on a constant basis, there has never been more data available to help us assess, monitor, analyze, model and view floods around the globe as and when they happen. The data and imagery which satellites provide have proved invaluable as countries around the globe seek to identify at risk areas and inform planning to help mitigate the impact of future flooding.
Sentinel 1
SAR’s inherent capability to observe during cloud cover and SENTINEL- 1’s frequent revisits makes it ideal for flood monitoring. The use of synthetic aperture radar (SAR) data is presently well established in operational services for flood management. Sentinel-1 is an imaging radar mission providing continuous all-weather, day-andnight imagery at C-band. The Sentinel-1 constellation provides high reliability, improved revisit time, geographical coverage and rapid data dissemination to support operational applications in the priority areas of marine monitoring, land monitoring and emergency services.
Sentinel-1 potentially images all global landmasses, coastal zones and shipping routes in European waters in high resolution and covers the global oceans at regular intervals. Having a primary operational mode over land and another over open ocean allows for a pre-programmed conflict-free operation. The main operational mode features a wide swath (250 km) with high geometric (typically 20 m Level-1 product resolution) and radiometric resolutions, suitable for most applications.
Description of the study area
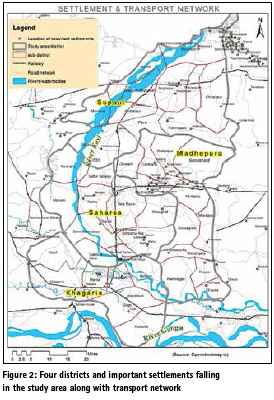
Four districts of Bihar namely Saharsa, Khagaria, Madhipura and Supaul have been taken as the study area as indicated in Figure-2. Selection of Sentinel-1 to assess the flood is based on two reasons. Firstly, the radar data provided by the satellite is particularly effective and useful in assessing the impact of flood affected areas as unlike other remote sensing satellites, it is able to penetrate rain and cloud cover; issues which generally affect flood hit areas. This also means that a flood can be monitored in real-time as it progresses, with a clear picture of the height and extent of it emerging. Secondly, Sentinel-1 offers regular coverage of the Earth’s surface, with a revisit period of only 6 days. This allows us to capture an affected area before a flood to help visualize and identify any changes to the landscape.
▪ For analysis of the flooding in Saharsa and its surrounding districts, two Sentinel-1 radar images were processed. One captured before the flooding and the other captured at the height of the floods. The first image was captured on 24/06/2017, indicates pre-flooding.
▪ The second image was captured on 23/08/2017. This shows the same area around the study area after a sustained period of heavy and persistent rainfall. There is a marked difference between the two images. The second image clearly details the extent of the flood with vast swathes of area along the River Kosi clearly under water.
Data used and methodology
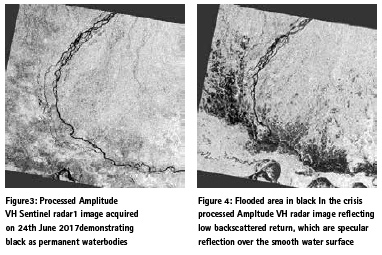
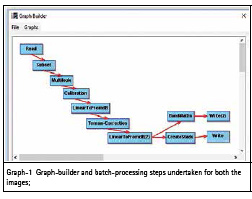
It was decided to use SNAP Desktop (version 5.0) as the main geospatial data processing software especially designed for pre-processing and post-processing analysis of Sentinel SAR dataset. The most of the operations were conducted in SNAP Desktop1 (A common architecture for all Sentinel Toolboxes is being jointly developed by Brockmann Consult, Array Systems Computing and C-S called the Sentinel Application Platform (SNAP). The SNAP architecture is ideal for Earth Observation processing and analysis due the following technological innovations: Extensibility, Portability, Modular Rich Client Platform, Generic EO Data Abstraction, Tiled Memory Management, and a Graph Processing Framework.) processing software. The first step was to subset the image for the study area comprising of four districts namely Saharsa, Supaul, Khagaria and Madhepura of Bihar, India. Since, the Sentinel SAR data are very voluminous on account of high spectral and spatial resolution, subsetting the data was an important step. Subsequently, multi-looking processing was applied to reduce speckle and dimension of large image to speed out processing time. If one is interested in high resolution satellite mapping, can have the same factor in the processing parameter. However a multi-looking factor of 3×3 was kept so as to reduce the size of image for speedy processing. This is followed by applying calibration of the images to make them comparable and change them to digital number to sigma0 backscatter (per unit area ground range). In the resultant image, most of the pixels have demonstrated very low backscatter value and very few pixels have high backscatter value. In order to rectify this, it makes sense to convert the pixels from linear scale to non-linear algorithm scale (db). This conversion was applied to make it easier to manipulate histogram of both datasets. This helped in better visualization and made easier to manipulate histogram. After the conversion, the decibel dataset had much better distinction between land and water pixels. One peak represented land while other smaller peak represented water. This was followed by application of terrain correction to project the image on the map-system and make correction in distortion due to terrain. To achieve the same desired map system, Range Doppler Terrain Correction was applied on both the archive and crisis images. Again linear to decibel conversion was applied on both the images for abovestated purpose (Refer Figure-3 &4).
Subsequently both the images were combined, stacked and RGB composite was created in order to distinguish flooded areas and permanent waterbodies. Further, it was also checked through the abstracted metadata information that the satellite passes of the both the images were descending and had the similar instance angle. However during the course of analysis the virtual images were converted to real images in Snap-5 software.
The graph-1 enlists the steps taken in pre & post processing of archive and crisis images. Several contrast stretch of the histogram was also applied for checking the result. All the above stated procedures were applied on the archive and the crisis images. The terrain corrected images are presented as below in figure 3 and 4:
Finally both archive and crisis terrain corrected and decibel images (db) were stacked into one to visualize the flood affected areas. During the stacking product geolocation was utilized in initial offset method. All bands were put to one stack and overlaid both archive and crisis images for visualization.
Image RGB composite
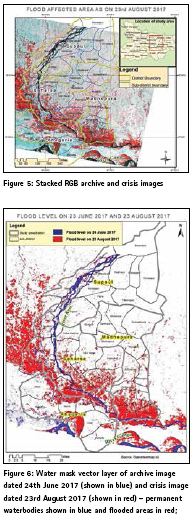
In order to distinguish between permanent waterbodies and flooded areas, a RGB composite was created. To accomplish the same, archive image was used as red band and crisis image was used as green and blue band. Selecting archive image as red is due to flooded area having high radar response by virtue of being land in archive image and it is not expected to see them as flooded area. However these lands shall have low backscatter return in crisis image as they are flooded area. Consequently, wherever there is flooded area, they shall appear red. However, wherever there are lands in both images, they shall have more or less similar backscatter return in red, green and blue channels, hence the image shall appear grey. And wherever backscatter return is low in both the images, the area shall depict dark as permanent waterbodies or rivers. Therefore areas shown in the RGB composite as red are clearly the flooded areas. However some areas have high backscatter return in crisis image are also shown in cyan indicating that there are some ground cover change which is not related to flood or may be related to crop characteristics (Refer Figure-5).
Creating water mask
For quantitative and further spatial analysis of flooding areas, water mask is created in SNAP-5 Desktop. To undertake that, the most effective method is binarization. It is needed to select the value that will separate water from nonwater. As is obvious the flooded area has low backscatter return than nonflooded area, taking advantage of this, the processed SAR image was classified after obtaining a threshold value (Graph-2). There are several methodologies to obtain threshold value such as by inspecting the pixel value. The histogram of the image was analyzed. The pixel value of Sigma0 image was analyzed though pixel info in table of content. For this a polygon of water area was created in ArcGIS software and vector layer was added into the Snap 5.0 (Refer Figure -6). Subsequently, statistics was analyzed by selecting the water-logged polygon by using region of interest (ROI) (Refer Graph-2).
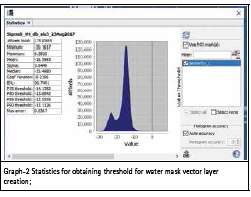
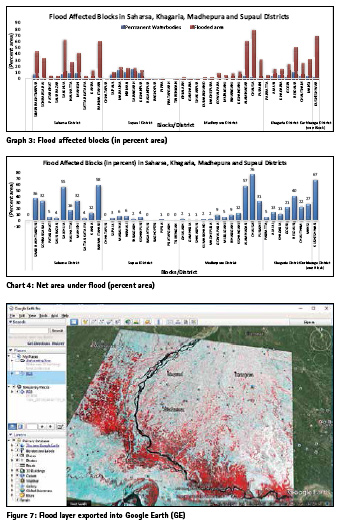
Histogram of the image demonstrated statistics falling in water polygon file. By analyzing minimum, maximum and mean value, a threshold value was decided after stretching the histogram in the process. By several stretching water and non-water area were clearly distinguished and a threshold was decided (Refer Graph-2). Through Band Math tool in SNAP by applying threshold and editing Band Math Expression, a new water mask layer created and saved for further analysis. The layer was further exported to a GIS compatible format (.geotiff) for further analysis in ArcGIS software and .kml format for overlaying in Google Earth (Refer Figure-7).
The .geotiff water mask table was added as a layer in ArcGIS and further subdistrict/ block layer was superimposed over water mask layer to visualize which sub-district/block had how much of its area under flood. The Graph-4 indicates that the southern blocks of Saharsa and Madhepura and north of Khagaria are falling under high flood zone. Further quantitative analysis for obtaining flooded area is carried out as below.
Result and discussion
▪ With the above assessment, it is now much easier to employ spatial analysis for further impact assessment, which may be required by the district administration for damage & compensation assessment. Furthermore, overlay analysis on vector layers such as block, panchayat and village boundary may help in effective and accurate impact assessment and relief distribution. With the coarse resolution data digitized from sources such as Census of India, a broad assessment of block-wise flood area calculation is thus carried out.
▪ It is observed that most of Blocks of Saharsa and Khagaria districts seem to be under high flood zone, while some southern blocks of Madhepura are also falling in high flood zone as well. In addition, it can also be observed that area under permanent waterbodies occurred in many Blocks of Supaul district. However, such occurrence is insignificant in Madhepura District.
▪ If the permanent waterbodies are deducted to visualize the net flooded area of each block, the following pattern emerges (Refer Chart-4). Chausa Block of Madhepura district and Banma Itahari and Salkhua of Saharsa Districts are the worst flood affected blocks. Kusheshwarsthan – the only block considered from neighboring Darbhanga District is one of the most flood affected blocks in the region.
The benefits
The study of flooding in the Saharsa, Supaul, Madhepura and Khagaria districts, using satellite remote sensing SAR data, has highlighted a number of potential benefits for using such techniques, which have emerged as potential tool in effective flood mitigation and planning. Benefits include:
▪ First responding team such as district administration and National Disaster Relief Force (NDRF) can quickly and easily access data which can help assess the situation, deploy their forces in critical areas and inform any rescue efforts by the district administration;
▪ Sentinel-1 SAR data is an allweather satellite, hence incessant rainfall during monsoon period, which is a regular phenomenon, cannot hamper in obtaining necessary information/data;
▪ Flood-prone and at risk areas are easily identifiable; Such studies can help inform future decisions on flood planning and prevention measures, including important areas to protect, such as densely populated areas;
▪ There are a range of satellites which provide free and easily accessible data, including the Landsat and Sentinel series of satellites, both information could be combined for better relief and prevention measures;
▪ Historic analysis can be carried out on particular areas to help identify trends and patterns in flooding;
▪ Frequent revisit times ensure that there is a rich amount of data available for a wide range of areas;
▪ Sentinel series of satellites collect a range of different data all of which can be used to help visualize and analyze any particular area of coverage;
▪ Analyzed data can be overlaid onto various base maps and google-earth for user friendly demonstration and decision making.
Conclusion
The mapping and remote sensing services seen in this case study can be used to provide value to organizations engaged in disaster management across departments/ organizations. Departments which can benefit from these services include:
▪ Agriculture – to help in the verification or analysis of agricultural land usage to inform drainage and flood planning;
▪ Insurance – to determine properties at risk from flooding and to inform premium rates;
▪ Governmental – to identify key areas in need of protection and to help inform measures to prevent or mitigate future floods;
▪ Transport – to help identify infrastructure which could be at risk of floods or which requires extra protection and prevention measures;
The above study is simply a demonstration of the application of Sentinel SAR data in flood management and relief planning. There are huge scope for improvisation of the study for effective decision making.
References
[1] Agarwal, R. P.; Bhoj R. (1992). “Evolution of Kosi river fan, India: structural implications and geomorphic significance” http://www.tandfonline.com/doi/ abs/10.1080/01431169208904238#. U9VeXf4ZWlM . International Journal of Remote Sensing. 13: 1891–1901.
[2] Bihar Kosi Flood (2008). “Needs Assessment Report”, prepared by Govt. of Bihar, World Bank, Global Facility for Disaster Reduction & Recovery;
[3] Chakraborty, T., Kar, R., Ghosh, P., Basu, S. (2010). “Kosi megafan: historical records, geomorphology and the recent avulsion of the Kosi River”. Quaternary International 227 (2): 143–160.
[4] Gespeichert von Manohar am/ um, (6. September 2008 “Bihar – Kosi River)“, – 13:17, Hier einige interessante Details zum Kosi River http://www.amurt.eu/node/21.
[5] http://en.wikipedia.org/ wiki/Koshi_River
[6] Kale, V S (2008): “Himalayan Catastrophe that Engulfed North Bihar”, Journal of the Geological Society of India, 7: 713-19.
[7] Mishra, D K (2008a): “Serpent Tied around the Neck: Kosi Embankment” (Hindi language), (Patna, India: Freedom from Floods Campaign). – (2008b): “Bihar Floods: The Inevitable Has Happened”, Economic & Political Weekly, 6 September. – (2008c): “The Kosi and Embankment Story”, Economic & Political Weekly, 15 September.
[8] Reddy, D V, D Kumar, D Saha and M K Mandal (2008): “The 18 August 2008 Kosi Embankment Breach: An Evaluation”, Current Science, 95(12): 1668-69.
[9] Sharma, U. P. (1996). “Ecology of the Koshi river in Nepal- India (north Bihar): a typical river ecosystem”, In Jha, P. K., Ghimire, G. P. S., Karmacharya, S. B., Baral, S. R., Lacoul, P. (eds.) Environment and biodiversity in the context of South Asia. Proceedings of the Regional Conference on Environment and Biodiversity, March 7–9, 1994, Kathmandu. Ecological Society, Kathmandu. Pp 92–99.
[10] Shekhar, Shashi, (2002) “Coping with Floods: A Case of Kosi Floods”, appeared in Regional Development Studies (RDS), Vol- 8, 2002, an UNCRD publication from Nagoya, Japan.
[11] Sinha, R (2008): “Kosi: Rising Waters, Dynamic Channels and Human Disasters”, Economic & Political Weekly, 15 November.
[12] Thakkar, Himanshu (2009): “Submission to the Kosi Enquiry Co on Kosi Embankment Breach 2008 (10 March 2009)” by the South Asian Network, Rivers and People.


 (No Ratings Yet)


Leave your response!