| Applications | |
Sea level change – An inconvenient fact or an irritating fiction?
Claims that sea level has not risen significantly over the last 150 years and, indeed, should not be expected to do so over the next 100 years can be safely disregarded |
 |
|
In 2012 the United Nations Environment Programme issued its report on the most important emerging issues related to the global environment (UNEP, 2012). The top ranked issue in that report related to the alignment of land governance to the challenges of global sustainability. Global sustainability, however, has itself been firmly linked by the UN both to the challenges of mitigating the effects of climate change, and adapting to its impacts (UN, 2013). If anthropogenic climate change is a fiction or, indeed, presents little threat to the world of the future, then the challenge of global sustainability becomes considerably less severe, giving the human race more time to deal with some of its deep environmental issues.
One of the impacts of climate change of particular concern to surveyors is the issue of sea level rise. The height systems used for topographic mapping and for building coastal engineering infrastructure (e.g., storm water systems, bridges, roads, etc.) are typically referenced to Mean Sea Level (MSL). Coastal cadastral boundaries are also defined with respect to sea level datums such as Mean High Water (MWH) or Mean High Water Springs (MHWS). If there is no steady rise in sea level then apart from storm damage and the normal coastal erosion processes that have prevailed over the last two millennia, there should be no concern with possible long-term inundation.
While sceptics make many assertions regarding climate change, this paper will focus specifically on arguments with respect to sea level change. Having refuted these arguments, it will then suggest a reasonable sea level rise scenario that can be used for future planning purposes.
The academic context
A perusal of a wide sample of the papers written by perhaps the most quoted sea level rise sceptic, Professor Nils Mörner, reveal him to be very capable paleogeophysicist with advanced knowledge of the Earth’s lithosphere and plasticity. He has clearly undertaken a great deal of research into historical vertical crustal movements in Scandanavia over geological time scales (i.e., the last 100,000 BP). This peer-reviewed material, mostly published well over a decade ago, is widely available. The knowledge developed from these studies, together with more recent field trips to places such as the Maldive Islands and Bangladesh forms the basis from which Professor Mörner makes various assertions regarding present and future sea level rise.
It is unfortunate that in some regards Professor Mörner’s credibility as an expert in modern day global sea level rise is called into question by a lack of recent credible publications in high quality academic journals. Many of these recent publications appear essentially as personal opinion pieces. This issue is discussed later in this paper. Additionally, peer reviewed publications by Professor Mörner related to the comprehensive analysis of a global set of modern day tide gauge records such as have been done by Douglas, (1997); Peltier, (2001); Woodworth et al, (2008); Church and White, (2011); or Jevrejeva et al, (2013) appear not to exist.
The primary assertions
Before elucidating upon the primary assertions advanced by Professor Mörner, it is perhaps useful to note that the author is in full agreement with him on the need to use reliable observational data as the basis for the assessment of sea level rise as seen in the present day. It is from this perspective that the assertions made have been considered.
Assertion 1: There is no Rising Trend in Global Sea Levels
Mörner (2007a) is explicit is this assertion. He speaks of a maximum rising trend in global sea levels of 1.1 mm/yr from 1850-1930 followed by a fall. The net result is, in his words, “absolutely no trend”. He notes that tide gauging is very complicated, giving different answers wherever one might be in the world, thus necessitating the use of geological information for a correct interpretation of the results. There is no dispute with this comment. Not only are different regions of the world subject to different levels of glacio-isostatic adjustment (GIA) following earlier ice ages but local tide gauges can be subject to local subsidence due to ground water withdrawal or sediment compaction, and also to differing levels of tectonic deformation. These effects are well known and are fully described in Hannah, (2010). Indeed, there are many other errors that can subtley influence a tide gauge record (e.g., unrecorded datum offsets), that are not mentioned and that can be far more important to a correct interpretation of a tide gauge record.
When all these effects are appropriately considered, the observational data from a global set of reliable tide gauges will provide an unambiguous answer to the issue of global sea level trends over the 20th Century. Douglas (1997), using 24 long tide-gauge records and Tushingham and Peltier’s (1991) GIA model estimated global sea levels to be rising at a rate of 1.8 ± 0.1 mm/yr. Peltier (2001), using essentially the same tide gauge set plus a more recent GIA model estimated the rise to be 1.84 – 1.91 mm/yr. Importantly, these are the very systematic effects that Mörner himself advocates as necessary for correcting tide gauge data.
Church and White (2011), using a ”reconstruction” method on a sea level data set that extended from 1880-2009, determined a global sea level trend of 1.6 mm/yr when the data was weighted by its uncertainty estimates (a statistically correct procedure). Jevrejeva et al (2013), using a global set of 1227 tide gauge records, taken in 14 ocean basins/regional blocks, calculate a linear sea level trend of 1.9 ± 0.3 mm/yr for the 20th century. They note, however, that the choice of GIA correction is crucial to the result, having the ability to alter the global trend by 0.3-0.6 mm/yr. In New Zealand’s case the observational data are unambiguous in revealing a non GIA corrected estimate of sea level rise since 1900 of 1.7 ± 0.1 mm/yr and a GIA corrected estimate of 2.1 mm/yr (Hannah, 2004; Hannah and Bell, 2012). In arriving at these figures, all factors have been considered, including any possibility of tide gauge subsidence.
Irrespective of the analysis method used, the data set and the researcher, the outcome is the same, namely, that contrary to Professor Mörner’s assertions, global eustatic sea levels have been rising consistently throughout the 20th Century at an average linear rate in the order of 1.8 mm/yr . It is of interest to note that the more recent presentations of some sceptics depart from Professor Mörner’s position by acknowledging the reality of this rise. This is encouraging to see.
Assertion 2: The Results from Satellite Altimetry Data have been Fudged
While satellite altimeters have been in use since the 1980s, high precision altimetry began with the launch of Topex/Poseidon in 1992 and its successors Jason-1 (2001) and Jason-2 (2008). It is the data from these last three missions that is in question here.
While it is difficult to fully understand the nature of the problem being identified in Mörner (2007a), it becomes clearer both in Mörner (2003) and in the subsequent discussions found in Nerem et al, (2007) , and Mörner (2007b). In part, Mörner appears to start from the premise that his view of global sea level rise, as outlined in Sec 3.1 is correct and that any contradictory evidence is incorrect. He thus dismisses the work of Douglas (1991, 1995, and 1997) as being “widely debated and far from generally accepted” (Mörner, 2007b). Unfortunately he is incorrect on both issues in that Douglas’work has been shown to be both robust, and has also been widely accepted, both by other paleogeophysicists (e.g., Peltier, 2001) and now, seemingly, by some sceptics . When sea level data from a global tide gauge network is used to calibrate the satellite altimeter data (as is the case), Mörner dismisses the subsequent altimeter results as having been fudged.
The second, but associated leg to Mörner’s argument is the bias that he claims exists between the three different satellite missions. While the author of this paper advises caution on the bias issue, the weight of evidence suggests that Mörner ’s criticisms lack substance. These are refuted in Nerem et al (2007). In addition, the process of calibrating a satellite alimeter is described at www.psmsl.org/train_and_info/training/gloss/gb/gb1/alt_cal.html), whilst the creation of a single uniform altimeter data set from the various satellite altimeter missions is described in Leuliette et al, (2004) and Beckley et al, (2010). Both processes are open and transparent. Furthermore, Meyssignac and Cazenave (2012), show the full altimetry based mean sea level data set superimposed upon the 20th century mean sea level data set. Crucially, both data sets show an almost linear rise in sea level over the entire altimetry time period (1993-2010) with the altimetry data revealing a 3.2 ± 0.5 mm/yr rise over those years. Importantly, and over the same time period, Church and White (2011) estimate a sea level rise using in situ tide gauge data of 2.8 ± 0.8 mm/yr. Jevrejeva et al (2013) refine this estimate to 3.1 ± 0.6 mm/yr.
As an aside, the satellite altimetry record merely complements the ongoing tide gauge record. New data sets such as those associated with recent gravity satellite missions are becoming available and should, as their time series lengthen, add to the picture . In New Zealand, the linear sea level trend as determined from the tide gauge record at Auckland (perhaps the most stable and reliable in New Zealand), has been analysed as two distinct series. The first from 1899 – 1992 and the second from 1899 – 2013. The second, which includes the complete altimetry period, shows that the rate of rise in mean sea level has increased by 0.19 ± 0.13 mm/yr, a result that while not yet quite statistically significant certainly corroberates with the results being delivered by the altimetry data (Denys et al, 2014).
Assertion 3: Sea Levels in the Maldives Fell 20-30 cm in the 30 years Prior to 2004
This claim can be found in Mörner et al (2004) and is used as evidence to support his contention that global sea levels are not rising. Fortunately this claim, which is based upon an interpretation of morphological and sedimentological data, is made in a peer reviewed paper and thus is open to much wider scientific scrutiny than publications such as Mörner (2007a) or Mörner (2010). Mörner himself notes that a rate of change of 10 mm/yr in sea level is “most surprising”, attributing this fall to “a regional eustatic change confined [my emphasis], to the central Indian ocean”. This fall is attributed to the effect of increased evaporation. The objections to Mörner et al’s comments are multiple.
Firstly, if the sea level fall were actually real, Mörner has already conceded that it can only be a localised regional effect. In that case, it cannot be used as the basis for any definative statement regarding global sea level change.
Secondly, Woodworth (2005), after examining a number of met-ocean data sets and regional climate indicies, at least one of which would have been expected reflect a large sea level fall, could find no supporting evidence for such a fall. He not only concluded that such a fall was, ”implausible” but that the suggestion that it could have been caused by an increase in evaporation was demonstrably incorrect.
Thirdly, Kench et al (2004), challenge the correctness both of Mörner et al’s interpretations and the conclusions drawn from their morphological evidence. Mörner and Tooley (2005) seek to reply to these challenges but are unable to do so in any detail, substantially falling back on the argument that all will be revealed in future presentations of their observational material. To the best of the author’s knowledge, such peer review assessments as to the content and accuracy of this additional data have yet to appear.
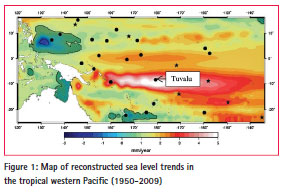
Assertion 4: There is no Rise in Sea Level at the Tuvalu Islands
As with the Maldives, this claim is made as supporting evidence that global sea levels are not rising. In Mörner’s words,’There is absolutely no signal that the sea level is rising”.
The first response to this assertion is, to wonder why this should be important. The Tavalu Islands are located close to an active and complex plate tectonic zone where vertical crustal deformation is likely. Until there is a history of tide gauge data coupled with continuous GPS data at the same site, any determination of the rise or fall in eustatic sea level at this location will be uncertain.
However, putting this issue aside, Becker et al (2012) have examined in detail sea level variations in the tropical Pacific islands since 1950. By reconstructing the sea level record from 1950-2009 through the use of good quality tide gauge records and gridded heights an Ocean General Circulaton Model, they find that sea level has risen at Tavalu at a rate of approximately 5.1 ± 0.7 mm/yr over the period 1950-2009. This result takes full cogniscance of the known periodic effects such as the 2-4 year ENSO effect and the 20-30yr Interdecadal Pacific Osillation (IPO). The reconstructed sea level trends for the tropical western Pacific taken from Becker et al (2012), are shown below.
The Broader Picture
It is important to note that Professor Mörner typically chooses to make his assertions in non-peer reviewed publications. This is nowhere more apparent than in Mörner (2010) – a document that is more explicit in its critisms than Mörner (2007a). In this more recent document, he not only substantially fails to address the criticisms of his work as raised earlier in this paper, but he introduces new inaccuracies. He states for example, that local sedimentary ground changes cannot be recorded – overlooking the fact that many world tide gauge sites have been precisely monitored for well over 100 years using leveling techniques, and by GPS measurement techniques for at least a decade (e.g., Wöppelmann et al, 2009, Santamaría-Gómez et al, 2012).
Interestingly, Professor Mörner’s writings indicate that he is an advocate of the theory that there is a global conspiracy amongst many of the world’s scientists aimed towards confusing and deluding the unsuspecting public. Their supposed motivation – a desire to obtain and/or retain their research grants (Mörner, 2007a). In Mörner (2010), he further accuses scientists as being driven by a hidden 23 year old Intergovernmental Panel on Climate Change (IPCC) agenda that specifies what tide gauges in a global network should be selected for analysis. Having been associated with the first three IPCC assessment reports, the author of this paper can testify personally that this is a delusion of the highest order. Furthermore, the author has no research grants that hinge upon climate change and no vested interests in any particular outcome of this discussion, beyond seeing truth prevail.
Future sea level change
If there is a point at which the author and Professor Mörner are likely to agree, it is in the difficulty of assessing a most likely sea level rise scenario for the future. Clearly, some predictions have been alarmist in nature and not based upon strong science. However, as the science has improved so has the understanding of likely future sea level rise. It is now understood, for example, that while a global sea level rise scenario can be determined, it is likely that there will continue to be significant regional variations for periods of a decade or more, most likely due to changes in trade winds and other forcing factors (IPCC, 2013). Equally, vertical land motion due to local subsidence, GIA, or other tectonic factors will also have a marked influence. Fortunately, GPS techniques now allow such land motion to be measured in a global reference frame with a high degree of confidence.
While these factors must be recognised as being of potential influence in any local or regional future sea level rise scenario, a realistic estimate for a global sea level change scenario is still of importance.
Any future assessment of sea level change rests heavily upon the extent to which climate changes – change that is estimated through the use of climate models. These models produce a wide range of possible outcomes depending upon the various forcing factors used – factors that in turn depend upon assumptions relating to industrial growth, greenhouse gas emissions, deforestation, the impact of clouds, and human response (amongst other things).
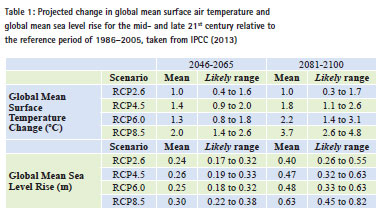
IPCC (2013) provides a number of climate change model scenarios derived from the concentration-driven CMIP5 model simulations. The different model simulations produce temperature change scenarios that are then combined with process based models and a literature assessment of glacier and ice sheet contributions to produce associated sea level change scenarios. These results, which vary between the strictest emissions mitigation scenario (RCP2.6) to a high emissions scenarion (RCP8.5) are shown in Table 1. While higher projections for sea level rise than are shown in the table have been mooted, the IPCC considers that there is insufficient evidence to evaluate the probability of specific levels above the ranges shown. There remains a lack of consensus and low confidence in the semi-empirical model projections.
Table 1. Projected change in global mean surface air temperature and global mean sea level rise for the mid- and late 21st century relative to the reference period of 1986–2005, taken from IPCC(2013)
|
2046-2065 |
2081-2100 |
||||
|
Scenario |
Mean |
Likely range |
Mean |
Likely range |
|
|
Global Mean Surface Temperature Change (ºC) |
RCP2.6 |
1.0 |
0.4 to 1.6 |
1.0 |
0.3 to 1.7 |
|
RCP4.5 |
1.4 |
0.9 to 2.0 |
1.8 |
1.1 to 2.6 |
|
|
RCP6.0 |
1.3 |
0.8 to 1.8 |
2.2 |
1.4 to 3.1 |
|
|
RCP8.5 |
2.0 |
1.4 to 2.6 |
3.7 |
2.6 to 4.8 |
|
|
Scenario |
Mean |
Likely range |
Mean |
Likely range |
|
|
Global Mean Sea Level Rise (m) |
RCP2.6 |
0.24 |
0.17 to 0.32 |
0.40 |
0.26 to 0.55 |
|
RCP4.5 |
0.26 |
0.19 to 0.33 |
0.47 |
0.32 to 0.63 |
|
|
RCP6.0 |
0.25 |
0.18 to 0.32 |
0.48 |
0.33 to 0.63 |
|
|
RCP8.5 |
0.30 |
0.22 to 0.38 |
0.63 |
0.45 to 0.82 |
Given a mean reference period date of 1995, and an assumed rise in sea level of about 3 mm/yr since then (i.e., 0.05 m to the present day), a reasonable planning range for sea level rise to 2090 from the present day is between 0.21 m and 0.77 m (i.e., 0.26–0.05 m and 0.82-0.05 m).
In deriving a sea level change scenario for a particular region, one needs to take the global figures given above and correct them for any ground motion derived from local precise leveling and GPS tide gauge monitoring data. In New Zealand, for example, where a general tectonic stability seems to have prevailed over the last 100 years (the Wellington excluded over the last 15 years and the Christchurch region since 2010), and where the local rates of sea level rise almost exactly match the global average, these numbers can be used directly.
Conclusions
Global oceans have been rising at a linear rate of approximately 1.8 mm/yr throughout the 20th century with satellite altimetry data, and other sources, indicating an increase in rate to 3.2 ± 0.5 mm/yr from 1993-2009. While there remains some debate as to whether or not this increase is permanent or whether that it reflects some periodic oceanic signal, or whether there has been an acceleration in the rate of sea level rise over the last few decades, best future sea level rise scenarios indicate a likely rise in global sea levels of between 0.26 m and 0.82 m, relative to 1986-2005 by 2081-2100. Claims that sea level has not risen significantly over the last 150 years and, indeed, should not be expected to do so over the next 100 years can be safely disregarded.
References
Becker, M., Meyssignac, B., Letetrel, C., Llovel, W., Cazenave, A., and Delcroix, T., (2012). Sea level variations at tropical Pacific islands since 1950”, Global and Planetary Change, 80-81, 85-98, doi.org/10.1016/j.gloplacha.2011.09.004.
Beckley, B.D., Zelensky, N.P., Holmes, S.A., Lemoine, F.G., Ray, R.D., Mitchum, G.T., Desai, S., and Brown, S.T. (2010). Assessment of the Jason-2 extension to the TOPEX/Poseidon, Jason-1 sea-surface height time series for global mean sea level monitoring, Marine Geodesy, 33(S1): 447-471, 2010, Supplemental Issue on OSTM/Jason-2 calibration/validation, Vol. 1, DOI: 10.1080/01490419.2010.491029.
Church, J.A., and White, N.J., (2011). Sea-level rise from the late 19th to the early 21st century, Surv. Geophys., doi 10.1007/s10712-011-9119-1.
Denys, P., Beavan, J., and Hannah, J., (2014). Sea-level rise in New Zealand: The separation of vertical land motion from the tide gauge record. In preparation, J. Geophy. Res.
Douglas, B.C., (1991). Global sea level rise, J. Geophys. Res. 96, 6981-6992.
Douglas, B.C., (1995). Global sea level changes: determination and interpretation, Rev. Geophys. 33, 1425-1432.
Douglas, B.C., (1997). Global sea level rise: A redetermination, Surveys in Geophysics 18, 279-292.
Hannah, J., (2004). An updated analysis of long term sea level change in New Zealand, Geophysical Research Letters, 31, L03307, 4 pp.
Hannah, J., (2010). The difficulties in using tide gauges to monitor long-term sea level change, FIG XXIV Congress, Sydney, April 2010.
Hannah, J., and Bell, R.G., (2012). Regional sea level trends in New Zealand. J Geophys. Res., doi:10.1029/2011JC007591.
IPCC, (2013). Summary for Policymakers. In: Climate Change 2013: The Physical Science Basis. Contribution of Working Group I to the Fifth Assessment Report of the Intergovernmental Panel on Climate Change [Stocker, T.F., D. Qin, G.-K. Plattner, M. Tignor, S.K. Allen, J. Boschung, A. Nauels, Y. Xia, V. Bex and P.M. Midgley (eds.)]. Cambridge University Press, Cambridge, United Kingdom and New York, NY, USA.
Jevrejeva, S., Moore, J.C., Grinsted, A., Matthews, A.P., and Spada, G., (2013). Trends and acceleration in global and regional sea levels since 1807, Global and Planetary Change, doi.org/10.1016/j.gloplacha.2013.12.004.
Kench, P.S., Nichol, S.L., and McLean, R.F., (2004). Comment on “New perspectives for the future of the Maldives by Mörner, N.A., et al. [Global Planet. Change 40 (2004), 177–182]”, Global and Planetary Change 47, 67-69, doi/10.1016/j.gloplacha.2004.12.001.
Leuliette, E.W., Nerem, R.S., and Mitchum, G.T., (2004). Calibration of TOPEX/Poseidon and Jason altimeter data to construct a continuous record of mean sea level change, Marine Geodesy, 27 (12), 79-94.
Meyssignac, B., and Cazebave, A., (2012). Sea level: A review of present-day and recent-past changes and variability, J. of Geodynamics, 58, 96-109, doi:10.1016/j.jog.2012.03.005.
Mörner, N.A., (1973). Eustatic changes during the last 300 years, Paleogeography, Paleoclimate, Paleoecology, 13,1-14.
Mörner, N-A., (2003). Estimating future sea level changes from past records, Global and Planetary Change, 55, 49-54, doi:10.1016/S0921-8181(03)00097-3.
Mörner, N-A., (2007a). Sea-level expert: It’s not rising, found in 21st Century Science & Technology, Fall Edition.
Mörner, N-A., (2007b). Comment on comment by Nerem et al. (2007) on ”Estimating future sea level changes from past records” by Nils-Axel Mörner (2004), Global and Planetary Change, doi:10.1016/j.gloplacha.2008.03.002.
Mörner, N-A., (2010). There is no alarming sea leve rise!, found in 21st Century Science & Technology, Winter 2010/2011 edition.
Mörner , N.A., and Tooley, M (2005). Reply to the comment of P.S. Kench et al. on “New perspectives for the future of the Maldives” by N.A. Morner et al. [Global Planet. Change 40 (2004), 177-182], Global and Planetary Change 47, 70-71, doi:10.1016/j.gloplacha.2004.12.002.
Mörner, N-A., Tooley, M., and Possnert, G., (2004). New perspectives for the future of the Maldives, Global and Planetary Change 40, 177-182, doi:10.1016/S0921-8181(03)00108-5.
Nerem, R.S., Cazenave, A., Chambers, D.P., Fu, L.L., Leuliette, E.W., and Mitchum, G.T., (2007). Comment on ”Estimating future sea level change from past records” by Nils-Axel Mörner, Global and Planetary Change 55, 358-360, doi:10/1016/j.gloplacha.2006.08.002.
Peltier, W.R., (2001). Global glacial isostatic adjustment and modern instrumental records of relative sea level history, in Sea Level Rise History and Consequences, edited by B.C. Douglas et al., Academic Press, San Diego, 2001.
Santamaría-Gómez, A., Gravelle, M., Collilieux, X., Guichard, M., Martín Míguez, B., Tiphaneau, P., and Wöppelmann, G., (2012). Mitigating the effects of vertical land motion in tide gauge records using a state-of-the-art GPS velocity field, Global and Planetary Change, 2012, 98-99, 6-17, doi: 10.1016/j.gloplacha.2012.07.007.
Tushingham, A.M., and Peltier, W.R., (1991). ICE-3G – a new global model of late pleistocene deglaciation based upon geophysical predictions of post glacial relative sea level change, J. Geophys. Res. 96, 4497-4523.
UN, (2013). The millenium development goals report, found at http://www.un.org/millenniumgoals/reports.shtml.
UNEP, (2012). 21 Issues for the 21st century: Result of the UNEP foresight process on emerging environmental issues. United Nations Environment Programme, Nairobi, Kenya.
Woodworth, P.L., (2005). Have there been large recent sea level changes in the Maldive Islands?, Global and Planetary Change 49, 1-18, doi:10.1016/j.gloplacha.2005.04.001.
Woodworth, P.L., White, N.J., Jevrejeva, S., Holgate, S.J., Church, J.A., and Gehrels, W.R., (2008). Evidence for the accelerations of sea level on multi-decade and century time scales”, Int. J. Climatology, 29, 777-780, doi:10.1007/s10712-011-91112-8.
Wöppelmann, G., Letetrel, C., Santamaria, A., Bouin, M.N., Collilieux, X., Altamimi, Z., Williams S.D.P., and Miguez, B.M., (2009). Rates of sea-level change over the past century in a geocentric reference frame, Geophysical Research Letters 36: L12607, doi: 10.1029/2009gl038720.
It is an updated version of a paper presented at the TS03D Joint session: Task Force on Surveyors and Climate Change/ Commission 7, FIG Congress 2014, Kuala Lumpur, Malaysia, 16 – 21 June 2014.


 (101 votes, average: 4.81 out of 5)


