| Disaster Management | |
Satellite based assessment of the damage caused by Tauktae cyclone in Gir protected area
Cyclone ‘Tauktae’ hit the Gujarat coast, India on May 17, 2021, which affected the Gir National Park, a wildlife sanctuary for Asiatic lions. In order to do a quick assessment of the affected area, a suite of optical and microwave satellite datasets were analysed for pre and post cyclone periods |
 |
|
 |
|
 |
|
 |
|
 |
|
Abstract
A cyclone named, ‘Tauktae’ hit the Gujarat coast of India on May 17, 2021, which affected the Gir protected area. The Gir Forest National Park is a wildlife sanctuary in western India that was established in 1965 to protect Asiatic lions. In order to do an assessment of the affected habitat of lion, a suite of optical and Synthetic Aperture Radar (SAR) space borne satellite datasets were analysed. Pre and post cyclone periods were acquired along with past years historical datasets of same periods to study the deviations of signals from the mean of normal years. Vegetation indices with textural measures (entropy) were considered for the damage assessment. Finally, the fusion of optical and SAR data was done for assessment on varying degree of damages. Around 30 per cent area was found affected while estimated damaged area had inherent error margin of ± 5 per cent, with a confidence level of 95 per cent. Deriving the average density of the trees in Gir protected area with drone-based survey, it was predicted that around 3.3 million trees were affected (under moderate to high category). This technique of damage assessment for a large protected area is very useful for the park managers.
Introduction
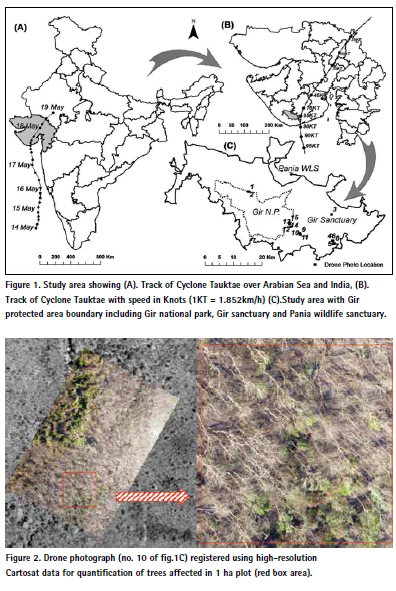
A very powerful tropical cyclone was born over the Arabian Sea on May 13, 2021, later named as “Tauktae” which subsequently made landfall in the Indian state of Gujarat (approx. 27 km east of Diu) on May 17, 2021. After making landfall, moving further inland it gradually weakened and ended as a low-pressure area on May 19, 2021 (fig.1A). At the time of landfall on the Gujarat coast, Tauktae reached its peak intensity with maximum 3-minute sustained winds of 195 km/h and maximum 1-minute sustained winds of 220 km/h, and a minimum central pressure of 950 millibars making the storm the equivalent of a Category-4 tropical cyclone on the Saffir–Simpson scale1. The districts of Junagadh, Gir-Somnath, Amreli and Bhavnagar were highly affected by heavy rainfall and winds (fig.1B). The high wind velocity in Gir forest area reportedly overturned a large number of trees.
Gir National Park and Wildlife Sanctuary, also known as Sasan Gir, is a forest and wildlife sanctuary to conserve the Asiatic Lion. It was established in 1965 with a total area of 1,412 km2 of which 258 km2 is fully protected as national park and 1,153 km2 as wildlife sanctuary. Pania wildlife sanctuary (39.63 km2) was also included in the study area as it’s an integral part of Gir protected area (fig.1C). Altitudinal range of the area varies between 83 – 524 m above mean sea level. The area is a dry deciduous open scrub forest with dry savannah. Acacia, Butea, Diospyros, Ficus, Syzygium, Tectona, Zizyphus etc are the main tree species of the area. Approximately, 63.5 per cent area has forest canopy density < 10–40 per cent, and about 35.89 per cent forest has density > 40 per cent to > 70 per cent (Alam et al., 2014). Phenology of this dry deciduous forest is marked with leaf fall in the winter months and maximum senescence is observed in the summer months (March – May).
Materials and methods
The major objective of this study was to have a quick assessment of damage caused using space-borne optical and synthetic aperture radar data. Vegetation indices (VIs) in optical and synthetic aperture radar (SAR) domains were derived for pre-cyclone and post cyclone periods. Sentinel-2B MSI (Multispectral Instrument) band 4 – Red and band 8 – NIR datasets at 10 m spatial resolution with acquisition dates of 10 and 20 May 2021 (pre and post cyclone), 20 May 2020, 18 May 2019, 18 May 2018 and 23 May 2017 (historical data of post cyclone dates) were used. Sentinel-1A C-Band SAR datasets at 10 m spatial resolution with acquisition dates of 9 and 21 May 2021 (pre and post cyclone), 26 May 2020, 20 May 2019, 25 May 2018 and 18 May 2017 (historical data of post cyclone dates) were also used. The standard pre-processing techniques were used for arriving at the Normalized Difference Vegetation Index (NDVI, eq.1) and Radar Vegetation Index (RVI, eq.2) followed by computation of anomalies from mean trends of the past years. All the standard pre-processing and post-processing steps were followed using open domain software suits. In order to remove the incidence angle effect in SAR data, the backscattering across the range was normalized using the calibration coefficients. The backscatter coefficient in the normal unit domain was used for computation and then finally converted into log domain, to avoid arithmetical errors. The scattering characteristics of forest vegetation and other land use types were studied using dual-pol data over the study site, both in pre and post cyclone phases.
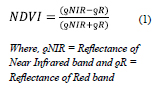
Care was taken to understand the forest – SAR interactions under the given conditions with respect to the canopy, vegetation structure and background information. Both the vegetation indices (NDVI and RVI) were subjected to slicing (thresholding) based on post cyclone field photographs (drone survey pictures provided by Gujarat forest department, see the locations in fig.1C) and statistical distributions of the data, in order to come out with qualitative assessment on affected areas. The drone survey photographs were registered with archived Cartosat-2C (60 cm spatial resolution) and were used (with 10 – 13 cm spatial resolution) in the analysis as the ground truth information (fig.2). From the limited set of photographs obtained, the tree density over the area was also computed.
![]()
Where, σο = Sigma-nought, VH = vertical transmit and horizontal receive and VV = vertical transmit and vertical receive
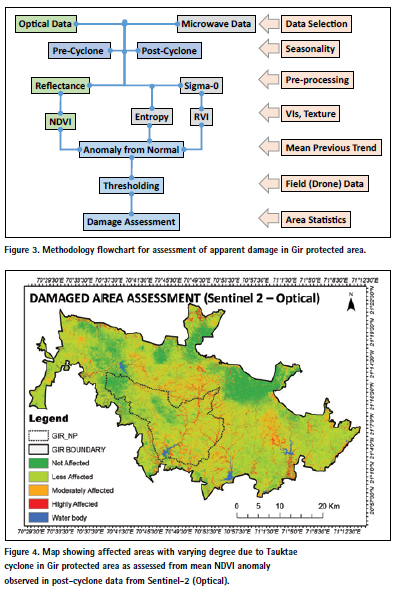
SAR data was also used for computation of change in entropy of the study site in post cyclone period as compared to pre cyclone. Grey Level Cooccurrence Matrix (GLCM) based measure of entropy with direction invariant relationships were considered. A window size of 15×15 was used for the construction of the GLCM on SAR data. The entropy could not reveal the subtle textural variations through the entire study area. However, the information layer from entropy was used in conjunction with the cross polarisation ratio of VH/VV and VH to demarcate zones of potentially affected areas as a preliminary guide to the analysis. The RVI anomaly was then used in conjunction with the optical data based NDVI anomaly to do a conformity analysis and to ascertain the actual affected area. Combining these two sets of information, also eliminated bias and uncertainty as both the sensors view the target differently. The overall methodology flowchart is given in fig.3.
Results and discussion
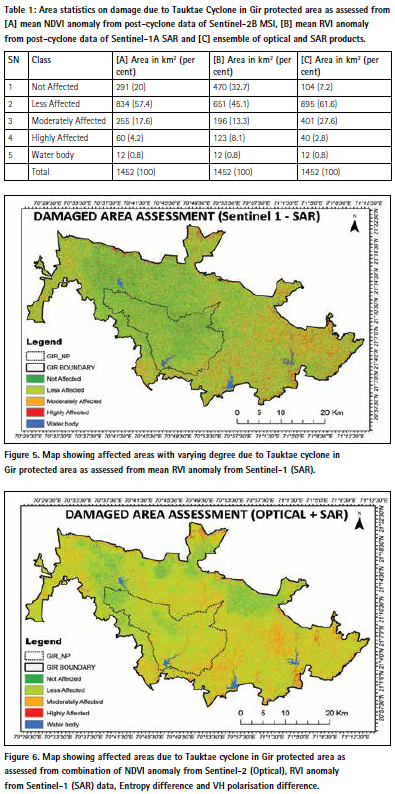
Since two different methods of evaluation having different physical basis of observations were adopted, the results were first analyzed separately. The observations derived from optical remote sensing data relied mainly on detecting the changes in greenness level considering the fact that some of the areas along the moisture zone (drainages) which were having leaf-on trees may have changed after being uprooted due to cyclone. The area affected due to cyclone were mainly found scattered around the moisture zone in the Gir protected areas as seen in fig.4. The area statistics is provided in table.1[A], which indicates that around 21.8 per cent area was affected under moderate to high category.
SAR backscatter values from the forest vegetation during the driest months of the year tend to show a decrease, which is more prominent in the VH polarization. The affected areas showed anomaly in backscatter, which could be due to two main reasons, the structural changes in the tree orientation and the underlying soil. As scattering from soil under the uniform roughness conditions can be considered nearly similar, both under very dry and very wet conditions. It was assumed to contribute marginally to the mean difference of RVI pre and post cyclone. The changes in the backscatter can be attributed more to the trunk and branches. To further the analysis, the post cyclone RVI was compared against the mean RVI of the preceding five years data and the anomaly in the RVI revealed the significant changes in the backscatter, which are indicative of the affected area. From the difference of the RVI it was found that most of the sanctuary was affected. The changes in SAR based RVI anomaly data is mainly attributed to change in structural component (vertical trees in pre-cyclonic period to horizontal trees in post cyclonic period), assuming that moisture in the area due to rains remain same. The result of the anomaly in RVI is shown in fig. 5 and areas statistics is given in table.1[B], which indicates that around 21.4 per cent area was affected under moderate to high category.
Though, the figures in both the assessments for moderate to highly affected areas (21.8 per cent in optical and 21.4 per cent in SAR) look similar, the spatial disturbance zones do not have exact match. Therefore, a map was constructed from the synergistic use of NDVI anomaly, RVI anomaly, entropy difference (pre – post) and difference in backscatter (pre – post) from target in VH polarization so that, the mutually exclusive affected areas could be identified. The ensemble product of optical and SAR data was subjected to thresholding based on quantile (by dividing the histogram into areas of equal probability) to arrive at qualitative assessment on varying degree of damages caused by Tauktae cyclone, as shown in figure 6 and table.1[C]. Though the whole sanctuary was affected, the eastern part shows slightly higher magnitude than the west. The estimated area has inherent error margin of ± 5 per cent, with a confidence level of 95 per cent arising due to mapping inaccuracies and thresholding.
Conclusion
It is evident from the analysis that the Tauktae cyclone has affected approximately 30 per cent (441 sq km) of the Gir protected area with moderate to severe impact, primarily distributed across eastern Gir to Central Gir. Considering the average density of the trees in Gir forest of 75 Trees / 10,000 square meters (estimated from drone photographs), it is predicted that around 3.3 million trees would have been affected (under moderate to high category). More analysis with very highresolution data may be taken up to assess quantitative damages and loss of trees.
Endnote
1Special Tropical Cyclone Outlook for Cyclone Tauktae No. 19, https:// mausam.imd.gov.in. India Meteorological Department. Accessed on: 17 May 2021.
Reference
Alam, M. S., Khan, J. A., Pathak, B. J. and Kumar, S. (2014). Assessment of forest density using geospatial techniques of a tropical protected area, International Journal of Scientific and Research Publications, 4(3). 1-6.
Acknowledgements
This work has been carried out based upon the request of Gujarat Forest Department. Authors are thankful to Shri N. M. Desai, Director, SAC and Dr. I. M. Bahuguna, Deputy Director, EPSA/ SAC, ISRO, Ahmedabad for their constant encouragement and guidance. Authors are also thankful to PCCF, CWLW & Additional Chief Secretary, FED, Gujarat State and Dr Dheeraj Mittal, DCF, Gir (W) Forest Division for their support and keen interest. We acknowledge Copernicus open access hub for hosting near-real time satellite datasets. We are grateful to number of our colleagues from SAC and forest department who supported us with information and data base creation.


 (No Ratings Yet)


Leave your response!